

Key Insights
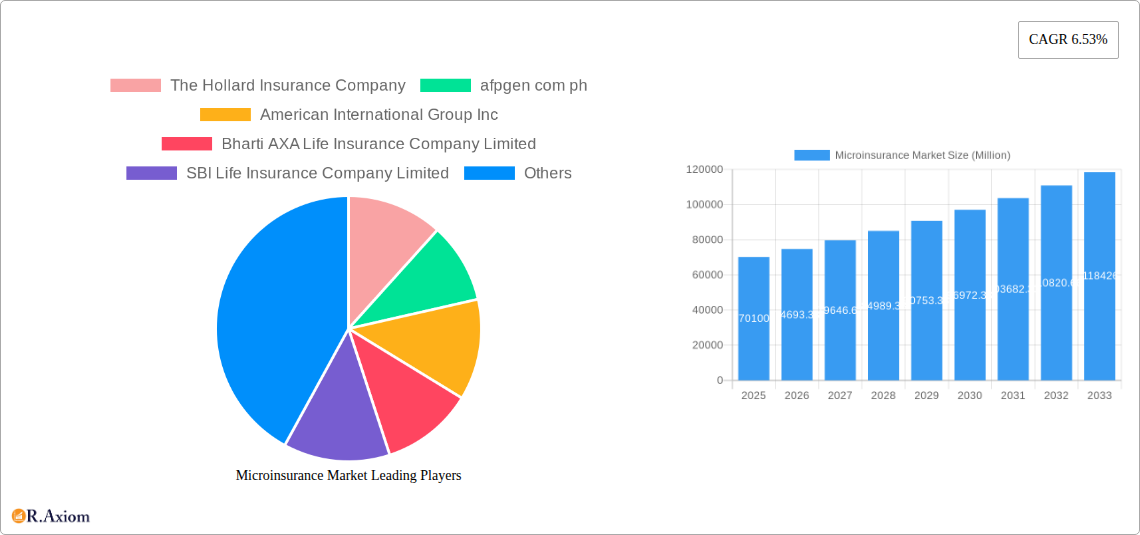
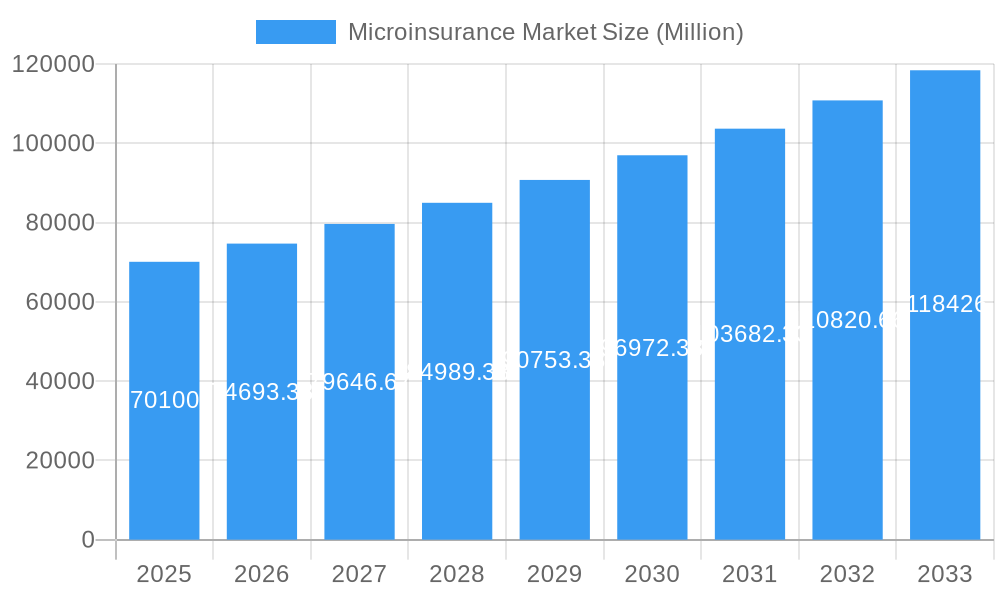
The global microinsurance market, currently valued at $70.10 billion (2025), exhibits robust growth potential, projected to expand at a Compound Annual Growth Rate (CAGR) of 6.53% from 2025 to 2033. This growth is fueled by several key drivers. Increasing financial inclusion initiatives in developing economies are expanding access to insurance for previously underserved populations. The rising adoption of mobile technology and digital platforms facilitates convenient and cost-effective microinsurance distribution, further driving market penetration. Furthermore, a growing awareness of the importance of risk mitigation and financial protection, coupled with government support and favorable regulatory frameworks in many regions, contributes significantly to market expansion. The market is segmented by product type (e.g., life, health, agricultural, property), distribution channels (e.g., agents, banks, mobile platforms), and geographical region. Key players include established insurers like Allianz SE, American International Group Inc., and Bharti AXA, alongside regional and specialized microinsurance providers. Competition is expected to intensify as more players enter the market, driving innovation and product diversification.
Microinsurance Market Market Size (In Billion)
Challenges remain, however. These include the high cost of customer acquisition in underserved areas, particularly in regions with limited digital infrastructure. Addressing these challenges requires strategic partnerships with local community organizations and innovative approaches to risk assessment and claims processing. Furthermore, regulatory hurdles and a lack of consumer awareness in certain markets present ongoing obstacles to widespread adoption. Despite these challenges, the long-term outlook for the microinsurance market remains positive, driven by sustained economic growth in developing economies, technological advancements, and a growing focus on financial inclusion globally. The market is expected to witness significant expansion, particularly in regions with large populations and underdeveloped insurance penetration.
Microinsurance Market Company Market Share
Microinsurance Market: A Comprehensive Report (2019-2033)
This detailed report provides a comprehensive analysis of the global microinsurance market from 2019 to 2033, offering invaluable insights for industry stakeholders, investors, and strategists. The study covers market size, growth drivers, challenges, and opportunities, with a focus on key players, segments, and emerging trends. The report leverages a robust methodology, incorporating historical data (2019-2024), a base year of 2025, and an estimated year of 2025, with forecasts extending to 2033.
Microinsurance Market Concentration & Innovation
This section analyzes market concentration, innovation drivers, regulatory frameworks, product substitutes, end-user trends, and M&A activities. The microinsurance market exhibits a moderately concentrated landscape, with a few large players holding significant market share. However, the emergence of Insurtechs and digital platforms is fostering increased competition.
- Market Concentration: The top 5 players account for approximately xx% of the market share in 2025 (estimated). Market concentration is expected to remain relatively stable during the forecast period, although smaller players are expected to grow.
- Innovation Drivers: Technological advancements, such as mobile payment systems and AI-powered risk assessment, are key drivers of innovation. Regulatory reforms promoting financial inclusion are also crucial.
- M&A Activity: Significant M&A activity has been observed, with deal values reaching xx Million in 2024. The Bharti AXA Life Insurance acquisition is a prime example of this trend.
- Regulatory Frameworks: Varying regulatory frameworks across different regions impact market growth and penetration. Favorable regulations that simplify licensing and streamline operations tend to positively influence market expansion.
- Product Substitutes: While no direct substitutes exist, alternative financial products, such as savings schemes, could compete for similar customer segments.
- End-User Trends: Growing demand for affordable and accessible insurance products among low-income populations drives market growth. The increasing adoption of mobile technology among this segment is further boosting the market's expansion.
Microinsurance Market Industry Trends & Insights
This section explores key industry trends and insights, focusing on market growth drivers, technological disruptions, consumer preferences, and competitive dynamics. The microinsurance market is experiencing robust growth, fueled by factors such as increasing financial inclusion initiatives, rising smartphone penetration, and the expanding middle class in developing economies.
The market is projected to register a CAGR of xx% during the forecast period (2025-2033). Market penetration, currently at xx%, is expected to rise to xx% by 2033. Technological disruptions, such as the use of mobile platforms for policy sales and claims processing, are transforming the industry. Consumer preferences are shifting towards digital-first solutions, and personalized products tailored to specific needs are gaining traction. Competitive dynamics are characterized by a mix of established players and new entrants leveraging technology and innovative business models.
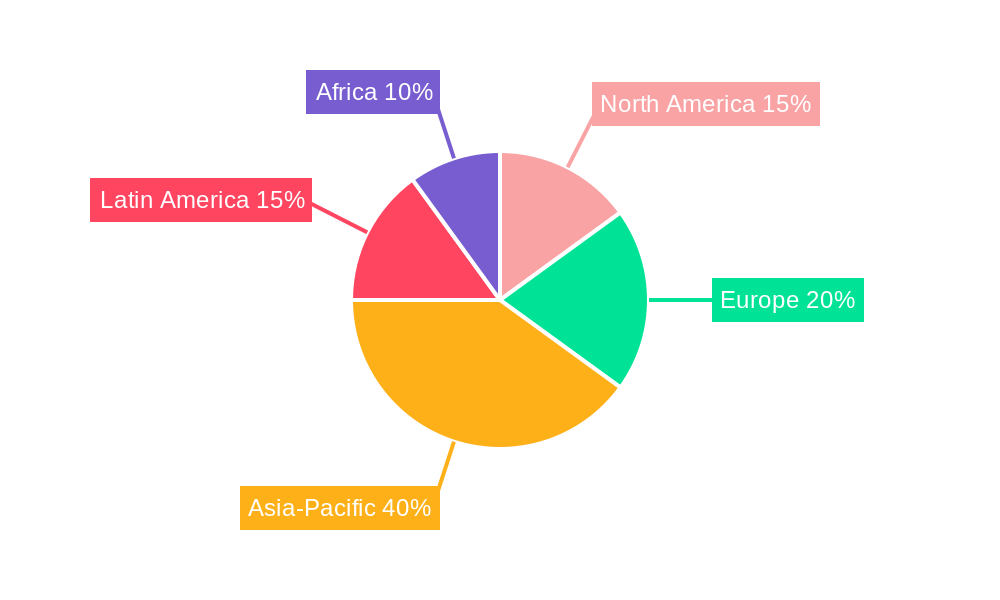
Dominant Markets & Segments in Microinsurance Market
This section highlights the leading regions, countries, and segments within the microinsurance market. Asia-Pacific is currently the dominant market, driven by high population density, increasing mobile and internet penetration, and supportive government policies.
- Key Drivers for Asia-Pacific Dominance:
- High population density, with a large proportion of the population in the low- to middle-income groups.
- Rapidly growing mobile and internet penetration.
- Government initiatives promoting financial inclusion.
- Favorable regulatory environment in certain countries. Detailed analysis reveals that India and other Southeast Asian nations exhibit substantial market potential due to the aforementioned drivers. Africa and Latin America are also emerging as significant markets with high growth potential.
Microinsurance Market Product Developments
Recent product innovations in the microinsurance market focus on leveraging technology to enhance accessibility, affordability, and customer experience. These advancements include the use of mobile-based platforms for policy distribution and claims processing, AI-driven risk assessment tools to improve underwriting efficiency, and the development of customized products tailored to specific needs of underserved populations. These advancements are improving the overall market fit and competitive advantage of microinsurance products.
Report Scope & Segmentation Analysis
This report segments the microinsurance market by product type (e.g., health, life, agricultural), distribution channel (e.g., direct sales, agents, partnerships), and geography. Each segment exhibits distinct growth trajectories and competitive dynamics. Growth projections vary significantly across these segments, with health and agriculture insurance sectors anticipated to witness the most rapid expansion over the forecast period. Market sizes for each segment are detailed within the full report, along with a granular competitive landscape analysis for each area.
Key Drivers of Microinsurance Market Growth
The microinsurance market's growth is propelled by several factors: increasing financial inclusion initiatives by governments across developing nations; expanding mobile penetration fostering wider access to insurance products; and the rising middle class, boosting demand for affordable protection. Technological advancements, such as mobile payment systems and AI-powered underwriting, are significantly streamlining processes and enhancing efficiency. Supportive regulatory environments in certain regions further facilitate market expansion.
Challenges in the Microinsurance Market Sector
Challenges include high operational costs associated with serving dispersed customer bases, regulatory hurdles varying across geographies, and competition from informal insurance providers. Furthermore, reaching and educating underinsured populations about the benefits of microinsurance presents a significant challenge, as does effectively managing risks related to fraud and claims processing efficiency in geographically dispersed markets. These factors contribute to the complexities of the microinsurance market.
Emerging Opportunities in Microinsurance Market
Emerging opportunities lie in leveraging the growing popularity of mobile platforms for service delivery, developing innovative products tailored to specific needs of underserved populations, expanding into new geographic markets, and utilizing data analytics to optimize risk assessment and pricing. Partnerships with mobile network operators and other technology platforms present significant growth potential, as do strategic alliances with financial institutions to enhance product distribution.
Leading Players in the Microinsurance Market Market
- The Hollard Insurance Company
- afpgen com ph
- American International Group Inc
- Bharti AXA Life Insurance Company Limited
- SBI Life Insurance Company Limited
- ICICI Prudential Life Insurance Co Ltd
- Banco do Nordeste Brasil SA
- Climbs
- Allianz SE
- Bajaj Allianz Life Insurance Co Ltd
- List Not Exhaustive
Key Developments in Microinsurance Market Industry
- October 2023: Bharti Group's acquisition of AXA's stake in Bharti AXA Life Insurance signifies consolidation within the market and potentially leads to greater market share and operational efficiencies.
- April 2023: AIG's establishment of Private Client Select Insurance Services indicates a focus on high-net-worth individuals, potentially signaling a shift towards a more diverse customer base within the microinsurance market, potentially affecting the pricing and product strategies of existing players.
Strategic Outlook for Microinsurance Market Market
The microinsurance market exhibits substantial growth potential driven by ongoing technological advancements, expanding financial inclusion initiatives, and the rising demand for affordable insurance among underserved populations. The market is poised for further expansion, particularly in emerging economies, offering significant opportunities for both established players and new entrants with innovative business models and technological capabilities. Companies strategically leveraging technology and adapting to evolving customer preferences are well-positioned to capitalize on future growth opportunities.
Microinsurance Market Segmentation
-
1. Model Type
- 1.1. Partner Agent Model
- 1.2. Full-service Model
-
2. Product Type
- 2.1. Life Insurance
- 2.2. Health Insurance
- 2.3. Property Insurance
- 2.4. Other Product Types
-
3. Distribution Channel
- 3.1. Direct Sales
- 3.2. Financial Institutions
- 3.3. Digital Channels
- 3.4. Other Distribution Channels
-
4. Provider
- 4.1. Commercially Viable
- 4.2. Through Aid/Government Support
Microinsurance Market Segmentation By Geography
- 1. North America
- 2. Europe
- 3. Asia Pacific
- 4. Middle East and Africa
- 5. South America
Microinsurance Market Regional Market Share
Geographic Coverage of Microinsurance Market
Microinsurance Market REPORT HIGHLIGHTS
| Aspects | Details |
|---|---|
| Study Period | 2020-2034 |
| Base Year | 2025 |
| Estimated Year | 2026 |
| Forecast Period | 2026-2034 |
| Historical Period | 2020-2025 |
| Growth Rate | CAGR of 4.57% from 2020-2034 |
| Segmentation |
|
Table of Contents
- 1. Introduction
- 1.1. Research Scope
- 1.2. Market Segmentation
- 1.3. Research Objective
- 1.4. Definitions and Assumptions
- 2. Executive Summary
- 2.1. Market Snapshot
- 3. Market Dynamics
- 3.1. Market Drivers
- 3.2. Market Restrains
- 3.3. Market Trends
- 3.4. Market Opportunities
- 4. Market Factor Analysis
- 4.1. Porters Five Forces
- 4.1.1. Bargaining Power of Suppliers
- 4.1.2. Bargaining Power of Buyers
- 4.1.3. Threat of New Entrants
- 4.1.4. Threat of Substitutes
- 4.1.5. Competitive Rivalry
- 4.2. PESTEL analysis
- 4.3. BCG Analysis
- 4.3.1. Stars (High Growth, High Market Share)
- 4.3.2. Cash Cows (Low Growth, High Market Share)
- 4.3.3. Question Mark (High Growth, Low Market Share)
- 4.3.4. Dogs (Low Growth, Low Market Share)
- 4.4. Ansoff Matrix Analysis
- 4.5. Supply Chain Analysis
- 4.6. Regulatory Landscape
- 4.7. Current Market Potential and Opportunity Assessment (TAM–SAM–SOM Framework)
- 4.8. RAX Analyst Note
- 4.1. Porters Five Forces
- 5. Market Analysis, Insights and Forecast 2021-2033
- 5.1. Market Analysis, Insights and Forecast - by Model Type
- 5.1.1. Partner Agent Model
- 5.1.2. Full-service Model
- 5.2. Market Analysis, Insights and Forecast - by Product Type
- 5.2.1. Life Insurance
- 5.2.2. Health Insurance
- 5.2.3. Property Insurance
- 5.2.4. Other Product Types
- 5.3. Market Analysis, Insights and Forecast - by Distribution Channel
- 5.3.1. Direct Sales
- 5.3.2. Financial Institutions
- 5.3.3. Digital Channels
- 5.3.4. Other Distribution Channels
- 5.4. Market Analysis, Insights and Forecast - by Provider
- 5.4.1. Commercially Viable
- 5.4.2. Through Aid/Government Support
- 5.5. Market Analysis, Insights and Forecast - by Region
- 5.5.1. North America
- 5.5.2. Europe
- 5.5.3. Asia Pacific
- 5.5.4. Middle East and Africa
- 5.5.5. South America
- 5.1. Market Analysis, Insights and Forecast - by Model Type
- 6. Global Microinsurance Market Analysis, Insights and Forecast, 2021-2033
- 6.1. Market Analysis, Insights and Forecast - by Model Type
- 6.1.1. Partner Agent Model
- 6.1.2. Full-service Model
- 6.2. Market Analysis, Insights and Forecast - by Product Type
- 6.2.1. Life Insurance
- 6.2.2. Health Insurance
- 6.2.3. Property Insurance
- 6.2.4. Other Product Types
- 6.3. Market Analysis, Insights and Forecast - by Distribution Channel
- 6.3.1. Direct Sales
- 6.3.2. Financial Institutions
- 6.3.3. Digital Channels
- 6.3.4. Other Distribution Channels
- 6.4. Market Analysis, Insights and Forecast - by Provider
- 6.4.1. Commercially Viable
- 6.4.2. Through Aid/Government Support
- 6.1. Market Analysis, Insights and Forecast - by Model Type
- 7. North America Microinsurance Market Analysis, Insights and Forecast, 2020-2032
- 7.1. Market Analysis, Insights and Forecast - by Model Type
- 7.1.1. Partner Agent Model
- 7.1.2. Full-service Model
- 7.2. Market Analysis, Insights and Forecast - by Product Type
- 7.2.1. Life Insurance
- 7.2.2. Health Insurance
- 7.2.3. Property Insurance
- 7.2.4. Other Product Types
- 7.3. Market Analysis, Insights and Forecast - by Distribution Channel
- 7.3.1. Direct Sales
- 7.3.2. Financial Institutions
- 7.3.3. Digital Channels
- 7.3.4. Other Distribution Channels
- 7.4. Market Analysis, Insights and Forecast - by Provider
- 7.4.1. Commercially Viable
- 7.4.2. Through Aid/Government Support
- 7.1. Market Analysis, Insights and Forecast - by Model Type
- 8. Europe Microinsurance Market Analysis, Insights and Forecast, 2020-2032
- 8.1. Market Analysis, Insights and Forecast - by Model Type
- 8.1.1. Partner Agent Model
- 8.1.2. Full-service Model
- 8.2. Market Analysis, Insights and Forecast - by Product Type
- 8.2.1. Life Insurance
- 8.2.2. Health Insurance
- 8.2.3. Property Insurance
- 8.2.4. Other Product Types
- 8.3. Market Analysis, Insights and Forecast - by Distribution Channel
- 8.3.1. Direct Sales
- 8.3.2. Financial Institutions
- 8.3.3. Digital Channels
- 8.3.4. Other Distribution Channels
- 8.4. Market Analysis, Insights and Forecast - by Provider
- 8.4.1. Commercially Viable
- 8.4.2. Through Aid/Government Support
- 8.1. Market Analysis, Insights and Forecast - by Model Type
- 9. Asia Pacific Microinsurance Market Analysis, Insights and Forecast, 2020-2032
- 9.1. Market Analysis, Insights and Forecast - by Model Type
- 9.1.1. Partner Agent Model
- 9.1.2. Full-service Model
- 9.2. Market Analysis, Insights and Forecast - by Product Type
- 9.2.1. Life Insurance
- 9.2.2. Health Insurance
- 9.2.3. Property Insurance
- 9.2.4. Other Product Types
- 9.3. Market Analysis, Insights and Forecast - by Distribution Channel
- 9.3.1. Direct Sales
- 9.3.2. Financial Institutions
- 9.3.3. Digital Channels
- 9.3.4. Other Distribution Channels
- 9.4. Market Analysis, Insights and Forecast - by Provider
- 9.4.1. Commercially Viable
- 9.4.2. Through Aid/Government Support
- 9.1. Market Analysis, Insights and Forecast - by Model Type
- 10. Middle East and Africa Microinsurance Market Analysis, Insights and Forecast, 2020-2032
- 10.1. Market Analysis, Insights and Forecast - by Model Type
- 10.1.1. Partner Agent Model
- 10.1.2. Full-service Model
- 10.2. Market Analysis, Insights and Forecast - by Product Type
- 10.2.1. Life Insurance
- 10.2.2. Health Insurance
- 10.2.3. Property Insurance
- 10.2.4. Other Product Types
- 10.3. Market Analysis, Insights and Forecast - by Distribution Channel
- 10.3.1. Direct Sales
- 10.3.2. Financial Institutions
- 10.3.3. Digital Channels
- 10.3.4. Other Distribution Channels
- 10.4. Market Analysis, Insights and Forecast - by Provider
- 10.4.1. Commercially Viable
- 10.4.2. Through Aid/Government Support
- 10.1. Market Analysis, Insights and Forecast - by Model Type
- 11. South America Microinsurance Market Analysis, Insights and Forecast, 2020-2032
- 11.1. Market Analysis, Insights and Forecast - by Model Type
- 11.1.1. Partner Agent Model
- 11.1.2. Full-service Model
- 11.2. Market Analysis, Insights and Forecast - by Product Type
- 11.2.1. Life Insurance
- 11.2.2. Health Insurance
- 11.2.3. Property Insurance
- 11.2.4. Other Product Types
- 11.3. Market Analysis, Insights and Forecast - by Distribution Channel
- 11.3.1. Direct Sales
- 11.3.2. Financial Institutions
- 11.3.3. Digital Channels
- 11.3.4. Other Distribution Channels
- 11.4. Market Analysis, Insights and Forecast - by Provider
- 11.4.1. Commercially Viable
- 11.4.2. Through Aid/Government Support
- 11.1. Market Analysis, Insights and Forecast - by Model Type
- 12. Competitive Analysis
- 12.1. Company Profiles
- 12.1.1 The Hollard Insurance Company
- 12.1.1.1. Company Overview
- 12.1.1.2. Products
- 12.1.1.3. Company Financials
- 12.1.1.4. SWOT Analysis
- 12.1.2 afpgen com ph
- 12.1.2.1. Company Overview
- 12.1.2.2. Products
- 12.1.2.3. Company Financials
- 12.1.2.4. SWOT Analysis
- 12.1.3 American International Group Inc
- 12.1.3.1. Company Overview
- 12.1.3.2. Products
- 12.1.3.3. Company Financials
- 12.1.3.4. SWOT Analysis
- 12.1.4 Bharti AXA Life Insurance Company Limited
- 12.1.4.1. Company Overview
- 12.1.4.2. Products
- 12.1.4.3. Company Financials
- 12.1.4.4. SWOT Analysis
- 12.1.5 SBI Life Insurance Company Limited
- 12.1.5.1. Company Overview
- 12.1.5.2. Products
- 12.1.5.3. Company Financials
- 12.1.5.4. SWOT Analysis
- 12.1.6 ICICI Prudential Life Insurance Co Ltd
- 12.1.6.1. Company Overview
- 12.1.6.2. Products
- 12.1.6.3. Company Financials
- 12.1.6.4. SWOT Analysis
- 12.1.7 Banco do Nordeste Brasil SA
- 12.1.7.1. Company Overview
- 12.1.7.2. Products
- 12.1.7.3. Company Financials
- 12.1.7.4. SWOT Analysis
- 12.1.8 Climbs
- 12.1.8.1. Company Overview
- 12.1.8.2. Products
- 12.1.8.3. Company Financials
- 12.1.8.4. SWOT Analysis
- 12.1.9 Allianz SE
- 12.1.9.1. Company Overview
- 12.1.9.2. Products
- 12.1.9.3. Company Financials
- 12.1.9.4. SWOT Analysis
- 12.1.10 Bajaj Allianz Life Insurance Co Ltd**List Not Exhaustive
- 12.1.10.1. Company Overview
- 12.1.10.2. Products
- 12.1.10.3. Company Financials
- 12.1.10.4. SWOT Analysis
- 12.1.1 The Hollard Insurance Company
- 12.2. Market Entropy
- 12.2.1 Company's Key Areas Served
- 12.2.2 Recent Developments
- 12.3. Company Market Share Analysis 2025
- 12.3.1 Top 5 Companies Market Share Analysis
- 12.3.2 Top 3 Companies Market Share Analysis
- 12.4. List of Potential Customers
- 13. Research Methodology
List of Figures
- Figure 1: Global Microinsurance Market Revenue Breakdown (billion, %) by Region 2025 & 2033
- Figure 2: Global Microinsurance Market Volume Breakdown (Billion, %) by Region 2025 & 2033
- Figure 3: North America Microinsurance Market Revenue (billion), by Model Type 2025 & 2033
- Figure 4: North America Microinsurance Market Volume (Billion), by Model Type 2025 & 2033
- Figure 5: North America Microinsurance Market Revenue Share (%), by Model Type 2025 & 2033
- Figure 6: North America Microinsurance Market Volume Share (%), by Model Type 2025 & 2033
- Figure 7: North America Microinsurance Market Revenue (billion), by Product Type 2025 & 2033
- Figure 8: North America Microinsurance Market Volume (Billion), by Product Type 2025 & 2033
- Figure 9: North America Microinsurance Market Revenue Share (%), by Product Type 2025 & 2033
- Figure 10: North America Microinsurance Market Volume Share (%), by Product Type 2025 & 2033
- Figure 11: North America Microinsurance Market Revenue (billion), by Distribution Channel 2025 & 2033
- Figure 12: North America Microinsurance Market Volume (Billion), by Distribution Channel 2025 & 2033
- Figure 13: North America Microinsurance Market Revenue Share (%), by Distribution Channel 2025 & 2033
- Figure 14: North America Microinsurance Market Volume Share (%), by Distribution Channel 2025 & 2033
- Figure 15: North America Microinsurance Market Revenue (billion), by Provider 2025 & 2033
- Figure 16: North America Microinsurance Market Volume (Billion), by Provider 2025 & 2033
- Figure 17: North America Microinsurance Market Revenue Share (%), by Provider 2025 & 2033
- Figure 18: North America Microinsurance Market Volume Share (%), by Provider 2025 & 2033
- Figure 19: North America Microinsurance Market Revenue (billion), by Country 2025 & 2033
- Figure 20: North America Microinsurance Market Volume (Billion), by Country 2025 & 2033
- Figure 21: North America Microinsurance Market Revenue Share (%), by Country 2025 & 2033
- Figure 22: North America Microinsurance Market Volume Share (%), by Country 2025 & 2033
- Figure 23: Europe Microinsurance Market Revenue (billion), by Model Type 2025 & 2033
- Figure 24: Europe Microinsurance Market Volume (Billion), by Model Type 2025 & 2033
- Figure 25: Europe Microinsurance Market Revenue Share (%), by Model Type 2025 & 2033
- Figure 26: Europe Microinsurance Market Volume Share (%), by Model Type 2025 & 2033
- Figure 27: Europe Microinsurance Market Revenue (billion), by Product Type 2025 & 2033
- Figure 28: Europe Microinsurance Market Volume (Billion), by Product Type 2025 & 2033
- Figure 29: Europe Microinsurance Market Revenue Share (%), by Product Type 2025 & 2033
- Figure 30: Europe Microinsurance Market Volume Share (%), by Product Type 2025 & 2033
- Figure 31: Europe Microinsurance Market Revenue (billion), by Distribution Channel 2025 & 2033
- Figure 32: Europe Microinsurance Market Volume (Billion), by Distribution Channel 2025 & 2033
- Figure 33: Europe Microinsurance Market Revenue Share (%), by Distribution Channel 2025 & 2033
- Figure 34: Europe Microinsurance Market Volume Share (%), by Distribution Channel 2025 & 2033
- Figure 35: Europe Microinsurance Market Revenue (billion), by Provider 2025 & 2033
- Figure 36: Europe Microinsurance Market Volume (Billion), by Provider 2025 & 2033
- Figure 37: Europe Microinsurance Market Revenue Share (%), by Provider 2025 & 2033
- Figure 38: Europe Microinsurance Market Volume Share (%), by Provider 2025 & 2033
- Figure 39: Europe Microinsurance Market Revenue (billion), by Country 2025 & 2033
- Figure 40: Europe Microinsurance Market Volume (Billion), by Country 2025 & 2033
- Figure 41: Europe Microinsurance Market Revenue Share (%), by Country 2025 & 2033
- Figure 42: Europe Microinsurance Market Volume Share (%), by Country 2025 & 2033
- Figure 43: Asia Pacific Microinsurance Market Revenue (billion), by Model Type 2025 & 2033
- Figure 44: Asia Pacific Microinsurance Market Volume (Billion), by Model Type 2025 & 2033
- Figure 45: Asia Pacific Microinsurance Market Revenue Share (%), by Model Type 2025 & 2033
- Figure 46: Asia Pacific Microinsurance Market Volume Share (%), by Model Type 2025 & 2033
- Figure 47: Asia Pacific Microinsurance Market Revenue (billion), by Product Type 2025 & 2033
- Figure 48: Asia Pacific Microinsurance Market Volume (Billion), by Product Type 2025 & 2033
- Figure 49: Asia Pacific Microinsurance Market Revenue Share (%), by Product Type 2025 & 2033
- Figure 50: Asia Pacific Microinsurance Market Volume Share (%), by Product Type 2025 & 2033
- Figure 51: Asia Pacific Microinsurance Market Revenue (billion), by Distribution Channel 2025 & 2033
- Figure 52: Asia Pacific Microinsurance Market Volume (Billion), by Distribution Channel 2025 & 2033
- Figure 53: Asia Pacific Microinsurance Market Revenue Share (%), by Distribution Channel 2025 & 2033
- Figure 54: Asia Pacific Microinsurance Market Volume Share (%), by Distribution Channel 2025 & 2033
- Figure 55: Asia Pacific Microinsurance Market Revenue (billion), by Provider 2025 & 2033
- Figure 56: Asia Pacific Microinsurance Market Volume (Billion), by Provider 2025 & 2033
- Figure 57: Asia Pacific Microinsurance Market Revenue Share (%), by Provider 2025 & 2033
- Figure 58: Asia Pacific Microinsurance Market Volume Share (%), by Provider 2025 & 2033
- Figure 59: Asia Pacific Microinsurance Market Revenue (billion), by Country 2025 & 2033
- Figure 60: Asia Pacific Microinsurance Market Volume (Billion), by Country 2025 & 2033
- Figure 61: Asia Pacific Microinsurance Market Revenue Share (%), by Country 2025 & 2033
- Figure 62: Asia Pacific Microinsurance Market Volume Share (%), by Country 2025 & 2033
- Figure 63: Middle East and Africa Microinsurance Market Revenue (billion), by Model Type 2025 & 2033
- Figure 64: Middle East and Africa Microinsurance Market Volume (Billion), by Model Type 2025 & 2033
- Figure 65: Middle East and Africa Microinsurance Market Revenue Share (%), by Model Type 2025 & 2033
- Figure 66: Middle East and Africa Microinsurance Market Volume Share (%), by Model Type 2025 & 2033
- Figure 67: Middle East and Africa Microinsurance Market Revenue (billion), by Product Type 2025 & 2033
- Figure 68: Middle East and Africa Microinsurance Market Volume (Billion), by Product Type 2025 & 2033
- Figure 69: Middle East and Africa Microinsurance Market Revenue Share (%), by Product Type 2025 & 2033
- Figure 70: Middle East and Africa Microinsurance Market Volume Share (%), by Product Type 2025 & 2033
- Figure 71: Middle East and Africa Microinsurance Market Revenue (billion), by Distribution Channel 2025 & 2033
- Figure 72: Middle East and Africa Microinsurance Market Volume (Billion), by Distribution Channel 2025 & 2033
- Figure 73: Middle East and Africa Microinsurance Market Revenue Share (%), by Distribution Channel 2025 & 2033
- Figure 74: Middle East and Africa Microinsurance Market Volume Share (%), by Distribution Channel 2025 & 2033
- Figure 75: Middle East and Africa Microinsurance Market Revenue (billion), by Provider 2025 & 2033
- Figure 76: Middle East and Africa Microinsurance Market Volume (Billion), by Provider 2025 & 2033
- Figure 77: Middle East and Africa Microinsurance Market Revenue Share (%), by Provider 2025 & 2033
- Figure 78: Middle East and Africa Microinsurance Market Volume Share (%), by Provider 2025 & 2033
- Figure 79: Middle East and Africa Microinsurance Market Revenue (billion), by Country 2025 & 2033
- Figure 80: Middle East and Africa Microinsurance Market Volume (Billion), by Country 2025 & 2033
- Figure 81: Middle East and Africa Microinsurance Market Revenue Share (%), by Country 2025 & 2033
- Figure 82: Middle East and Africa Microinsurance Market Volume Share (%), by Country 2025 & 2033
- Figure 83: South America Microinsurance Market Revenue (billion), by Model Type 2025 & 2033
- Figure 84: South America Microinsurance Market Volume (Billion), by Model Type 2025 & 2033
- Figure 85: South America Microinsurance Market Revenue Share (%), by Model Type 2025 & 2033
- Figure 86: South America Microinsurance Market Volume Share (%), by Model Type 2025 & 2033
- Figure 87: South America Microinsurance Market Revenue (billion), by Product Type 2025 & 2033
- Figure 88: South America Microinsurance Market Volume (Billion), by Product Type 2025 & 2033
- Figure 89: South America Microinsurance Market Revenue Share (%), by Product Type 2025 & 2033
- Figure 90: South America Microinsurance Market Volume Share (%), by Product Type 2025 & 2033
- Figure 91: South America Microinsurance Market Revenue (billion), by Distribution Channel 2025 & 2033
- Figure 92: South America Microinsurance Market Volume (Billion), by Distribution Channel 2025 & 2033
- Figure 93: South America Microinsurance Market Revenue Share (%), by Distribution Channel 2025 & 2033
- Figure 94: South America Microinsurance Market Volume Share (%), by Distribution Channel 2025 & 2033
- Figure 95: South America Microinsurance Market Revenue (billion), by Provider 2025 & 2033
- Figure 96: South America Microinsurance Market Volume (Billion), by Provider 2025 & 2033
- Figure 97: South America Microinsurance Market Revenue Share (%), by Provider 2025 & 2033
- Figure 98: South America Microinsurance Market Volume Share (%), by Provider 2025 & 2033
- Figure 99: South America Microinsurance Market Revenue (billion), by Country 2025 & 2033
- Figure 100: South America Microinsurance Market Volume (Billion), by Country 2025 & 2033
- Figure 101: South America Microinsurance Market Revenue Share (%), by Country 2025 & 2033
- Figure 102: South America Microinsurance Market Volume Share (%), by Country 2025 & 2033
List of Tables
- Table 1: Global Microinsurance Market Revenue billion Forecast, by Model Type 2020 & 2033
- Table 2: Global Microinsurance Market Volume Billion Forecast, by Model Type 2020 & 2033
- Table 3: Global Microinsurance Market Revenue billion Forecast, by Product Type 2020 & 2033
- Table 4: Global Microinsurance Market Volume Billion Forecast, by Product Type 2020 & 2033
- Table 5: Global Microinsurance Market Revenue billion Forecast, by Distribution Channel 2020 & 2033
- Table 6: Global Microinsurance Market Volume Billion Forecast, by Distribution Channel 2020 & 2033
- Table 7: Global Microinsurance Market Revenue billion Forecast, by Provider 2020 & 2033
- Table 8: Global Microinsurance Market Volume Billion Forecast, by Provider 2020 & 2033
- Table 9: Global Microinsurance Market Revenue billion Forecast, by Region 2020 & 2033
- Table 10: Global Microinsurance Market Volume Billion Forecast, by Region 2020 & 2033
- Table 11: Global Microinsurance Market Revenue billion Forecast, by Model Type 2020 & 2033
- Table 12: Global Microinsurance Market Volume Billion Forecast, by Model Type 2020 & 2033
- Table 13: Global Microinsurance Market Revenue billion Forecast, by Product Type 2020 & 2033
- Table 14: Global Microinsurance Market Volume Billion Forecast, by Product Type 2020 & 2033
- Table 15: Global Microinsurance Market Revenue billion Forecast, by Distribution Channel 2020 & 2033
- Table 16: Global Microinsurance Market Volume Billion Forecast, by Distribution Channel 2020 & 2033
- Table 17: Global Microinsurance Market Revenue billion Forecast, by Provider 2020 & 2033
- Table 18: Global Microinsurance Market Volume Billion Forecast, by Provider 2020 & 2033
- Table 19: Global Microinsurance Market Revenue billion Forecast, by Country 2020 & 2033
- Table 20: Global Microinsurance Market Volume Billion Forecast, by Country 2020 & 2033
- Table 21: Global Microinsurance Market Revenue billion Forecast, by Model Type 2020 & 2033
- Table 22: Global Microinsurance Market Volume Billion Forecast, by Model Type 2020 & 2033
- Table 23: Global Microinsurance Market Revenue billion Forecast, by Product Type 2020 & 2033
- Table 24: Global Microinsurance Market Volume Billion Forecast, by Product Type 2020 & 2033
- Table 25: Global Microinsurance Market Revenue billion Forecast, by Distribution Channel 2020 & 2033
- Table 26: Global Microinsurance Market Volume Billion Forecast, by Distribution Channel 2020 & 2033
- Table 27: Global Microinsurance Market Revenue billion Forecast, by Provider 2020 & 2033
- Table 28: Global Microinsurance Market Volume Billion Forecast, by Provider 2020 & 2033
- Table 29: Global Microinsurance Market Revenue billion Forecast, by Country 2020 & 2033
- Table 30: Global Microinsurance Market Volume Billion Forecast, by Country 2020 & 2033
- Table 31: Global Microinsurance Market Revenue billion Forecast, by Model Type 2020 & 2033
- Table 32: Global Microinsurance Market Volume Billion Forecast, by Model Type 2020 & 2033
- Table 33: Global Microinsurance Market Revenue billion Forecast, by Product Type 2020 & 2033
- Table 34: Global Microinsurance Market Volume Billion Forecast, by Product Type 2020 & 2033
- Table 35: Global Microinsurance Market Revenue billion Forecast, by Distribution Channel 2020 & 2033
- Table 36: Global Microinsurance Market Volume Billion Forecast, by Distribution Channel 2020 & 2033
- Table 37: Global Microinsurance Market Revenue billion Forecast, by Provider 2020 & 2033
- Table 38: Global Microinsurance Market Volume Billion Forecast, by Provider 2020 & 2033
- Table 39: Global Microinsurance Market Revenue billion Forecast, by Country 2020 & 2033
- Table 40: Global Microinsurance Market Volume Billion Forecast, by Country 2020 & 2033
- Table 41: Global Microinsurance Market Revenue billion Forecast, by Model Type 2020 & 2033
- Table 42: Global Microinsurance Market Volume Billion Forecast, by Model Type 2020 & 2033
- Table 43: Global Microinsurance Market Revenue billion Forecast, by Product Type 2020 & 2033
- Table 44: Global Microinsurance Market Volume Billion Forecast, by Product Type 2020 & 2033
- Table 45: Global Microinsurance Market Revenue billion Forecast, by Distribution Channel 2020 & 2033
- Table 46: Global Microinsurance Market Volume Billion Forecast, by Distribution Channel 2020 & 2033
- Table 47: Global Microinsurance Market Revenue billion Forecast, by Provider 2020 & 2033
- Table 48: Global Microinsurance Market Volume Billion Forecast, by Provider 2020 & 2033
- Table 49: Global Microinsurance Market Revenue billion Forecast, by Country 2020 & 2033
- Table 50: Global Microinsurance Market Volume Billion Forecast, by Country 2020 & 2033
- Table 51: Global Microinsurance Market Revenue billion Forecast, by Model Type 2020 & 2033
- Table 52: Global Microinsurance Market Volume Billion Forecast, by Model Type 2020 & 2033
- Table 53: Global Microinsurance Market Revenue billion Forecast, by Product Type 2020 & 2033
- Table 54: Global Microinsurance Market Volume Billion Forecast, by Product Type 2020 & 2033
- Table 55: Global Microinsurance Market Revenue billion Forecast, by Distribution Channel 2020 & 2033
- Table 56: Global Microinsurance Market Volume Billion Forecast, by Distribution Channel 2020 & 2033
- Table 57: Global Microinsurance Market Revenue billion Forecast, by Provider 2020 & 2033
- Table 58: Global Microinsurance Market Volume Billion Forecast, by Provider 2020 & 2033
- Table 59: Global Microinsurance Market Revenue billion Forecast, by Country 2020 & 2033
- Table 60: Global Microinsurance Market Volume Billion Forecast, by Country 2020 & 2033
Frequently Asked Questions
1. What is the projected Compound Annual Growth Rate (CAGR) of the Microinsurance Market?
The projected CAGR is approximately 4.57%.
2. Which companies are prominent players in the Microinsurance Market?
Key companies in the market include The Hollard Insurance Company, afpgen com ph, American International Group Inc, Bharti AXA Life Insurance Company Limited, SBI Life Insurance Company Limited, ICICI Prudential Life Insurance Co Ltd, Banco do Nordeste Brasil SA, Climbs, Allianz SE, Bajaj Allianz Life Insurance Co Ltd**List Not Exhaustive.
3. What are the main segments of the Microinsurance Market?
The market segments include Model Type, Product Type, Distribution Channel, Provider.
4. Can you provide details about the market size?
The market size is estimated to be USD 98.8 billion as of 2022.
5. What are some drivers contributing to market growth?
Access to Financial Services; Rise of Digital Platforms and Mobile Technology.
6. What are the notable trends driving market growth?
Low- and Middle-income Earners prefer Healthcare Insurance.
7. Are there any restraints impacting market growth?
Access to Financial Services; Rise of Digital Platforms and Mobile Technology.
8. Can you provide examples of recent developments in the market?
October 2023: Bharti Group entered an agreement with its partner AXA to purchase AXA's 49% ownership stake in Bharti AXA Life Insurance. The completion of the transaction was anticipated by December 2023.
9. What pricing options are available for accessing the report?
Pricing options include single-user, multi-user, and enterprise licenses priced at USD 4750, USD 5250, and USD 8750 respectively.
10. Is the market size provided in terms of value or volume?
The market size is provided in terms of value, measured in billion and volume, measured in Billion.
11. Are there any specific market keywords associated with the report?
Yes, the market keyword associated with the report is "Microinsurance Market," which aids in identifying and referencing the specific market segment covered.
12. How do I determine which pricing option suits my needs best?
The pricing options vary based on user requirements and access needs. Individual users may opt for single-user licenses, while businesses requiring broader access may choose multi-user or enterprise licenses for cost-effective access to the report.
13. Are there any additional resources or data provided in the Microinsurance Market report?
While the report offers comprehensive insights, it's advisable to review the specific contents or supplementary materials provided to ascertain if additional resources or data are available.
14. How can I stay updated on further developments or reports in the Microinsurance Market?
To stay informed about further developments, trends, and reports in the Microinsurance Market, consider subscribing to industry newsletters, following relevant companies and organizations, or regularly checking reputable industry news sources and publications.
Methodology
Step 1 - Identification of Relevant Samples Size from Population Database


Step 2 - Approaches for Defining Global Market Size (Value, Volume* & Price*)

Note*: In applicable scenarios
Step 3 - Data Sources
Primary Research
- Web Analytics
- Survey Reports
- Research Institute
- Latest Research Reports
- Opinion Leaders
Secondary Research
- Annual Reports
- White Paper
- Latest Press Release
- Industry Association
- Paid Database
- Investor Presentations

Step 4 - Data Triangulation
Involves using different sources of information in order to increase the validity of a study
These sources are likely to be stakeholders in a program - participants, other researchers, program staff, other community members, and so on.
Then we put all data in single framework & apply various statistical tools to find out the dynamic on the market.
During the analysis stage, feedback from the stakeholder groups would be compared to determine areas of agreement as well as areas of divergence