
Key Insights
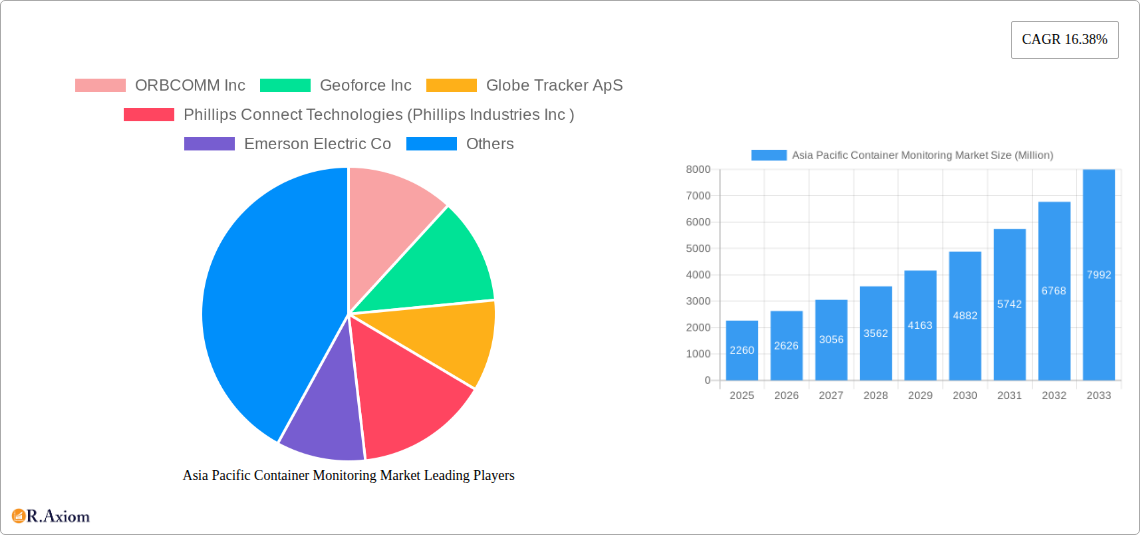
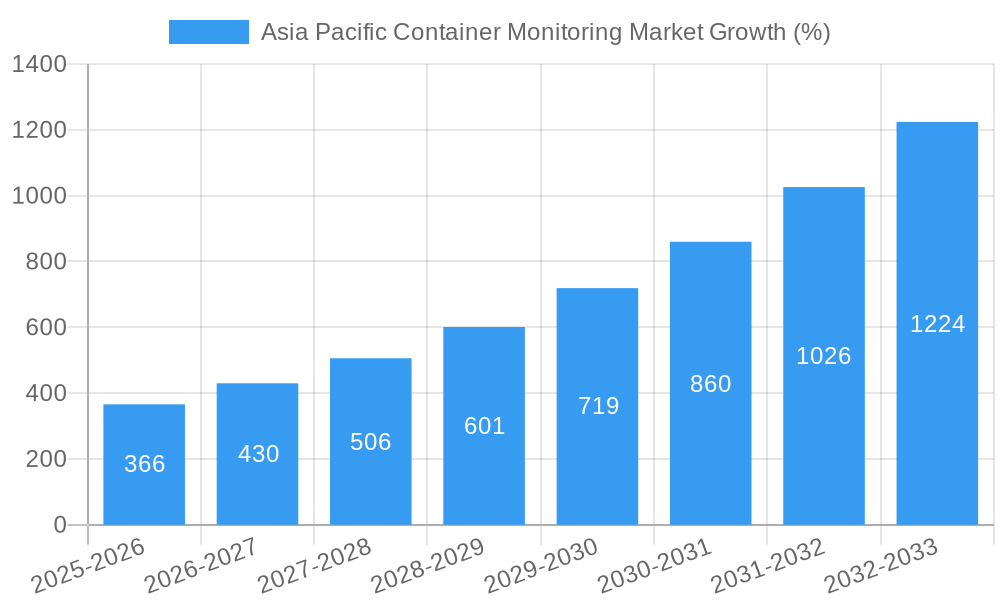
The Asia Pacific container monitoring market is experiencing robust growth, projected to reach \$2.26 billion in 2025 and maintain a Compound Annual Growth Rate (CAGR) of 16.38% from 2025 to 2033. This expansion is driven by several key factors. Firstly, the increasing volume of global trade, particularly within the Asia-Pacific region, necessitates enhanced visibility and security throughout the shipping lifecycle. Secondly, the growing adoption of advanced technologies such as IoT sensors, GPS tracking, and data analytics provides real-time monitoring capabilities, improving supply chain efficiency and reducing losses from theft or damage. Furthermore, stringent regulatory requirements regarding cargo security and transparency are pushing businesses towards adopting container monitoring solutions. Finally, the rising demand for improved logistics management and the need to optimize shipping costs are also contributing to market growth. The market's segmentation likely encompasses various technologies (e.g., GPS trackers, RFID, temperature sensors), deployment types (e.g., onboard, cloud-based), and end-user industries (e.g., manufacturing, retail).
Competition in the Asia Pacific container monitoring market is fierce, with established players like ORBCOMM Inc, Geoforce Inc, and others vying for market share. The presence of both large multinational corporations and specialized technology providers indicates a dynamic competitive landscape. To maintain a competitive edge, companies are focused on developing innovative solutions that integrate seamlessly with existing logistics platforms, offer enhanced data analytics capabilities, and provide cost-effective monitoring options. Future growth will likely be fueled by further technological advancements, improved data security measures, and the increasing adoption of container monitoring solutions by smaller and medium-sized enterprises across the region. Expansion into emerging markets within Asia Pacific will also be a key driver of future market growth.
Asia Pacific Container Monitoring Market: A Comprehensive Report (2019-2033)
This comprehensive report provides an in-depth analysis of the Asia Pacific Container Monitoring Market, offering invaluable insights for industry stakeholders, investors, and strategic decision-makers. The report covers the period 2019-2033, with a focus on the base year 2025 and a forecast period of 2025-2033. The study incorporates extensive market data and analysis to provide a clear understanding of current market dynamics and future growth potential. The report identifies key growth drivers, challenges, and emerging opportunities, helping businesses navigate the evolving landscape of container monitoring in the Asia-Pacific region. The market is valued at XX Million in 2025 and is projected to reach XX Million by 2033, exhibiting a CAGR of xx% during the forecast period.
Asia Pacific Container Monitoring Market Concentration & Innovation
The Asia Pacific container monitoring market is characterized by a moderately concentrated landscape, with a few dominant players and several smaller, specialized firms. Key players such as ORBCOMM Inc, Geoforce Inc, Globe Tracker ApS, Phillips Connect Technologies (Phillips Industries Inc), Emerson Electric Co, Hapag-Lloyd AG, TRAXENS, Roambee Corporation, OnAsset Intelligence Inc, and Zabbix LLC hold significant market share, although the exact figures vary depending on the specific segment and region. Market concentration is further influenced by ongoing mergers and acquisitions (M&A) activity. Recent M&A deals, although not publicly disclosed with specific values for all, indicate a trend towards consolidation within the sector. For example, the value of M&A deals in the past 5 years is estimated to be around XX Million. Innovation is driven by advancements in IoT technology, the development of more sophisticated tracking devices, and the increasing demand for real-time data analytics and predictive maintenance capabilities. Stringent regulatory frameworks regarding data privacy and security are also shaping innovation in the sector. Product substitutes, such as traditional manual tracking methods, are gradually being replaced by technologically advanced solutions offering enhanced efficiency and accuracy. End-user trends show an increasing preference for integrated, cloud-based solutions offering comprehensive visibility across the entire supply chain.
- Market Share: Dominant players hold approximately xx% of the market share collectively.
- M&A Deal Values (Last 5 Years): Estimated at XX Million.
- Key Innovation Drivers: IoT technology advancements, real-time data analytics, predictive maintenance.
- Regulatory Impact: Data privacy regulations influence product development and market entry.
Asia Pacific Container Monitoring Market Industry Trends & Insights
The Asia Pacific container monitoring market is experiencing robust growth, driven by several key factors. The increasing volume of global trade, particularly within the Asia-Pacific region, fuels the demand for efficient and reliable container tracking solutions. Technological advancements in IoT, GPS, and data analytics provide enhanced visibility and control over container shipments, leading to improved operational efficiency and reduced risks of theft or damage. Furthermore, the growing adoption of container monitoring solutions by logistics providers, freight forwarders, and shipping companies reflects the increasing emphasis on supply chain optimization and enhanced security. Consumer preferences are shifting towards more transparent and traceable supply chains, putting pressure on businesses to adopt advanced container monitoring technologies. The market’s competitive dynamics are influenced by factors such as pricing strategies, technological capabilities, and the ability to provide comprehensive and integrated solutions. The market penetration of container monitoring solutions varies across countries and segments, with higher penetration rates observed in more developed economies and within specific industries such as high-value goods transportation. The market is expected to grow at a CAGR of xx% during the forecast period, driven by these dynamic trends and technological advancements.
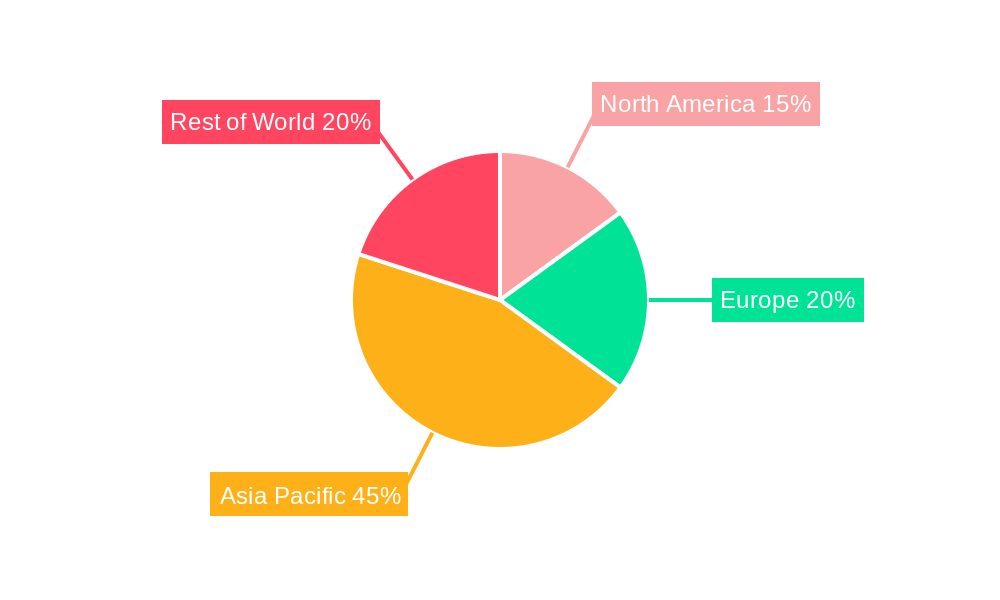
Dominant Markets & Segments in Asia Pacific Container Monitoring Market
China dominates the Asia Pacific container monitoring market, followed by Japan, South Korea, and India. This dominance stems from several factors:
- China: High volume of containerized goods, robust infrastructure, increasing adoption of advanced technology.
- Japan: Sophisticated logistics infrastructure and focus on supply chain efficiency.
- South Korea: Significant export-oriented economy, emphasis on technological integration.
- India: Rapidly growing economy, increasing demand for better supply chain visibility.
Other countries in the region are also exhibiting significant growth potential, driven by infrastructure improvements and economic development. The market is segmented by technology (GPS, RFID, etc.), application (temperature monitoring, location tracking, etc.), and end-user (logistics providers, shipping companies, etc.). The segment demonstrating the fastest growth is the real-time tracking and temperature monitoring solutions due to their increasing demand in perishable goods transportation. This segment shows a particularly high growth rate driven by factors such as the increasing demand for efficient and reliable container tracking solutions, as well as technological advancements in IoT, GPS, and data analytics.
Asia Pacific Container Monitoring Market Product Developments
Recent product developments focus on enhancing real-time visibility, data analytics capabilities, and integration with existing supply chain management systems. New products incorporate advanced sensors, such as temperature and humidity sensors, which provide valuable data for optimizing cold chain logistics. The incorporation of AI and machine learning algorithms enables predictive maintenance and anomaly detection, helping companies proactively address potential issues. The emphasis on user-friendly interfaces and cloud-based platforms enhances accessibility and data sharing capabilities. These improvements enhance the competitive advantage of solution providers by offering greater efficiency and cost savings to their clients.
Report Scope & Segmentation Analysis
This report segments the Asia Pacific container monitoring market based on technology (GPS, RFID, GSM, Satellite, etc.), application (temperature monitoring, location tracking, shock detection, etc.), end-user (shipping lines, freight forwarders, 3PL providers, importers, exporters), and region (China, Japan, South Korea, India, Australia, and Rest of Asia Pacific). Each segment's market size, growth projection, and competitive dynamics are thoroughly analyzed, providing a granular understanding of the market structure and growth drivers. The report projects significant growth in all segments, driven by the increasing adoption of technologically advanced solutions and the growing need for efficient supply chain management.
Key Drivers of Asia Pacific Container Monitoring Market Growth
The growth of the Asia Pacific container monitoring market is driven by several key factors: the increasing volume of global trade, advancements in IoT and related technologies, the growing need for enhanced supply chain visibility and security, stringent regulatory requirements for cargo tracking and monitoring, and the rising adoption of advanced analytics for optimized logistics and inventory management. Specific examples include the implementation of government initiatives promoting digitalization in logistics and the increasing preference for real-time data-driven decision making among businesses in the region.
Challenges in the Asia Pacific Container Monitoring Market Sector
Several factors pose challenges to the growth of the Asia Pacific container monitoring market. High initial investment costs associated with implementing monitoring systems can be a barrier for small and medium-sized enterprises. Integration complexities with existing IT infrastructure and the need for skilled personnel to manage and interpret data can also hinder market adoption. Furthermore, concerns regarding data security and privacy, as well as the lack of standardized protocols across different systems, pose significant challenges. These factors potentially reduce the market growth by an estimated xx% annually.
Emerging Opportunities in Asia Pacific Container Monitoring Market
Emerging opportunities exist in the expansion into underserved markets within the Asia Pacific region, particularly in smaller economies with developing logistics infrastructure. The integration of AI and machine learning offers exciting potential for predictive maintenance, fraud detection, and route optimization. The increasing adoption of blockchain technology to enhance security and transparency presents another opportunity for innovation. Finally, the growth of e-commerce is driving the demand for reliable real-time tracking solutions, offering substantial opportunities for market expansion.
Leading Players in the Asia Pacific Container Monitoring Market Market
- ORBCOMM Inc
- Geoforce Inc
- Globe Tracker ApS
- Phillips Connect Technologies (Phillips Industries Inc)
- Emerson Electric Co
- Hapag-Lloyd AG
- TRAXENS
- Roambee Corporation
- OnAsset Intelligence Inc
- Zabbix LLC *List Not Exhaustive
Key Developments in Asia Pacific Container Monitoring Market Industry
- September 2024: ZIM Integrated Shipping Services Ltd. announced a long-term operational cooperation with Mediterranean Shipping Company (MSC) on Asia-US East Coast and Asia-US Gulf trades, launching new services in February 2025. This significantly impacts the demand for container monitoring solutions on these crucial trade routes.
- September 2024: Kalmar's agreement with ContainerCo in New Zealand for six empty container handlers highlights the growing investment in container handling efficiency, indirectly impacting the demand for container monitoring solutions within depot operations.
Strategic Outlook for Asia Pacific Container Monitoring Market Market
The Asia Pacific container monitoring market is poised for significant growth, driven by technological advancements, increasing trade volumes, and the rising need for efficient and secure supply chain management. Opportunities lie in integrating advanced technologies such as AI, machine learning, and blockchain to enhance visibility, security, and optimization. The focus on real-time data analytics and predictive maintenance will further drive market growth, creating lucrative opportunities for innovative solution providers. The market's future hinges on adapting to evolving regulatory landscapes and addressing the challenges associated with data security and interoperability.
Asia Pacific Container Monitoring Market Segmentation
- 1. Overall
-
2. Key Components
- 2.1. Hardware
- 2.2. Software
- 2.3. Services
-
3. Key Applications
- 3.1. Asset Condition Monitoring
- 3.2. Logistics & Supply Chain Management
- 3.3. Location Tracking
- 3.4. Security
- 3.5. Others
-
4. Geography
- 4.1. China
- 4.2. Japan
- 4.3. South Korea
- 4.4. Middle East
- 4.5. Australia and New Zealand
Asia Pacific Container Monitoring Market Segmentation By Geography
- 1. China
- 2. Japan
- 3. South Korea
- 4. Middle East
- 5. Australia and New Zealand
Asia Pacific Container Monitoring Market REPORT HIGHLIGHTS
| Aspects | Details |
|---|---|
| Study Period | 2019-2033 |
| Base Year | 2024 |
| Estimated Year | 2025 |
| Forecast Period | 2025-2033 |
| Historical Period | 2019-2024 |
| Growth Rate | CAGR of 16.38% from 2019-2033 |
| Segmentation |
|
Table of Contents
- 1. Introduction
- 1.1. Research Scope
- 1.2. Market Segmentation
- 1.3. Research Methodology
- 1.4. Definitions and Assumptions
- 2. Executive Summary
- 2.1. Introduction
- 3. Market Dynamics
- 3.1. Introduction
- 3.2. Market Drivers
- 3.2.1. Surge in Advanced Containment Materials and Structural Innovations; Increase in Seaborne Trade; Increase in Demand to Enhanced Supply Chain Efficiency
- 3.3. Market Restrains
- 3.3.1. Surge in Advanced Containment Materials and Structural Innovations; Increase in Seaborne Trade; Increase in Demand to Enhanced Supply Chain Efficiency
- 3.4. Market Trends
- 3.4.1. Container Monitoring to be a Key Driver for Growth in Logistics and Supply Chain Management
- 4. Market Factor Analysis
- 4.1. Porters Five Forces
- 4.2. Supply/Value Chain
- 4.3. PESTEL analysis
- 4.4. Market Entropy
- 4.5. Patent/Trademark Analysis
- 5. Global Asia Pacific Container Monitoring Market Analysis, Insights and Forecast, 2019-2031
- 5.1. Market Analysis, Insights and Forecast - by Overall
- 5.2. Market Analysis, Insights and Forecast - by Key Components
- 5.2.1. Hardware
- 5.2.2. Software
- 5.2.3. Services
- 5.3. Market Analysis, Insights and Forecast - by Key Applications
- 5.3.1. Asset Condition Monitoring
- 5.3.2. Logistics & Supply Chain Management
- 5.3.3. Location Tracking
- 5.3.4. Security
- 5.3.5. Others
- 5.4. Market Analysis, Insights and Forecast - by Geography
- 5.4.1. China
- 5.4.2. Japan
- 5.4.3. South Korea
- 5.4.4. Middle East
- 5.4.5. Australia and New Zealand
- 5.5. Market Analysis, Insights and Forecast - by Region
- 5.5.1. China
- 5.5.2. Japan
- 5.5.3. South Korea
- 5.5.4. Middle East
- 5.5.5. Australia and New Zealand
- 5.1. Market Analysis, Insights and Forecast - by Overall
- 6. China Asia Pacific Container Monitoring Market Analysis, Insights and Forecast, 2019-2031
- 6.1. Market Analysis, Insights and Forecast - by Overall
- 6.2. Market Analysis, Insights and Forecast - by Key Components
- 6.2.1. Hardware
- 6.2.2. Software
- 6.2.3. Services
- 6.3. Market Analysis, Insights and Forecast - by Key Applications
- 6.3.1. Asset Condition Monitoring
- 6.3.2. Logistics & Supply Chain Management
- 6.3.3. Location Tracking
- 6.3.4. Security
- 6.3.5. Others
- 6.4. Market Analysis, Insights and Forecast - by Geography
- 6.4.1. China
- 6.4.2. Japan
- 6.4.3. South Korea
- 6.4.4. Middle East
- 6.4.5. Australia and New Zealand
- 6.1. Market Analysis, Insights and Forecast - by Overall
- 7. Japan Asia Pacific Container Monitoring Market Analysis, Insights and Forecast, 2019-2031
- 7.1. Market Analysis, Insights and Forecast - by Overall
- 7.2. Market Analysis, Insights and Forecast - by Key Components
- 7.2.1. Hardware
- 7.2.2. Software
- 7.2.3. Services
- 7.3. Market Analysis, Insights and Forecast - by Key Applications
- 7.3.1. Asset Condition Monitoring
- 7.3.2. Logistics & Supply Chain Management
- 7.3.3. Location Tracking
- 7.3.4. Security
- 7.3.5. Others
- 7.4. Market Analysis, Insights and Forecast - by Geography
- 7.4.1. China
- 7.4.2. Japan
- 7.4.3. South Korea
- 7.4.4. Middle East
- 7.4.5. Australia and New Zealand
- 7.1. Market Analysis, Insights and Forecast - by Overall
- 8. South Korea Asia Pacific Container Monitoring Market Analysis, Insights and Forecast, 2019-2031
- 8.1. Market Analysis, Insights and Forecast - by Overall
- 8.2. Market Analysis, Insights and Forecast - by Key Components
- 8.2.1. Hardware
- 8.2.2. Software
- 8.2.3. Services
- 8.3. Market Analysis, Insights and Forecast - by Key Applications
- 8.3.1. Asset Condition Monitoring
- 8.3.2. Logistics & Supply Chain Management
- 8.3.3. Location Tracking
- 8.3.4. Security
- 8.3.5. Others
- 8.4. Market Analysis, Insights and Forecast - by Geography
- 8.4.1. China
- 8.4.2. Japan
- 8.4.3. South Korea
- 8.4.4. Middle East
- 8.4.5. Australia and New Zealand
- 8.1. Market Analysis, Insights and Forecast - by Overall
- 9. Middle East Asia Pacific Container Monitoring Market Analysis, Insights and Forecast, 2019-2031
- 9.1. Market Analysis, Insights and Forecast - by Overall
- 9.2. Market Analysis, Insights and Forecast - by Key Components
- 9.2.1. Hardware
- 9.2.2. Software
- 9.2.3. Services
- 9.3. Market Analysis, Insights and Forecast - by Key Applications
- 9.3.1. Asset Condition Monitoring
- 9.3.2. Logistics & Supply Chain Management
- 9.3.3. Location Tracking
- 9.3.4. Security
- 9.3.5. Others
- 9.4. Market Analysis, Insights and Forecast - by Geography
- 9.4.1. China
- 9.4.2. Japan
- 9.4.3. South Korea
- 9.4.4. Middle East
- 9.4.5. Australia and New Zealand
- 9.1. Market Analysis, Insights and Forecast - by Overall
- 10. Australia and New Zealand Asia Pacific Container Monitoring Market Analysis, Insights and Forecast, 2019-2031
- 10.1. Market Analysis, Insights and Forecast - by Overall
- 10.2. Market Analysis, Insights and Forecast - by Key Components
- 10.2.1. Hardware
- 10.2.2. Software
- 10.2.3. Services
- 10.3. Market Analysis, Insights and Forecast - by Key Applications
- 10.3.1. Asset Condition Monitoring
- 10.3.2. Logistics & Supply Chain Management
- 10.3.3. Location Tracking
- 10.3.4. Security
- 10.3.5. Others
- 10.4. Market Analysis, Insights and Forecast - by Geography
- 10.4.1. China
- 10.4.2. Japan
- 10.4.3. South Korea
- 10.4.4. Middle East
- 10.4.5. Australia and New Zealand
- 10.1. Market Analysis, Insights and Forecast - by Overall
- 11. Competitive Analysis
- 11.1. Global Market Share Analysis 2024
- 11.2. Company Profiles
- 11.2.1 ORBCOMM Inc
- 11.2.1.1. Overview
- 11.2.1.2. Products
- 11.2.1.3. SWOT Analysis
- 11.2.1.4. Recent Developments
- 11.2.1.5. Financials (Based on Availability)
- 11.2.2 Geoforce Inc
- 11.2.2.1. Overview
- 11.2.2.2. Products
- 11.2.2.3. SWOT Analysis
- 11.2.2.4. Recent Developments
- 11.2.2.5. Financials (Based on Availability)
- 11.2.3 Globe Tracker ApS
- 11.2.3.1. Overview
- 11.2.3.2. Products
- 11.2.3.3. SWOT Analysis
- 11.2.3.4. Recent Developments
- 11.2.3.5. Financials (Based on Availability)
- 11.2.4 Phillips Connect Technologies (Phillips Industries Inc )
- 11.2.4.1. Overview
- 11.2.4.2. Products
- 11.2.4.3. SWOT Analysis
- 11.2.4.4. Recent Developments
- 11.2.4.5. Financials (Based on Availability)
- 11.2.5 Emerson Electric Co
- 11.2.5.1. Overview
- 11.2.5.2. Products
- 11.2.5.3. SWOT Analysis
- 11.2.5.4. Recent Developments
- 11.2.5.5. Financials (Based on Availability)
- 11.2.6 Hapag-Lloyd AG
- 11.2.6.1. Overview
- 11.2.6.2. Products
- 11.2.6.3. SWOT Analysis
- 11.2.6.4. Recent Developments
- 11.2.6.5. Financials (Based on Availability)
- 11.2.7 TRAXENS
- 11.2.7.1. Overview
- 11.2.7.2. Products
- 11.2.7.3. SWOT Analysis
- 11.2.7.4. Recent Developments
- 11.2.7.5. Financials (Based on Availability)
- 11.2.8 Roambee Corporation
- 11.2.8.1. Overview
- 11.2.8.2. Products
- 11.2.8.3. SWOT Analysis
- 11.2.8.4. Recent Developments
- 11.2.8.5. Financials (Based on Availability)
- 11.2.9 OnAsset Intelligence Inc
- 11.2.9.1. Overview
- 11.2.9.2. Products
- 11.2.9.3. SWOT Analysis
- 11.2.9.4. Recent Developments
- 11.2.9.5. Financials (Based on Availability)
- 11.2.10 Zabbix LLC *List Not Exhaustive
- 11.2.10.1. Overview
- 11.2.10.2. Products
- 11.2.10.3. SWOT Analysis
- 11.2.10.4. Recent Developments
- 11.2.10.5. Financials (Based on Availability)
- 11.2.1 ORBCOMM Inc
List of Figures
- Figure 1: Global Asia Pacific Container Monitoring Market Revenue Breakdown (Million, %) by Region 2024 & 2032
- Figure 2: Global Asia Pacific Container Monitoring Market Volume Breakdown (Billion, %) by Region 2024 & 2032
- Figure 3: China Asia Pacific Container Monitoring Market Revenue (Million), by Overall 2024 & 2032
- Figure 4: China Asia Pacific Container Monitoring Market Volume (Billion), by Overall 2024 & 2032
- Figure 5: China Asia Pacific Container Monitoring Market Revenue Share (%), by Overall 2024 & 2032
- Figure 6: China Asia Pacific Container Monitoring Market Volume Share (%), by Overall 2024 & 2032
- Figure 7: China Asia Pacific Container Monitoring Market Revenue (Million), by Key Components 2024 & 2032
- Figure 8: China Asia Pacific Container Monitoring Market Volume (Billion), by Key Components 2024 & 2032
- Figure 9: China Asia Pacific Container Monitoring Market Revenue Share (%), by Key Components 2024 & 2032
- Figure 10: China Asia Pacific Container Monitoring Market Volume Share (%), by Key Components 2024 & 2032
- Figure 11: China Asia Pacific Container Monitoring Market Revenue (Million), by Key Applications 2024 & 2032
- Figure 12: China Asia Pacific Container Monitoring Market Volume (Billion), by Key Applications 2024 & 2032
- Figure 13: China Asia Pacific Container Monitoring Market Revenue Share (%), by Key Applications 2024 & 2032
- Figure 14: China Asia Pacific Container Monitoring Market Volume Share (%), by Key Applications 2024 & 2032
- Figure 15: China Asia Pacific Container Monitoring Market Revenue (Million), by Geography 2024 & 2032
- Figure 16: China Asia Pacific Container Monitoring Market Volume (Billion), by Geography 2024 & 2032
- Figure 17: China Asia Pacific Container Monitoring Market Revenue Share (%), by Geography 2024 & 2032
- Figure 18: China Asia Pacific Container Monitoring Market Volume Share (%), by Geography 2024 & 2032
- Figure 19: China Asia Pacific Container Monitoring Market Revenue (Million), by Country 2024 & 2032
- Figure 20: China Asia Pacific Container Monitoring Market Volume (Billion), by Country 2024 & 2032
- Figure 21: China Asia Pacific Container Monitoring Market Revenue Share (%), by Country 2024 & 2032
- Figure 22: China Asia Pacific Container Monitoring Market Volume Share (%), by Country 2024 & 2032
- Figure 23: Japan Asia Pacific Container Monitoring Market Revenue (Million), by Overall 2024 & 2032
- Figure 24: Japan Asia Pacific Container Monitoring Market Volume (Billion), by Overall 2024 & 2032
- Figure 25: Japan Asia Pacific Container Monitoring Market Revenue Share (%), by Overall 2024 & 2032
- Figure 26: Japan Asia Pacific Container Monitoring Market Volume Share (%), by Overall 2024 & 2032
- Figure 27: Japan Asia Pacific Container Monitoring Market Revenue (Million), by Key Components 2024 & 2032
- Figure 28: Japan Asia Pacific Container Monitoring Market Volume (Billion), by Key Components 2024 & 2032
- Figure 29: Japan Asia Pacific Container Monitoring Market Revenue Share (%), by Key Components 2024 & 2032
- Figure 30: Japan Asia Pacific Container Monitoring Market Volume Share (%), by Key Components 2024 & 2032
- Figure 31: Japan Asia Pacific Container Monitoring Market Revenue (Million), by Key Applications 2024 & 2032
- Figure 32: Japan Asia Pacific Container Monitoring Market Volume (Billion), by Key Applications 2024 & 2032
- Figure 33: Japan Asia Pacific Container Monitoring Market Revenue Share (%), by Key Applications 2024 & 2032
- Figure 34: Japan Asia Pacific Container Monitoring Market Volume Share (%), by Key Applications 2024 & 2032
- Figure 35: Japan Asia Pacific Container Monitoring Market Revenue (Million), by Geography 2024 & 2032
- Figure 36: Japan Asia Pacific Container Monitoring Market Volume (Billion), by Geography 2024 & 2032
- Figure 37: Japan Asia Pacific Container Monitoring Market Revenue Share (%), by Geography 2024 & 2032
- Figure 38: Japan Asia Pacific Container Monitoring Market Volume Share (%), by Geography 2024 & 2032
- Figure 39: Japan Asia Pacific Container Monitoring Market Revenue (Million), by Country 2024 & 2032
- Figure 40: Japan Asia Pacific Container Monitoring Market Volume (Billion), by Country 2024 & 2032
- Figure 41: Japan Asia Pacific Container Monitoring Market Revenue Share (%), by Country 2024 & 2032
- Figure 42: Japan Asia Pacific Container Monitoring Market Volume Share (%), by Country 2024 & 2032
- Figure 43: South Korea Asia Pacific Container Monitoring Market Revenue (Million), by Overall 2024 & 2032
- Figure 44: South Korea Asia Pacific Container Monitoring Market Volume (Billion), by Overall 2024 & 2032
- Figure 45: South Korea Asia Pacific Container Monitoring Market Revenue Share (%), by Overall 2024 & 2032
- Figure 46: South Korea Asia Pacific Container Monitoring Market Volume Share (%), by Overall 2024 & 2032
- Figure 47: South Korea Asia Pacific Container Monitoring Market Revenue (Million), by Key Components 2024 & 2032
- Figure 48: South Korea Asia Pacific Container Monitoring Market Volume (Billion), by Key Components 2024 & 2032
- Figure 49: South Korea Asia Pacific Container Monitoring Market Revenue Share (%), by Key Components 2024 & 2032
- Figure 50: South Korea Asia Pacific Container Monitoring Market Volume Share (%), by Key Components 2024 & 2032
- Figure 51: South Korea Asia Pacific Container Monitoring Market Revenue (Million), by Key Applications 2024 & 2032
- Figure 52: South Korea Asia Pacific Container Monitoring Market Volume (Billion), by Key Applications 2024 & 2032
- Figure 53: South Korea Asia Pacific Container Monitoring Market Revenue Share (%), by Key Applications 2024 & 2032
- Figure 54: South Korea Asia Pacific Container Monitoring Market Volume Share (%), by Key Applications 2024 & 2032
- Figure 55: South Korea Asia Pacific Container Monitoring Market Revenue (Million), by Geography 2024 & 2032
- Figure 56: South Korea Asia Pacific Container Monitoring Market Volume (Billion), by Geography 2024 & 2032
- Figure 57: South Korea Asia Pacific Container Monitoring Market Revenue Share (%), by Geography 2024 & 2032
- Figure 58: South Korea Asia Pacific Container Monitoring Market Volume Share (%), by Geography 2024 & 2032
- Figure 59: South Korea Asia Pacific Container Monitoring Market Revenue (Million), by Country 2024 & 2032
- Figure 60: South Korea Asia Pacific Container Monitoring Market Volume (Billion), by Country 2024 & 2032
- Figure 61: South Korea Asia Pacific Container Monitoring Market Revenue Share (%), by Country 2024 & 2032
- Figure 62: South Korea Asia Pacific Container Monitoring Market Volume Share (%), by Country 2024 & 2032
- Figure 63: Middle East Asia Pacific Container Monitoring Market Revenue (Million), by Overall 2024 & 2032
- Figure 64: Middle East Asia Pacific Container Monitoring Market Volume (Billion), by Overall 2024 & 2032
- Figure 65: Middle East Asia Pacific Container Monitoring Market Revenue Share (%), by Overall 2024 & 2032
- Figure 66: Middle East Asia Pacific Container Monitoring Market Volume Share (%), by Overall 2024 & 2032
- Figure 67: Middle East Asia Pacific Container Monitoring Market Revenue (Million), by Key Components 2024 & 2032
- Figure 68: Middle East Asia Pacific Container Monitoring Market Volume (Billion), by Key Components 2024 & 2032
- Figure 69: Middle East Asia Pacific Container Monitoring Market Revenue Share (%), by Key Components 2024 & 2032
- Figure 70: Middle East Asia Pacific Container Monitoring Market Volume Share (%), by Key Components 2024 & 2032
- Figure 71: Middle East Asia Pacific Container Monitoring Market Revenue (Million), by Key Applications 2024 & 2032
- Figure 72: Middle East Asia Pacific Container Monitoring Market Volume (Billion), by Key Applications 2024 & 2032
- Figure 73: Middle East Asia Pacific Container Monitoring Market Revenue Share (%), by Key Applications 2024 & 2032
- Figure 74: Middle East Asia Pacific Container Monitoring Market Volume Share (%), by Key Applications 2024 & 2032
- Figure 75: Middle East Asia Pacific Container Monitoring Market Revenue (Million), by Geography 2024 & 2032
- Figure 76: Middle East Asia Pacific Container Monitoring Market Volume (Billion), by Geography 2024 & 2032
- Figure 77: Middle East Asia Pacific Container Monitoring Market Revenue Share (%), by Geography 2024 & 2032
- Figure 78: Middle East Asia Pacific Container Monitoring Market Volume Share (%), by Geography 2024 & 2032
- Figure 79: Middle East Asia Pacific Container Monitoring Market Revenue (Million), by Country 2024 & 2032
- Figure 80: Middle East Asia Pacific Container Monitoring Market Volume (Billion), by Country 2024 & 2032
- Figure 81: Middle East Asia Pacific Container Monitoring Market Revenue Share (%), by Country 2024 & 2032
- Figure 82: Middle East Asia Pacific Container Monitoring Market Volume Share (%), by Country 2024 & 2032
- Figure 83: Australia and New Zealand Asia Pacific Container Monitoring Market Revenue (Million), by Overall 2024 & 2032
- Figure 84: Australia and New Zealand Asia Pacific Container Monitoring Market Volume (Billion), by Overall 2024 & 2032
- Figure 85: Australia and New Zealand Asia Pacific Container Monitoring Market Revenue Share (%), by Overall 2024 & 2032
- Figure 86: Australia and New Zealand Asia Pacific Container Monitoring Market Volume Share (%), by Overall 2024 & 2032
- Figure 87: Australia and New Zealand Asia Pacific Container Monitoring Market Revenue (Million), by Key Components 2024 & 2032
- Figure 88: Australia and New Zealand Asia Pacific Container Monitoring Market Volume (Billion), by Key Components 2024 & 2032
- Figure 89: Australia and New Zealand Asia Pacific Container Monitoring Market Revenue Share (%), by Key Components 2024 & 2032
- Figure 90: Australia and New Zealand Asia Pacific Container Monitoring Market Volume Share (%), by Key Components 2024 & 2032
- Figure 91: Australia and New Zealand Asia Pacific Container Monitoring Market Revenue (Million), by Key Applications 2024 & 2032
- Figure 92: Australia and New Zealand Asia Pacific Container Monitoring Market Volume (Billion), by Key Applications 2024 & 2032
- Figure 93: Australia and New Zealand Asia Pacific Container Monitoring Market Revenue Share (%), by Key Applications 2024 & 2032
- Figure 94: Australia and New Zealand Asia Pacific Container Monitoring Market Volume Share (%), by Key Applications 2024 & 2032
- Figure 95: Australia and New Zealand Asia Pacific Container Monitoring Market Revenue (Million), by Geography 2024 & 2032
- Figure 96: Australia and New Zealand Asia Pacific Container Monitoring Market Volume (Billion), by Geography 2024 & 2032
- Figure 97: Australia and New Zealand Asia Pacific Container Monitoring Market Revenue Share (%), by Geography 2024 & 2032
- Figure 98: Australia and New Zealand Asia Pacific Container Monitoring Market Volume Share (%), by Geography 2024 & 2032
- Figure 99: Australia and New Zealand Asia Pacific Container Monitoring Market Revenue (Million), by Country 2024 & 2032
- Figure 100: Australia and New Zealand Asia Pacific Container Monitoring Market Volume (Billion), by Country 2024 & 2032
- Figure 101: Australia and New Zealand Asia Pacific Container Monitoring Market Revenue Share (%), by Country 2024 & 2032
- Figure 102: Australia and New Zealand Asia Pacific Container Monitoring Market Volume Share (%), by Country 2024 & 2032
List of Tables
- Table 1: Global Asia Pacific Container Monitoring Market Revenue Million Forecast, by Region 2019 & 2032
- Table 2: Global Asia Pacific Container Monitoring Market Volume Billion Forecast, by Region 2019 & 2032
- Table 3: Global Asia Pacific Container Monitoring Market Revenue Million Forecast, by Overall 2019 & 2032
- Table 4: Global Asia Pacific Container Monitoring Market Volume Billion Forecast, by Overall 2019 & 2032
- Table 5: Global Asia Pacific Container Monitoring Market Revenue Million Forecast, by Key Components 2019 & 2032
- Table 6: Global Asia Pacific Container Monitoring Market Volume Billion Forecast, by Key Components 2019 & 2032
- Table 7: Global Asia Pacific Container Monitoring Market Revenue Million Forecast, by Key Applications 2019 & 2032
- Table 8: Global Asia Pacific Container Monitoring Market Volume Billion Forecast, by Key Applications 2019 & 2032
- Table 9: Global Asia Pacific Container Monitoring Market Revenue Million Forecast, by Geography 2019 & 2032
- Table 10: Global Asia Pacific Container Monitoring Market Volume Billion Forecast, by Geography 2019 & 2032
- Table 11: Global Asia Pacific Container Monitoring Market Revenue Million Forecast, by Region 2019 & 2032
- Table 12: Global Asia Pacific Container Monitoring Market Volume Billion Forecast, by Region 2019 & 2032
- Table 13: Global Asia Pacific Container Monitoring Market Revenue Million Forecast, by Overall 2019 & 2032
- Table 14: Global Asia Pacific Container Monitoring Market Volume Billion Forecast, by Overall 2019 & 2032
- Table 15: Global Asia Pacific Container Monitoring Market Revenue Million Forecast, by Key Components 2019 & 2032
- Table 16: Global Asia Pacific Container Monitoring Market Volume Billion Forecast, by Key Components 2019 & 2032
- Table 17: Global Asia Pacific Container Monitoring Market Revenue Million Forecast, by Key Applications 2019 & 2032
- Table 18: Global Asia Pacific Container Monitoring Market Volume Billion Forecast, by Key Applications 2019 & 2032
- Table 19: Global Asia Pacific Container Monitoring Market Revenue Million Forecast, by Geography 2019 & 2032
- Table 20: Global Asia Pacific Container Monitoring Market Volume Billion Forecast, by Geography 2019 & 2032
- Table 21: Global Asia Pacific Container Monitoring Market Revenue Million Forecast, by Country 2019 & 2032
- Table 22: Global Asia Pacific Container Monitoring Market Volume Billion Forecast, by Country 2019 & 2032
- Table 23: Global Asia Pacific Container Monitoring Market Revenue Million Forecast, by Overall 2019 & 2032
- Table 24: Global Asia Pacific Container Monitoring Market Volume Billion Forecast, by Overall 2019 & 2032
- Table 25: Global Asia Pacific Container Monitoring Market Revenue Million Forecast, by Key Components 2019 & 2032
- Table 26: Global Asia Pacific Container Monitoring Market Volume Billion Forecast, by Key Components 2019 & 2032
- Table 27: Global Asia Pacific Container Monitoring Market Revenue Million Forecast, by Key Applications 2019 & 2032
- Table 28: Global Asia Pacific Container Monitoring Market Volume Billion Forecast, by Key Applications 2019 & 2032
- Table 29: Global Asia Pacific Container Monitoring Market Revenue Million Forecast, by Geography 2019 & 2032
- Table 30: Global Asia Pacific Container Monitoring Market Volume Billion Forecast, by Geography 2019 & 2032
- Table 31: Global Asia Pacific Container Monitoring Market Revenue Million Forecast, by Country 2019 & 2032
- Table 32: Global Asia Pacific Container Monitoring Market Volume Billion Forecast, by Country 2019 & 2032
- Table 33: Global Asia Pacific Container Monitoring Market Revenue Million Forecast, by Overall 2019 & 2032
- Table 34: Global Asia Pacific Container Monitoring Market Volume Billion Forecast, by Overall 2019 & 2032
- Table 35: Global Asia Pacific Container Monitoring Market Revenue Million Forecast, by Key Components 2019 & 2032
- Table 36: Global Asia Pacific Container Monitoring Market Volume Billion Forecast, by Key Components 2019 & 2032
- Table 37: Global Asia Pacific Container Monitoring Market Revenue Million Forecast, by Key Applications 2019 & 2032
- Table 38: Global Asia Pacific Container Monitoring Market Volume Billion Forecast, by Key Applications 2019 & 2032
- Table 39: Global Asia Pacific Container Monitoring Market Revenue Million Forecast, by Geography 2019 & 2032
- Table 40: Global Asia Pacific Container Monitoring Market Volume Billion Forecast, by Geography 2019 & 2032
- Table 41: Global Asia Pacific Container Monitoring Market Revenue Million Forecast, by Country 2019 & 2032
- Table 42: Global Asia Pacific Container Monitoring Market Volume Billion Forecast, by Country 2019 & 2032
- Table 43: Global Asia Pacific Container Monitoring Market Revenue Million Forecast, by Overall 2019 & 2032
- Table 44: Global Asia Pacific Container Monitoring Market Volume Billion Forecast, by Overall 2019 & 2032
- Table 45: Global Asia Pacific Container Monitoring Market Revenue Million Forecast, by Key Components 2019 & 2032
- Table 46: Global Asia Pacific Container Monitoring Market Volume Billion Forecast, by Key Components 2019 & 2032
- Table 47: Global Asia Pacific Container Monitoring Market Revenue Million Forecast, by Key Applications 2019 & 2032
- Table 48: Global Asia Pacific Container Monitoring Market Volume Billion Forecast, by Key Applications 2019 & 2032
- Table 49: Global Asia Pacific Container Monitoring Market Revenue Million Forecast, by Geography 2019 & 2032
- Table 50: Global Asia Pacific Container Monitoring Market Volume Billion Forecast, by Geography 2019 & 2032
- Table 51: Global Asia Pacific Container Monitoring Market Revenue Million Forecast, by Country 2019 & 2032
- Table 52: Global Asia Pacific Container Monitoring Market Volume Billion Forecast, by Country 2019 & 2032
- Table 53: Global Asia Pacific Container Monitoring Market Revenue Million Forecast, by Overall 2019 & 2032
- Table 54: Global Asia Pacific Container Monitoring Market Volume Billion Forecast, by Overall 2019 & 2032
- Table 55: Global Asia Pacific Container Monitoring Market Revenue Million Forecast, by Key Components 2019 & 2032
- Table 56: Global Asia Pacific Container Monitoring Market Volume Billion Forecast, by Key Components 2019 & 2032
- Table 57: Global Asia Pacific Container Monitoring Market Revenue Million Forecast, by Key Applications 2019 & 2032
- Table 58: Global Asia Pacific Container Monitoring Market Volume Billion Forecast, by Key Applications 2019 & 2032
- Table 59: Global Asia Pacific Container Monitoring Market Revenue Million Forecast, by Geography 2019 & 2032
- Table 60: Global Asia Pacific Container Monitoring Market Volume Billion Forecast, by Geography 2019 & 2032
- Table 61: Global Asia Pacific Container Monitoring Market Revenue Million Forecast, by Country 2019 & 2032
- Table 62: Global Asia Pacific Container Monitoring Market Volume Billion Forecast, by Country 2019 & 2032
Frequently Asked Questions
1. What is the projected Compound Annual Growth Rate (CAGR) of the Asia Pacific Container Monitoring Market?
The projected CAGR is approximately 16.38%.
2. Which companies are prominent players in the Asia Pacific Container Monitoring Market?
Key companies in the market include ORBCOMM Inc, Geoforce Inc, Globe Tracker ApS, Phillips Connect Technologies (Phillips Industries Inc ), Emerson Electric Co, Hapag-Lloyd AG, TRAXENS, Roambee Corporation, OnAsset Intelligence Inc, Zabbix LLC *List Not Exhaustive.
3. What are the main segments of the Asia Pacific Container Monitoring Market?
The market segments include Overall , Key Components, Key Applications, Geography.
4. Can you provide details about the market size?
The market size is estimated to be USD 2.26 Million as of 2022.
5. What are some drivers contributing to market growth?
Surge in Advanced Containment Materials and Structural Innovations; Increase in Seaborne Trade; Increase in Demand to Enhanced Supply Chain Efficiency.
6. What are the notable trends driving market growth?
Container Monitoring to be a Key Driver for Growth in Logistics and Supply Chain Management.
7. Are there any restraints impacting market growth?
Surge in Advanced Containment Materials and Structural Innovations; Increase in Seaborne Trade; Increase in Demand to Enhanced Supply Chain Efficiency.
8. Can you provide examples of recent developments in the market?
September 2024: ZIM Integrated Shipping Services Ltd., a container liner shipping company, announced that it has entered into a new long-term operational cooperation with Mediterranean Shipping Company (MSC) on the Asia - US East Coast and Asia - US Gulf trades. The new services are scheduled to be launched in February 2025, subject to regulatory approvals and filings. This important collaboration reflects ZIM's commitment to both delivering an outstanding shipping solution to its customers and taking continuous proactive steps to enhance efficiencies in their network. It is the direct outcome of their fleet renewal program which has greatly enhanced ZIM's competitive position, particularly on the Asia to US East Coast tradeSeptember 2024: Kalmar has signed an agreement with ContainerCo, a key independent container depot operator in New Zealand, to supply six Kalmar empty container handlers. ContainerCo has grown to become one of the key independent container depots in New Zealand, offering an extensive range of products and services to countless commercial and private customers. The company’s offering includes shipping container sales and leasing, container modification, depot services and container transportation services. The current ContainerCo fleet includes 12 Kalmar empty container handlers.
9. What pricing options are available for accessing the report?
Pricing options include single-user, multi-user, and enterprise licenses priced at USD 4750, USD 5250, and USD 8750 respectively.
10. Is the market size provided in terms of value or volume?
The market size is provided in terms of value, measured in Million and volume, measured in Billion.
11. Are there any specific market keywords associated with the report?
Yes, the market keyword associated with the report is "Asia Pacific Container Monitoring Market," which aids in identifying and referencing the specific market segment covered.
12. How do I determine which pricing option suits my needs best?
The pricing options vary based on user requirements and access needs. Individual users may opt for single-user licenses, while businesses requiring broader access may choose multi-user or enterprise licenses for cost-effective access to the report.
13. Are there any additional resources or data provided in the Asia Pacific Container Monitoring Market report?
While the report offers comprehensive insights, it's advisable to review the specific contents or supplementary materials provided to ascertain if additional resources or data are available.
14. How can I stay updated on further developments or reports in the Asia Pacific Container Monitoring Market?
To stay informed about further developments, trends, and reports in the Asia Pacific Container Monitoring Market, consider subscribing to industry newsletters, following relevant companies and organizations, or regularly checking reputable industry news sources and publications.
Methodology
Step 1 - Identification of Relevant Samples Size from Population Database


Step 2 - Approaches for Defining Global Market Size (Value, Volume* & Price*)

Note*: In applicable scenarios
Step 3 - Data Sources
Primary Research
- Web Analytics
- Survey Reports
- Research Institute
- Latest Research Reports
- Opinion Leaders
Secondary Research
- Annual Reports
- White Paper
- Latest Press Release
- Industry Association
- Paid Database
- Investor Presentations

Step 4 - Data Triangulation
Involves using different sources of information in order to increase the validity of a study
These sources are likely to be stakeholders in a program - participants, other researchers, program staff, other community members, and so on.
Then we put all data in single framework & apply various statistical tools to find out the dynamic on the market.
During the analysis stage, feedback from the stakeholder groups would be compared to determine areas of agreement as well as areas of divergence


