
Key Insights
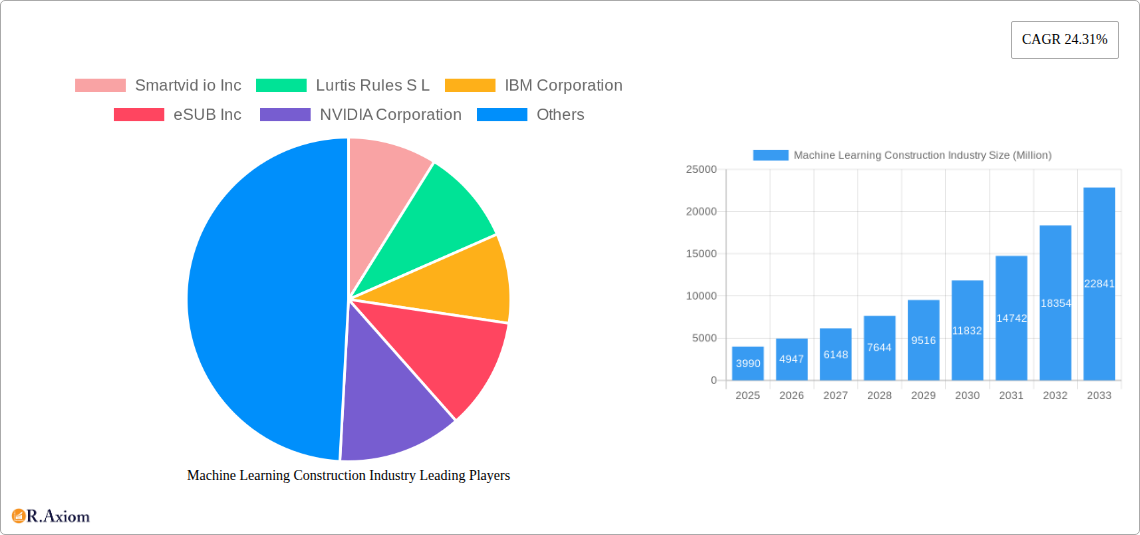
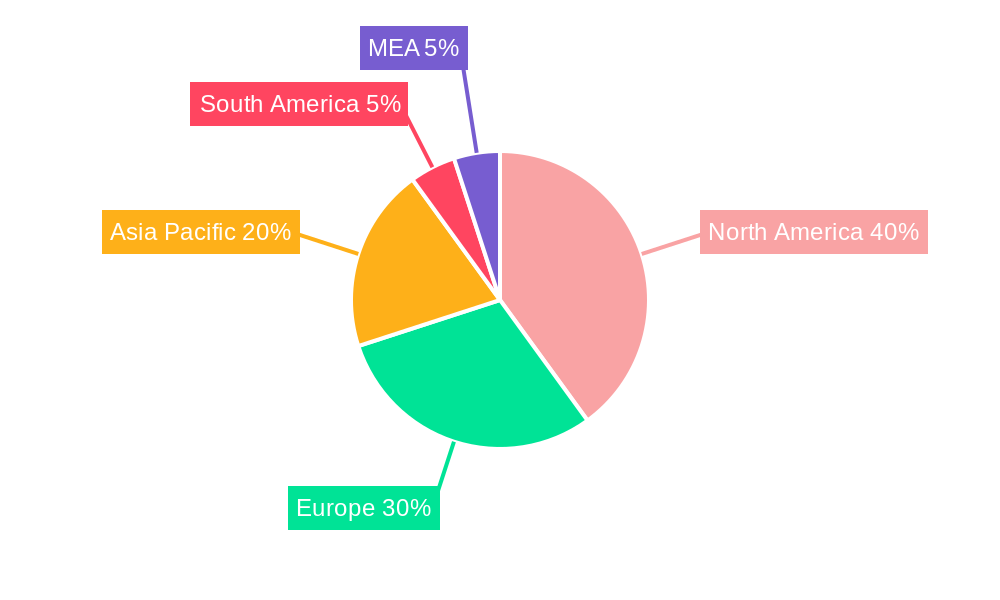
The Machine Learning (ML) Construction market is experiencing robust growth, projected to reach $3.99 billion in 2025 and expand significantly over the forecast period (2025-2033). A compound annual growth rate (CAGR) of 24.31% indicates a rapidly evolving landscape driven by several key factors. Increased adoption of Building Information Modeling (BIM) and the need for improved project efficiency are major contributors. The integration of ML algorithms for planning and design optimizes resource allocation and reduces project timelines. Furthermore, the rising demand for enhanced safety measures on construction sites, facilitated by ML-powered predictive analytics and risk assessment tools, fuels market expansion. Autonomous equipment, another significant segment, leverages ML for enhanced precision and safety, leading to increased productivity and reduced labor costs. Finally, ML's role in monitoring and maintenance is crucial for predictive maintenance, minimizing downtime and extending the lifespan of construction assets. The market's geographical distribution reflects a strong presence in North America and Europe, driven by technological advancements and early adoption, with Asia-Pacific poised for significant growth in the coming years due to increasing infrastructure development and investment.
The competitive landscape is dynamic, with a mix of established players like IBM, Autodesk, and Microsoft alongside innovative startups like Smartvid.io and Doxel. These companies offer a wide array of ML-based solutions tailored to various construction needs. However, challenges remain, including the need for robust data infrastructure, integration with existing systems, and the high cost of implementation, which could potentially slow adoption in some regions. Despite these challenges, the long-term outlook for the ML Construction market remains positive, fueled by ongoing technological advancements, increasing awareness of the benefits of ML, and the construction industry's continuous pursuit of efficiency and safety improvements. The focus will likely shift towards more specialized and integrated ML solutions catering to specific construction needs and addressing data privacy and security concerns.
This comprehensive report provides a detailed analysis of the Machine Learning Construction Industry, offering invaluable insights for stakeholders, investors, and industry professionals. The report covers market size and growth projections from 2019 to 2033, focusing on key segments, leading players, and emerging trends. With a base year of 2025 and an estimated year of 2025, this report provides a robust forecast for the period 2025-2033, encompassing the historical period of 2019-2024. The total market size is projected to reach xx Million by 2033.
Machine Learning Construction Industry Market Concentration & Innovation
This section analyzes the competitive landscape, focusing on market concentration, innovation drivers, regulatory influences, and M&A activity within the Machine Learning Construction Industry. The market is characterized by a mix of established technology giants and innovative startups, leading to both consolidation and fragmentation.
Market Concentration: The market exhibits moderate concentration, with a few major players holding significant market share. However, a substantial number of smaller companies are contributing to innovation and niche applications. The top 5 companies collectively hold approximately xx% of the market share, while the remaining xx% is distributed among numerous smaller players.
Innovation Drivers: Key innovation drivers include advancements in AI algorithms, cloud computing, IoT technologies, and the increasing availability of construction data. The demand for improved efficiency, safety, and sustainability in construction projects is further accelerating innovation.
Regulatory Frameworks: Government regulations concerning data privacy, cybersecurity, and building codes significantly impact market dynamics. Compliance requirements drive the development of solutions that address these regulatory aspects.
Product Substitutes: Traditional construction methods and software pose a competitive threat; however, the unique benefits of machine learning solutions, such as enhanced accuracy and efficiency, offer a significant advantage.
End-User Trends: The construction industry is increasingly adopting digital technologies to improve project delivery and operational efficiency. This shift is fuelling the demand for machine learning-based solutions.
M&A Activities: Significant M&A activity has been observed, with large corporations acquiring smaller, specialized firms to expand their capabilities and market reach. Total M&A deal values in the last five years reached approximately xx Million, indicating strong investor interest in the sector. Examples include Briq's acquisition of Swipez in September 2022.
Machine Learning Construction Industry Industry Trends & Insights
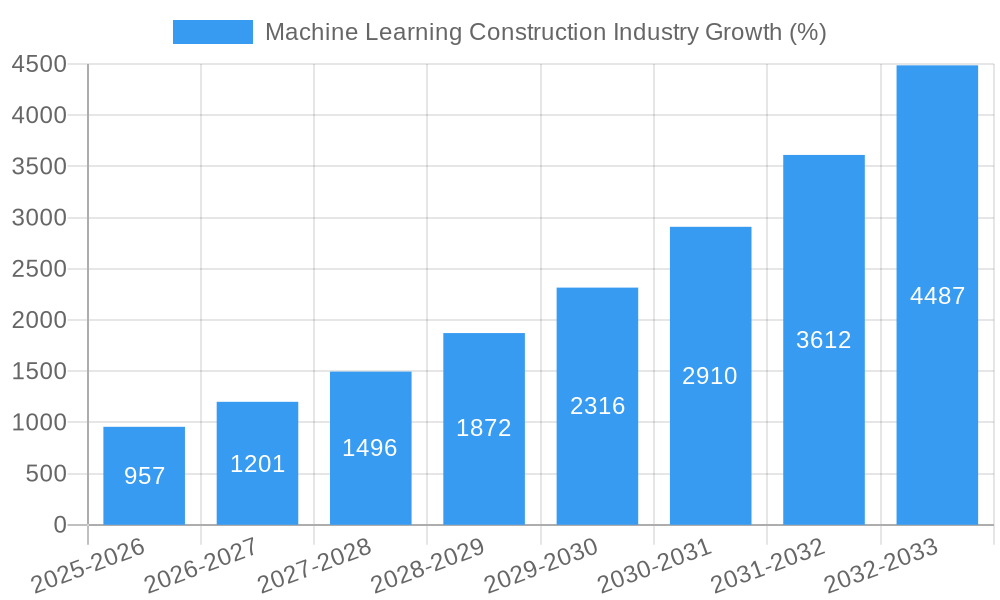
This section delves into the key trends shaping the Machine Learning Construction Industry, including market growth drivers, technological disruptions, and competitive dynamics. The industry is experiencing rapid growth, driven by increasing adoption of digital technologies and the need for improved project efficiency.
The Compound Annual Growth Rate (CAGR) for the period 2025-2033 is estimated at xx%, reflecting strong market expansion. Market penetration of machine learning solutions in the construction industry is currently at xx% and is projected to reach xx% by 2033. Key factors driving this growth include the rising demand for automation, improved safety measures, data-driven decision-making, and the need for sustainable construction practices. Technological advancements, such as the development of more sophisticated AI algorithms and improved data analytics tools, are fueling further innovation and adoption. The competitive landscape is characterized by both established technology vendors and new entrants, leading to intense competition and continuous innovation. The market is segmented by application, with significant growth observed in planning and design, safety, and monitoring and maintenance segments.
Dominant Markets & Segments in Machine Learning Construction Industry
This section identifies the leading regions, countries, and application segments within the Machine Learning Construction Industry.
Dominant Region/Country: North America currently holds the largest market share, driven by high technological adoption rates and significant investment in construction infrastructure. However, Asia-Pacific is expected to witness the fastest growth rate due to substantial infrastructure development projects and rising adoption of technology.
Dominant Segments (By Application):
Planning and Design: This segment is witnessing significant growth due to the ability of machine learning to optimize designs, improve project scheduling, and reduce material waste.
Safety: Machine learning algorithms can analyze construction sites to identify potential hazards, improving worker safety and reducing accidents. This is a key area of growth.
Autonomous Equipment: The use of autonomous equipment is increasingly being adopted in construction, enabling higher productivity and reducing labor costs. Market growth in this segment is propelled by advancements in robotics and AI.
Monitoring and Maintenance: Machine learning plays a crucial role in predictive maintenance, enabling proactive identification of issues and preventing costly downtime. This segment is experiencing rapid expansion as the industry recognizes the long-term cost savings.
Key Drivers:
Economic Policies: Government initiatives promoting infrastructure development and technological adoption significantly influence market growth.
Infrastructure Development: Large-scale infrastructure projects in both developed and developing countries fuel demand for efficient construction solutions.
Technological Advancements: Continual improvements in AI and related technologies are expanding the capabilities and applications of machine learning in construction.
Machine Learning Construction Industry Product Developments
Recent product innovations focus on integrating AI-powered functionalities into existing construction workflows. New solutions leverage 360° imaging and AI-driven analytics to improve site monitoring, safety protocols, and project planning. Companies are developing more user-friendly interfaces and focusing on seamless integration with existing software solutions to enhance adoption. This emphasis on practical applicability and intuitive design is a crucial factor driving market penetration. The integration of blockchain technology is also emerging to enhance transparency and security in supply chain management.
Report Scope & Segmentation Analysis
This report segments the Machine Learning Construction Industry by application: Planning and Design, Safety, Autonomous Equipment, and Monitoring and Maintenance. Each segment's market size, growth projections, and competitive dynamics are analyzed, providing a granular understanding of the market structure. The Planning and Design segment is anticipated to maintain strong growth, driven by the increasing adoption of Building Information Modeling (BIM) and related technologies. The Safety segment is expected to grow rapidly due to the focus on improving worker safety. The Autonomous Equipment segment is projected to achieve significant growth as the use of autonomous machines increases. The Monitoring and Maintenance segment is expected to show substantial expansion due to the demand for predictive maintenance and improved asset management. The overall market is characterized by high growth potential and intense competition.
Key Drivers of Machine Learning Construction Industry Growth
Several factors drive the growth of the Machine Learning Construction Industry:
Increased efficiency and productivity: Machine learning optimizes processes, leading to faster project completion and cost savings.
Improved safety: AI-powered solutions identify and mitigate risks, enhancing worker safety and reducing accidents.
Better decision-making: Data-driven insights facilitate informed decisions, leading to improved project outcomes.
Sustainable construction: Machine learning enables the optimization of resource utilization and waste reduction.
Government initiatives: Government policies promoting technological adoption in construction are boosting market growth.
Challenges in the Machine Learning Construction Industry Sector
Despite the significant growth potential, the Machine Learning Construction Industry faces several challenges:
High initial investment costs: Implementing machine learning solutions can require substantial upfront investment, hindering adoption by smaller firms.
Data availability and quality: The effectiveness of machine learning algorithms relies on high-quality data, which can be challenging to obtain and manage in construction projects.
Integration with existing systems: Seamless integration with existing construction software and workflows is crucial for successful implementation.
Skills gap: The lack of skilled professionals with expertise in machine learning and construction poses a significant obstacle.
Cybersecurity concerns: The increasing reliance on data-driven solutions raises cybersecurity concerns.
Emerging Opportunities in Machine Learning Construction Industry
Several emerging opportunities exist for growth in the Machine Learning Construction Industry:
Expansion into new markets: Emerging economies with significant infrastructure development plans offer substantial market potential.
Development of new applications: Expanding the use of machine learning into new areas, such as supply chain optimization and risk management, presents growth opportunities.
Integration of new technologies: Combining machine learning with other advanced technologies, such as blockchain, creates new possibilities.
Focus on sustainability: Solutions that enhance sustainable construction practices are becoming increasingly important.
Improved data management: Tools and platforms for effective data management and analysis are crucial to unleashing the full potential of machine learning.
Leading Players in the Machine Learning Construction Industry Market
- Smartvid.io Inc
- Lurtis Rules S L
- IBM Corporation
- eSUB Inc
- NVIDIA Corporation
- Alice Technologies Inc
- Microsoft Corporation
- Building System Planning Inc
- Dassault Systèmes SE
- PTC Inc
- Autodesk Inc
- Oracle Corporation
- Bentley Systems Inc
- Doxel Inc
Key Developments in Machine Learning Construction Industry Industry
November 2022: Disperse.io launched Impulse, a new product integrating performance insights into building elevations using 360° site scans. This enhanced data visualization improves project management decision-making.
September 2022: Briq acquired Swipez, an Indian fintech company, automating billing and revenue collection in construction. This strengthens Briq's platform for automating critical financial workflows.
June 2022: Agile Business Technology (ABT) partnered with OpenSpace, launching a 360° capture and AI platform in South Africa, improving collaboration and quality control on construction projects.
Strategic Outlook for Machine Learning Construction Industry Market
The Machine Learning Construction Industry is poised for continued expansion, driven by the increasing adoption of digital technologies and the need for improved efficiency and sustainability in the construction sector. Opportunities exist for innovation in areas such as autonomous equipment, predictive maintenance, and enhanced safety measures. Companies focusing on user-friendly interfaces and seamless integration with existing workflows will be best positioned for success. Continued investment in research and development, along with strategic partnerships, will be crucial for capturing market share in this dynamic and rapidly evolving industry.
Machine Learning Construction Industry Segmentation
-
1. Application
- 1.1. Planning and Design
- 1.2. Safety
- 1.3. Autonomous Equipment
- 1.4. Monitoring and Maintenance
Machine Learning Construction Industry Segmentation By Geography
- 1. North America
- 2. Europe
- 3. Asia
- 4. Australia and New Zealand
- 5. Latin America
Machine Learning Construction Industry REPORT HIGHLIGHTS
| Aspects | Details |
|---|---|
| Study Period | 2019-2033 |
| Base Year | 2024 |
| Estimated Year | 2025 |
| Forecast Period | 2025-2033 |
| Historical Period | 2019-2024 |
| Growth Rate | CAGR of 24.31% from 2019-2033 |
| Segmentation |
|
Table of Contents
- 1. Introduction
- 1.1. Research Scope
- 1.2. Market Segmentation
- 1.3. Research Methodology
- 1.4. Definitions and Assumptions
- 2. Executive Summary
- 2.1. Introduction
- 3. Market Dynamics
- 3.1. Introduction
- 3.2. Market Drivers
- 3.2.1. Increasing Need to Reduce Production Costs; Demand for More Safety Measures at Construction Sites
- 3.3. Market Restrains
- 3.3.1. Cost and Implementation Issues
- 3.4. Market Trends
- 3.4.1. Planning and Design Application Segment is Expected to Hold Significant Market Share
- 4. Market Factor Analysis
- 4.1. Porters Five Forces
- 4.2. Supply/Value Chain
- 4.3. PESTEL analysis
- 4.4. Market Entropy
- 4.5. Patent/Trademark Analysis
- 5. Global Machine Learning Construction Industry Analysis, Insights and Forecast, 2019-2031
- 5.1. Market Analysis, Insights and Forecast - by Application
- 5.1.1. Planning and Design
- 5.1.2. Safety
- 5.1.3. Autonomous Equipment
- 5.1.4. Monitoring and Maintenance
- 5.2. Market Analysis, Insights and Forecast - by Region
- 5.2.1. North America
- 5.2.2. Europe
- 5.2.3. Asia
- 5.2.4. Australia and New Zealand
- 5.2.5. Latin America
- 5.1. Market Analysis, Insights and Forecast - by Application
- 6. North America Machine Learning Construction Industry Analysis, Insights and Forecast, 2019-2031
- 6.1. Market Analysis, Insights and Forecast - by Application
- 6.1.1. Planning and Design
- 6.1.2. Safety
- 6.1.3. Autonomous Equipment
- 6.1.4. Monitoring and Maintenance
- 6.1. Market Analysis, Insights and Forecast - by Application
- 7. Europe Machine Learning Construction Industry Analysis, Insights and Forecast, 2019-2031
- 7.1. Market Analysis, Insights and Forecast - by Application
- 7.1.1. Planning and Design
- 7.1.2. Safety
- 7.1.3. Autonomous Equipment
- 7.1.4. Monitoring and Maintenance
- 7.1. Market Analysis, Insights and Forecast - by Application
- 8. Asia Machine Learning Construction Industry Analysis, Insights and Forecast, 2019-2031
- 8.1. Market Analysis, Insights and Forecast - by Application
- 8.1.1. Planning and Design
- 8.1.2. Safety
- 8.1.3. Autonomous Equipment
- 8.1.4. Monitoring and Maintenance
- 8.1. Market Analysis, Insights and Forecast - by Application
- 9. Australia and New Zealand Machine Learning Construction Industry Analysis, Insights and Forecast, 2019-2031
- 9.1. Market Analysis, Insights and Forecast - by Application
- 9.1.1. Planning and Design
- 9.1.2. Safety
- 9.1.3. Autonomous Equipment
- 9.1.4. Monitoring and Maintenance
- 9.1. Market Analysis, Insights and Forecast - by Application
- 10. Latin America Machine Learning Construction Industry Analysis, Insights and Forecast, 2019-2031
- 10.1. Market Analysis, Insights and Forecast - by Application
- 10.1.1. Planning and Design
- 10.1.2. Safety
- 10.1.3. Autonomous Equipment
- 10.1.4. Monitoring and Maintenance
- 10.1. Market Analysis, Insights and Forecast - by Application
- 11. North America Machine Learning Construction Industry Analysis, Insights and Forecast, 2019-2031
- 11.1. Market Analysis, Insights and Forecast - By Country/Sub-region
- 11.1.1 United States
- 11.1.2 Canada
- 11.1.3 Mexico
- 12. Europe Machine Learning Construction Industry Analysis, Insights and Forecast, 2019-2031
- 12.1. Market Analysis, Insights and Forecast - By Country/Sub-region
- 12.1.1 Germany
- 12.1.2 United Kingdom
- 12.1.3 France
- 12.1.4 Spain
- 12.1.5 Italy
- 12.1.6 Spain
- 12.1.7 Belgium
- 12.1.8 Netherland
- 12.1.9 Nordics
- 12.1.10 Rest of Europe
- 13. Asia Pacific Machine Learning Construction Industry Analysis, Insights and Forecast, 2019-2031
- 13.1. Market Analysis, Insights and Forecast - By Country/Sub-region
- 13.1.1 China
- 13.1.2 Japan
- 13.1.3 India
- 13.1.4 South Korea
- 13.1.5 Southeast Asia
- 13.1.6 Australia
- 13.1.7 Indonesia
- 13.1.8 Phillipes
- 13.1.9 Singapore
- 13.1.10 Thailandc
- 13.1.11 Rest of Asia Pacific
- 14. South America Machine Learning Construction Industry Analysis, Insights and Forecast, 2019-2031
- 14.1. Market Analysis, Insights and Forecast - By Country/Sub-region
- 14.1.1 Brazil
- 14.1.2 Argentina
- 14.1.3 Peru
- 14.1.4 Chile
- 14.1.5 Colombia
- 14.1.6 Ecuador
- 14.1.7 Venezuela
- 14.1.8 Rest of South America
- 15. North America Machine Learning Construction Industry Analysis, Insights and Forecast, 2019-2031
- 15.1. Market Analysis, Insights and Forecast - By Country/Sub-region
- 15.1.1 United States
- 15.1.2 Canada
- 15.1.3 Mexico
- 16. MEA Machine Learning Construction Industry Analysis, Insights and Forecast, 2019-2031
- 16.1. Market Analysis, Insights and Forecast - By Country/Sub-region
- 16.1.1 United Arab Emirates
- 16.1.2 Saudi Arabia
- 16.1.3 South Africa
- 16.1.4 Rest of Middle East and Africa
- 17. Competitive Analysis
- 17.1. Global Market Share Analysis 2024
- 17.2. Company Profiles
- 17.2.1 Smartvid io Inc
- 17.2.1.1. Overview
- 17.2.1.2. Products
- 17.2.1.3. SWOT Analysis
- 17.2.1.4. Recent Developments
- 17.2.1.5. Financials (Based on Availability)
- 17.2.2 Lurtis Rules S L
- 17.2.2.1. Overview
- 17.2.2.2. Products
- 17.2.2.3. SWOT Analysis
- 17.2.2.4. Recent Developments
- 17.2.2.5. Financials (Based on Availability)
- 17.2.3 IBM Corporation
- 17.2.3.1. Overview
- 17.2.3.2. Products
- 17.2.3.3. SWOT Analysis
- 17.2.3.4. Recent Developments
- 17.2.3.5. Financials (Based on Availability)
- 17.2.4 eSUB Inc
- 17.2.4.1. Overview
- 17.2.4.2. Products
- 17.2.4.3. SWOT Analysis
- 17.2.4.4. Recent Developments
- 17.2.4.5. Financials (Based on Availability)
- 17.2.5 NVIDIA Corporation
- 17.2.5.1. Overview
- 17.2.5.2. Products
- 17.2.5.3. SWOT Analysis
- 17.2.5.4. Recent Developments
- 17.2.5.5. Financials (Based on Availability)
- 17.2.6 Alice Technologies Inc
- 17.2.6.1. Overview
- 17.2.6.2. Products
- 17.2.6.3. SWOT Analysis
- 17.2.6.4. Recent Developments
- 17.2.6.5. Financials (Based on Availability)
- 17.2.7 Microsoft Corporation
- 17.2.7.1. Overview
- 17.2.7.2. Products
- 17.2.7.3. SWOT Analysis
- 17.2.7.4. Recent Developments
- 17.2.7.5. Financials (Based on Availability)
- 17.2.8 Building System Planning Inc
- 17.2.8.1. Overview
- 17.2.8.2. Products
- 17.2.8.3. SWOT Analysis
- 17.2.8.4. Recent Developments
- 17.2.8.5. Financials (Based on Availability)
- 17.2.9 Dassault Systems SE
- 17.2.9.1. Overview
- 17.2.9.2. Products
- 17.2.9.3. SWOT Analysis
- 17.2.9.4. Recent Developments
- 17.2.9.5. Financials (Based on Availability)
- 17.2.10 PTC Inc
- 17.2.10.1. Overview
- 17.2.10.2. Products
- 17.2.10.3. SWOT Analysis
- 17.2.10.4. Recent Developments
- 17.2.10.5. Financials (Based on Availability)
- 17.2.11 Autodesk Inc
- 17.2.11.1. Overview
- 17.2.11.2. Products
- 17.2.11.3. SWOT Analysis
- 17.2.11.4. Recent Developments
- 17.2.11.5. Financials (Based on Availability)
- 17.2.12 Oracle Corporation
- 17.2.12.1. Overview
- 17.2.12.2. Products
- 17.2.12.3. SWOT Analysis
- 17.2.12.4. Recent Developments
- 17.2.12.5. Financials (Based on Availability)
- 17.2.13 Bentley Systems Inc
- 17.2.13.1. Overview
- 17.2.13.2. Products
- 17.2.13.3. SWOT Analysis
- 17.2.13.4. Recent Developments
- 17.2.13.5. Financials (Based on Availability)
- 17.2.14 Doxel Inc
- 17.2.14.1. Overview
- 17.2.14.2. Products
- 17.2.14.3. SWOT Analysis
- 17.2.14.4. Recent Developments
- 17.2.14.5. Financials (Based on Availability)
- 17.2.1 Smartvid io Inc
List of Figures
- Figure 1: Global Machine Learning Construction Industry Revenue Breakdown (Million, %) by Region 2024 & 2032
- Figure 2: Global Machine Learning Construction Industry Volume Breakdown (K Unit, %) by Region 2024 & 2032
- Figure 3: North America Machine Learning Construction Industry Revenue (Million), by Country 2024 & 2032
- Figure 4: North America Machine Learning Construction Industry Volume (K Unit), by Country 2024 & 2032
- Figure 5: North America Machine Learning Construction Industry Revenue Share (%), by Country 2024 & 2032
- Figure 6: North America Machine Learning Construction Industry Volume Share (%), by Country 2024 & 2032
- Figure 7: Europe Machine Learning Construction Industry Revenue (Million), by Country 2024 & 2032
- Figure 8: Europe Machine Learning Construction Industry Volume (K Unit), by Country 2024 & 2032
- Figure 9: Europe Machine Learning Construction Industry Revenue Share (%), by Country 2024 & 2032
- Figure 10: Europe Machine Learning Construction Industry Volume Share (%), by Country 2024 & 2032
- Figure 11: Asia Pacific Machine Learning Construction Industry Revenue (Million), by Country 2024 & 2032
- Figure 12: Asia Pacific Machine Learning Construction Industry Volume (K Unit), by Country 2024 & 2032
- Figure 13: Asia Pacific Machine Learning Construction Industry Revenue Share (%), by Country 2024 & 2032
- Figure 14: Asia Pacific Machine Learning Construction Industry Volume Share (%), by Country 2024 & 2032
- Figure 15: South America Machine Learning Construction Industry Revenue (Million), by Country 2024 & 2032
- Figure 16: South America Machine Learning Construction Industry Volume (K Unit), by Country 2024 & 2032
- Figure 17: South America Machine Learning Construction Industry Revenue Share (%), by Country 2024 & 2032
- Figure 18: South America Machine Learning Construction Industry Volume Share (%), by Country 2024 & 2032
- Figure 19: North America Machine Learning Construction Industry Revenue (Million), by Country 2024 & 2032
- Figure 20: North America Machine Learning Construction Industry Volume (K Unit), by Country 2024 & 2032
- Figure 21: North America Machine Learning Construction Industry Revenue Share (%), by Country 2024 & 2032
- Figure 22: North America Machine Learning Construction Industry Volume Share (%), by Country 2024 & 2032
- Figure 23: MEA Machine Learning Construction Industry Revenue (Million), by Country 2024 & 2032
- Figure 24: MEA Machine Learning Construction Industry Volume (K Unit), by Country 2024 & 2032
- Figure 25: MEA Machine Learning Construction Industry Revenue Share (%), by Country 2024 & 2032
- Figure 26: MEA Machine Learning Construction Industry Volume Share (%), by Country 2024 & 2032
- Figure 27: North America Machine Learning Construction Industry Revenue (Million), by Application 2024 & 2032
- Figure 28: North America Machine Learning Construction Industry Volume (K Unit), by Application 2024 & 2032
- Figure 29: North America Machine Learning Construction Industry Revenue Share (%), by Application 2024 & 2032
- Figure 30: North America Machine Learning Construction Industry Volume Share (%), by Application 2024 & 2032
- Figure 31: North America Machine Learning Construction Industry Revenue (Million), by Country 2024 & 2032
- Figure 32: North America Machine Learning Construction Industry Volume (K Unit), by Country 2024 & 2032
- Figure 33: North America Machine Learning Construction Industry Revenue Share (%), by Country 2024 & 2032
- Figure 34: North America Machine Learning Construction Industry Volume Share (%), by Country 2024 & 2032
- Figure 35: Europe Machine Learning Construction Industry Revenue (Million), by Application 2024 & 2032
- Figure 36: Europe Machine Learning Construction Industry Volume (K Unit), by Application 2024 & 2032
- Figure 37: Europe Machine Learning Construction Industry Revenue Share (%), by Application 2024 & 2032
- Figure 38: Europe Machine Learning Construction Industry Volume Share (%), by Application 2024 & 2032
- Figure 39: Europe Machine Learning Construction Industry Revenue (Million), by Country 2024 & 2032
- Figure 40: Europe Machine Learning Construction Industry Volume (K Unit), by Country 2024 & 2032
- Figure 41: Europe Machine Learning Construction Industry Revenue Share (%), by Country 2024 & 2032
- Figure 42: Europe Machine Learning Construction Industry Volume Share (%), by Country 2024 & 2032
- Figure 43: Asia Machine Learning Construction Industry Revenue (Million), by Application 2024 & 2032
- Figure 44: Asia Machine Learning Construction Industry Volume (K Unit), by Application 2024 & 2032
- Figure 45: Asia Machine Learning Construction Industry Revenue Share (%), by Application 2024 & 2032
- Figure 46: Asia Machine Learning Construction Industry Volume Share (%), by Application 2024 & 2032
- Figure 47: Asia Machine Learning Construction Industry Revenue (Million), by Country 2024 & 2032
- Figure 48: Asia Machine Learning Construction Industry Volume (K Unit), by Country 2024 & 2032
- Figure 49: Asia Machine Learning Construction Industry Revenue Share (%), by Country 2024 & 2032
- Figure 50: Asia Machine Learning Construction Industry Volume Share (%), by Country 2024 & 2032
- Figure 51: Australia and New Zealand Machine Learning Construction Industry Revenue (Million), by Application 2024 & 2032
- Figure 52: Australia and New Zealand Machine Learning Construction Industry Volume (K Unit), by Application 2024 & 2032
- Figure 53: Australia and New Zealand Machine Learning Construction Industry Revenue Share (%), by Application 2024 & 2032
- Figure 54: Australia and New Zealand Machine Learning Construction Industry Volume Share (%), by Application 2024 & 2032
- Figure 55: Australia and New Zealand Machine Learning Construction Industry Revenue (Million), by Country 2024 & 2032
- Figure 56: Australia and New Zealand Machine Learning Construction Industry Volume (K Unit), by Country 2024 & 2032
- Figure 57: Australia and New Zealand Machine Learning Construction Industry Revenue Share (%), by Country 2024 & 2032
- Figure 58: Australia and New Zealand Machine Learning Construction Industry Volume Share (%), by Country 2024 & 2032
- Figure 59: Latin America Machine Learning Construction Industry Revenue (Million), by Application 2024 & 2032
- Figure 60: Latin America Machine Learning Construction Industry Volume (K Unit), by Application 2024 & 2032
- Figure 61: Latin America Machine Learning Construction Industry Revenue Share (%), by Application 2024 & 2032
- Figure 62: Latin America Machine Learning Construction Industry Volume Share (%), by Application 2024 & 2032
- Figure 63: Latin America Machine Learning Construction Industry Revenue (Million), by Country 2024 & 2032
- Figure 64: Latin America Machine Learning Construction Industry Volume (K Unit), by Country 2024 & 2032
- Figure 65: Latin America Machine Learning Construction Industry Revenue Share (%), by Country 2024 & 2032
- Figure 66: Latin America Machine Learning Construction Industry Volume Share (%), by Country 2024 & 2032
List of Tables
- Table 1: Global Machine Learning Construction Industry Revenue Million Forecast, by Region 2019 & 2032
- Table 2: Global Machine Learning Construction Industry Volume K Unit Forecast, by Region 2019 & 2032
- Table 3: Global Machine Learning Construction Industry Revenue Million Forecast, by Application 2019 & 2032
- Table 4: Global Machine Learning Construction Industry Volume K Unit Forecast, by Application 2019 & 2032
- Table 5: Global Machine Learning Construction Industry Revenue Million Forecast, by Region 2019 & 2032
- Table 6: Global Machine Learning Construction Industry Volume K Unit Forecast, by Region 2019 & 2032
- Table 7: Global Machine Learning Construction Industry Revenue Million Forecast, by Country 2019 & 2032
- Table 8: Global Machine Learning Construction Industry Volume K Unit Forecast, by Country 2019 & 2032
- Table 9: United States Machine Learning Construction Industry Revenue (Million) Forecast, by Application 2019 & 2032
- Table 10: United States Machine Learning Construction Industry Volume (K Unit) Forecast, by Application 2019 & 2032
- Table 11: Canada Machine Learning Construction Industry Revenue (Million) Forecast, by Application 2019 & 2032
- Table 12: Canada Machine Learning Construction Industry Volume (K Unit) Forecast, by Application 2019 & 2032
- Table 13: Mexico Machine Learning Construction Industry Revenue (Million) Forecast, by Application 2019 & 2032
- Table 14: Mexico Machine Learning Construction Industry Volume (K Unit) Forecast, by Application 2019 & 2032
- Table 15: Global Machine Learning Construction Industry Revenue Million Forecast, by Country 2019 & 2032
- Table 16: Global Machine Learning Construction Industry Volume K Unit Forecast, by Country 2019 & 2032
- Table 17: Germany Machine Learning Construction Industry Revenue (Million) Forecast, by Application 2019 & 2032
- Table 18: Germany Machine Learning Construction Industry Volume (K Unit) Forecast, by Application 2019 & 2032
- Table 19: United Kingdom Machine Learning Construction Industry Revenue (Million) Forecast, by Application 2019 & 2032
- Table 20: United Kingdom Machine Learning Construction Industry Volume (K Unit) Forecast, by Application 2019 & 2032
- Table 21: France Machine Learning Construction Industry Revenue (Million) Forecast, by Application 2019 & 2032
- Table 22: France Machine Learning Construction Industry Volume (K Unit) Forecast, by Application 2019 & 2032
- Table 23: Spain Machine Learning Construction Industry Revenue (Million) Forecast, by Application 2019 & 2032
- Table 24: Spain Machine Learning Construction Industry Volume (K Unit) Forecast, by Application 2019 & 2032
- Table 25: Italy Machine Learning Construction Industry Revenue (Million) Forecast, by Application 2019 & 2032
- Table 26: Italy Machine Learning Construction Industry Volume (K Unit) Forecast, by Application 2019 & 2032
- Table 27: Spain Machine Learning Construction Industry Revenue (Million) Forecast, by Application 2019 & 2032
- Table 28: Spain Machine Learning Construction Industry Volume (K Unit) Forecast, by Application 2019 & 2032
- Table 29: Belgium Machine Learning Construction Industry Revenue (Million) Forecast, by Application 2019 & 2032
- Table 30: Belgium Machine Learning Construction Industry Volume (K Unit) Forecast, by Application 2019 & 2032
- Table 31: Netherland Machine Learning Construction Industry Revenue (Million) Forecast, by Application 2019 & 2032
- Table 32: Netherland Machine Learning Construction Industry Volume (K Unit) Forecast, by Application 2019 & 2032
- Table 33: Nordics Machine Learning Construction Industry Revenue (Million) Forecast, by Application 2019 & 2032
- Table 34: Nordics Machine Learning Construction Industry Volume (K Unit) Forecast, by Application 2019 & 2032
- Table 35: Rest of Europe Machine Learning Construction Industry Revenue (Million) Forecast, by Application 2019 & 2032
- Table 36: Rest of Europe Machine Learning Construction Industry Volume (K Unit) Forecast, by Application 2019 & 2032
- Table 37: Global Machine Learning Construction Industry Revenue Million Forecast, by Country 2019 & 2032
- Table 38: Global Machine Learning Construction Industry Volume K Unit Forecast, by Country 2019 & 2032
- Table 39: China Machine Learning Construction Industry Revenue (Million) Forecast, by Application 2019 & 2032
- Table 40: China Machine Learning Construction Industry Volume (K Unit) Forecast, by Application 2019 & 2032
- Table 41: Japan Machine Learning Construction Industry Revenue (Million) Forecast, by Application 2019 & 2032
- Table 42: Japan Machine Learning Construction Industry Volume (K Unit) Forecast, by Application 2019 & 2032
- Table 43: India Machine Learning Construction Industry Revenue (Million) Forecast, by Application 2019 & 2032
- Table 44: India Machine Learning Construction Industry Volume (K Unit) Forecast, by Application 2019 & 2032
- Table 45: South Korea Machine Learning Construction Industry Revenue (Million) Forecast, by Application 2019 & 2032
- Table 46: South Korea Machine Learning Construction Industry Volume (K Unit) Forecast, by Application 2019 & 2032
- Table 47: Southeast Asia Machine Learning Construction Industry Revenue (Million) Forecast, by Application 2019 & 2032
- Table 48: Southeast Asia Machine Learning Construction Industry Volume (K Unit) Forecast, by Application 2019 & 2032
- Table 49: Australia Machine Learning Construction Industry Revenue (Million) Forecast, by Application 2019 & 2032
- Table 50: Australia Machine Learning Construction Industry Volume (K Unit) Forecast, by Application 2019 & 2032
- Table 51: Indonesia Machine Learning Construction Industry Revenue (Million) Forecast, by Application 2019 & 2032
- Table 52: Indonesia Machine Learning Construction Industry Volume (K Unit) Forecast, by Application 2019 & 2032
- Table 53: Phillipes Machine Learning Construction Industry Revenue (Million) Forecast, by Application 2019 & 2032
- Table 54: Phillipes Machine Learning Construction Industry Volume (K Unit) Forecast, by Application 2019 & 2032
- Table 55: Singapore Machine Learning Construction Industry Revenue (Million) Forecast, by Application 2019 & 2032
- Table 56: Singapore Machine Learning Construction Industry Volume (K Unit) Forecast, by Application 2019 & 2032
- Table 57: Thailandc Machine Learning Construction Industry Revenue (Million) Forecast, by Application 2019 & 2032
- Table 58: Thailandc Machine Learning Construction Industry Volume (K Unit) Forecast, by Application 2019 & 2032
- Table 59: Rest of Asia Pacific Machine Learning Construction Industry Revenue (Million) Forecast, by Application 2019 & 2032
- Table 60: Rest of Asia Pacific Machine Learning Construction Industry Volume (K Unit) Forecast, by Application 2019 & 2032
- Table 61: Global Machine Learning Construction Industry Revenue Million Forecast, by Country 2019 & 2032
- Table 62: Global Machine Learning Construction Industry Volume K Unit Forecast, by Country 2019 & 2032
- Table 63: Brazil Machine Learning Construction Industry Revenue (Million) Forecast, by Application 2019 & 2032
- Table 64: Brazil Machine Learning Construction Industry Volume (K Unit) Forecast, by Application 2019 & 2032
- Table 65: Argentina Machine Learning Construction Industry Revenue (Million) Forecast, by Application 2019 & 2032
- Table 66: Argentina Machine Learning Construction Industry Volume (K Unit) Forecast, by Application 2019 & 2032
- Table 67: Peru Machine Learning Construction Industry Revenue (Million) Forecast, by Application 2019 & 2032
- Table 68: Peru Machine Learning Construction Industry Volume (K Unit) Forecast, by Application 2019 & 2032
- Table 69: Chile Machine Learning Construction Industry Revenue (Million) Forecast, by Application 2019 & 2032
- Table 70: Chile Machine Learning Construction Industry Volume (K Unit) Forecast, by Application 2019 & 2032
- Table 71: Colombia Machine Learning Construction Industry Revenue (Million) Forecast, by Application 2019 & 2032
- Table 72: Colombia Machine Learning Construction Industry Volume (K Unit) Forecast, by Application 2019 & 2032
- Table 73: Ecuador Machine Learning Construction Industry Revenue (Million) Forecast, by Application 2019 & 2032
- Table 74: Ecuador Machine Learning Construction Industry Volume (K Unit) Forecast, by Application 2019 & 2032
- Table 75: Venezuela Machine Learning Construction Industry Revenue (Million) Forecast, by Application 2019 & 2032
- Table 76: Venezuela Machine Learning Construction Industry Volume (K Unit) Forecast, by Application 2019 & 2032
- Table 77: Rest of South America Machine Learning Construction Industry Revenue (Million) Forecast, by Application 2019 & 2032
- Table 78: Rest of South America Machine Learning Construction Industry Volume (K Unit) Forecast, by Application 2019 & 2032
- Table 79: Global Machine Learning Construction Industry Revenue Million Forecast, by Country 2019 & 2032
- Table 80: Global Machine Learning Construction Industry Volume K Unit Forecast, by Country 2019 & 2032
- Table 81: United States Machine Learning Construction Industry Revenue (Million) Forecast, by Application 2019 & 2032
- Table 82: United States Machine Learning Construction Industry Volume (K Unit) Forecast, by Application 2019 & 2032
- Table 83: Canada Machine Learning Construction Industry Revenue (Million) Forecast, by Application 2019 & 2032
- Table 84: Canada Machine Learning Construction Industry Volume (K Unit) Forecast, by Application 2019 & 2032
- Table 85: Mexico Machine Learning Construction Industry Revenue (Million) Forecast, by Application 2019 & 2032
- Table 86: Mexico Machine Learning Construction Industry Volume (K Unit) Forecast, by Application 2019 & 2032
- Table 87: Global Machine Learning Construction Industry Revenue Million Forecast, by Country 2019 & 2032
- Table 88: Global Machine Learning Construction Industry Volume K Unit Forecast, by Country 2019 & 2032
- Table 89: United Arab Emirates Machine Learning Construction Industry Revenue (Million) Forecast, by Application 2019 & 2032
- Table 90: United Arab Emirates Machine Learning Construction Industry Volume (K Unit) Forecast, by Application 2019 & 2032
- Table 91: Saudi Arabia Machine Learning Construction Industry Revenue (Million) Forecast, by Application 2019 & 2032
- Table 92: Saudi Arabia Machine Learning Construction Industry Volume (K Unit) Forecast, by Application 2019 & 2032
- Table 93: South Africa Machine Learning Construction Industry Revenue (Million) Forecast, by Application 2019 & 2032
- Table 94: South Africa Machine Learning Construction Industry Volume (K Unit) Forecast, by Application 2019 & 2032
- Table 95: Rest of Middle East and Africa Machine Learning Construction Industry Revenue (Million) Forecast, by Application 2019 & 2032
- Table 96: Rest of Middle East and Africa Machine Learning Construction Industry Volume (K Unit) Forecast, by Application 2019 & 2032
- Table 97: Global Machine Learning Construction Industry Revenue Million Forecast, by Application 2019 & 2032
- Table 98: Global Machine Learning Construction Industry Volume K Unit Forecast, by Application 2019 & 2032
- Table 99: Global Machine Learning Construction Industry Revenue Million Forecast, by Country 2019 & 2032
- Table 100: Global Machine Learning Construction Industry Volume K Unit Forecast, by Country 2019 & 2032
- Table 101: Global Machine Learning Construction Industry Revenue Million Forecast, by Application 2019 & 2032
- Table 102: Global Machine Learning Construction Industry Volume K Unit Forecast, by Application 2019 & 2032
- Table 103: Global Machine Learning Construction Industry Revenue Million Forecast, by Country 2019 & 2032
- Table 104: Global Machine Learning Construction Industry Volume K Unit Forecast, by Country 2019 & 2032
- Table 105: Global Machine Learning Construction Industry Revenue Million Forecast, by Application 2019 & 2032
- Table 106: Global Machine Learning Construction Industry Volume K Unit Forecast, by Application 2019 & 2032
- Table 107: Global Machine Learning Construction Industry Revenue Million Forecast, by Country 2019 & 2032
- Table 108: Global Machine Learning Construction Industry Volume K Unit Forecast, by Country 2019 & 2032
- Table 109: Global Machine Learning Construction Industry Revenue Million Forecast, by Application 2019 & 2032
- Table 110: Global Machine Learning Construction Industry Volume K Unit Forecast, by Application 2019 & 2032
- Table 111: Global Machine Learning Construction Industry Revenue Million Forecast, by Country 2019 & 2032
- Table 112: Global Machine Learning Construction Industry Volume K Unit Forecast, by Country 2019 & 2032
- Table 113: Global Machine Learning Construction Industry Revenue Million Forecast, by Application 2019 & 2032
- Table 114: Global Machine Learning Construction Industry Volume K Unit Forecast, by Application 2019 & 2032
- Table 115: Global Machine Learning Construction Industry Revenue Million Forecast, by Country 2019 & 2032
- Table 116: Global Machine Learning Construction Industry Volume K Unit Forecast, by Country 2019 & 2032
Frequently Asked Questions
1. What is the projected Compound Annual Growth Rate (CAGR) of the Machine Learning Construction Industry?
The projected CAGR is approximately 24.31%.
2. Which companies are prominent players in the Machine Learning Construction Industry?
Key companies in the market include Smartvid io Inc, Lurtis Rules S L, IBM Corporation, eSUB Inc , NVIDIA Corporation, Alice Technologies Inc, Microsoft Corporation, Building System Planning Inc, Dassault Systems SE, PTC Inc, Autodesk Inc, Oracle Corporation, Bentley Systems Inc, Doxel Inc.
3. What are the main segments of the Machine Learning Construction Industry?
The market segments include Application.
4. Can you provide details about the market size?
The market size is estimated to be USD 3.99 Million as of 2022.
5. What are some drivers contributing to market growth?
Increasing Need to Reduce Production Costs; Demand for More Safety Measures at Construction Sites.
6. What are the notable trends driving market growth?
Planning and Design Application Segment is Expected to Hold Significant Market Share.
7. Are there any restraints impacting market growth?
Cost and Implementation Issues.
8. Can you provide examples of recent developments in the market?
November 2022: Disperse.io, a UK-based construction technology company with a platform that used AI to help project managers track work, capture data from building sites, and make better project decisions, launched a new product, Impulse, that highlights issues gleaned from 360° site scans captured in its platform. This solution integrated performance insights into building elevations and presents problems to project managers.
9. What pricing options are available for accessing the report?
Pricing options include single-user, multi-user, and enterprise licenses priced at USD 4750, USD 5250, and USD 8750 respectively.
10. Is the market size provided in terms of value or volume?
The market size is provided in terms of value, measured in Million and volume, measured in K Unit.
11. Are there any specific market keywords associated with the report?
Yes, the market keyword associated with the report is "Machine Learning Construction Industry," which aids in identifying and referencing the specific market segment covered.
12. How do I determine which pricing option suits my needs best?
The pricing options vary based on user requirements and access needs. Individual users may opt for single-user licenses, while businesses requiring broader access may choose multi-user or enterprise licenses for cost-effective access to the report.
13. Are there any additional resources or data provided in the Machine Learning Construction Industry report?
While the report offers comprehensive insights, it's advisable to review the specific contents or supplementary materials provided to ascertain if additional resources or data are available.
14. How can I stay updated on further developments or reports in the Machine Learning Construction Industry?
To stay informed about further developments, trends, and reports in the Machine Learning Construction Industry, consider subscribing to industry newsletters, following relevant companies and organizations, or regularly checking reputable industry news sources and publications.
Methodology
Step 1 - Identification of Relevant Samples Size from Population Database


Step 2 - Approaches for Defining Global Market Size (Value, Volume* & Price*)

Note*: In applicable scenarios
Step 3 - Data Sources
Primary Research
- Web Analytics
- Survey Reports
- Research Institute
- Latest Research Reports
- Opinion Leaders
Secondary Research
- Annual Reports
- White Paper
- Latest Press Release
- Industry Association
- Paid Database
- Investor Presentations

Step 4 - Data Triangulation
Involves using different sources of information in order to increase the validity of a study
These sources are likely to be stakeholders in a program - participants, other researchers, program staff, other community members, and so on.
Then we put all data in single framework & apply various statistical tools to find out the dynamic on the market.
During the analysis stage, feedback from the stakeholder groups would be compared to determine areas of agreement as well as areas of divergence


