
Key Insights
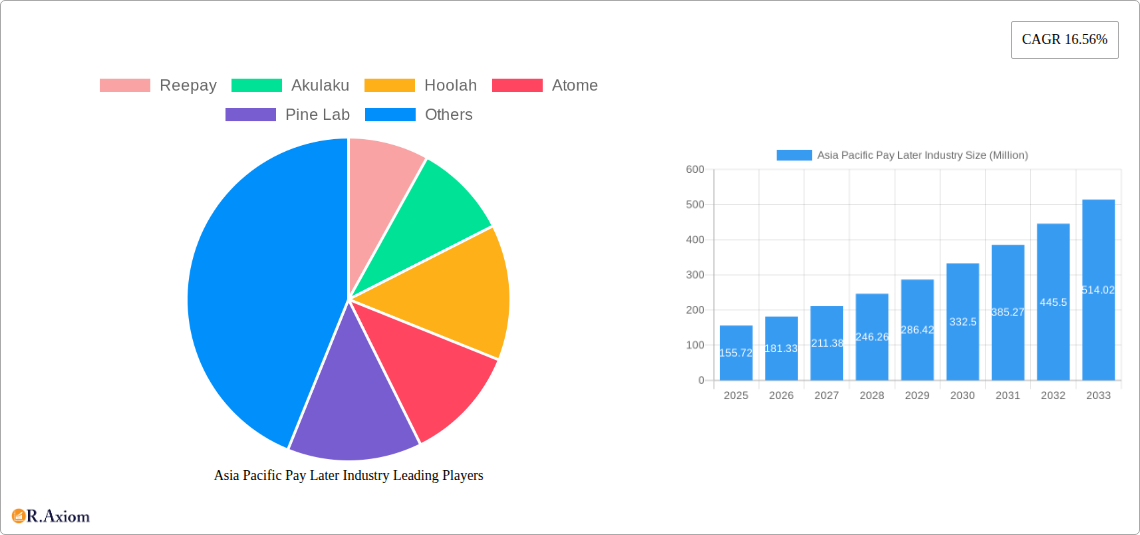
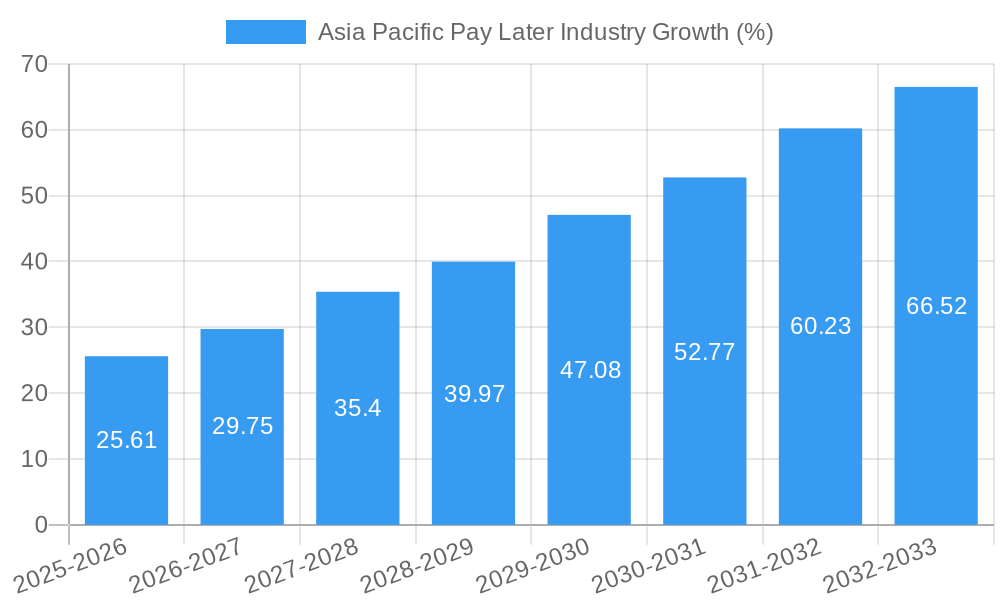
The Asia Pacific Buy Now, Pay Later (BNPL) market is experiencing explosive growth, projected to reach $155.72 million in 2025 and exhibiting a Compound Annual Growth Rate (CAGR) of 16.56% from 2019 to 2033. This surge is driven by several factors. Increasing smartphone penetration and internet access across the region, particularly in developing economies, are fueling the adoption of digital payment methods, with BNPL emerging as a highly attractive option. Consumers, particularly younger demographics, are drawn to the convenience and flexibility offered by BNPL services, enabling them to manage their spending and access goods and services they might otherwise be unable to afford immediately. Furthermore, the rise of e-commerce and the growing preference for online shopping are significantly boosting the demand for seamless and accessible payment solutions like BNPL. A robust ecosystem of fintech companies, including established players like Reepay and Akulaku, and newer entrants such as Atome and Hoolah, is further driving market expansion by offering diverse product offerings and competitive pricing.
However, the market also faces certain challenges. Regulatory scrutiny concerning consumer protection and responsible lending practices is intensifying, leading to a more cautious and regulated environment. The potential for increased consumer debt and financial instability due to irresponsible BNPL usage is another critical restraint. Furthermore, competition among BNPL providers is fierce, necessitating continuous innovation and strategic partnerships to maintain market share. Despite these challenges, the overall market outlook remains highly positive, fueled by strong consumer demand, technological advancements, and the ongoing expansion of e-commerce across the Asia Pacific region. The long-term forecast predicts sustained growth, driven by increasing financial inclusion and the further integration of BNPL into existing online and offline retail ecosystems.
This comprehensive report provides a detailed analysis of the Asia Pacific Pay Later industry, covering market size, growth drivers, key players, and future trends. The study period spans from 2019 to 2033, with a base year of 2025 and a forecast period of 2025-2033. This report is essential for industry stakeholders, investors, and businesses seeking to understand and capitalize on the opportunities within this rapidly evolving market. The total market value in 2025 is estimated at xx Million.
Asia Pacific Pay Later Industry Market Concentration & Innovation
The Asia Pacific Pay Later market demonstrates a moderately concentrated landscape with several major players vying for market share. While precise market share figures for individual companies are proprietary information and vary constantly, Atome, Hoolah, and Akulaku are recognized as significant players commanding substantial market share. Reepay, Pine Lab, Zest Money BNPL, Openpay (Australia), Rely (Singapore), Limepay (Australia), and PayRight (Australia) also contribute significantly, though their exact market share remains a dynamic element within the competitive landscape. This report will delve into market share analysis with the latest available data.
Innovation is a key driver, spurred by the need to offer differentiated services and cater to diverse consumer preferences across the region's diverse markets. Key innovations include integration with e-commerce platforms, personalized credit scoring models, and the development of robust fraud prevention mechanisms. Regulatory frameworks vary across countries, creating both opportunities and challenges. Substitutes include traditional credit cards and personal loans, though BNPL solutions often offer greater convenience and accessibility, particularly for younger demographics.
Mergers and acquisitions (M&A) activity has been significant, driven by the need for expansion, technological integration, and enhanced market reach. While specific deal values are commercially sensitive, several key acquisitions have contributed to market consolidation in recent years. The report will include an analysis of significant M&A activities and their impact on market concentration. End-user trends reveal a growing preference for flexible payment options, particularly among younger consumers and those seeking greater financial control.
Asia Pacific Pay Later Industry Industry Trends & Insights
The Asia Pacific Pay Later industry is experiencing remarkable growth, driven by the increasing adoption of e-commerce, rising disposable incomes, and the preference for convenient and flexible payment options. The Compound Annual Growth Rate (CAGR) from 2025 to 2033 is projected at xx%, resulting in a market size of xx Million by 2033. Market penetration remains relatively high in developed economies but shows significant potential for expansion in emerging markets.
Technological disruptions, particularly advancements in fintech and mobile payments, are accelerating industry growth. Consumer preferences are shifting towards personalized offerings, seamless integration with existing financial apps, and enhanced security features. Competitive dynamics are intense, characterized by both collaboration and fierce competition among existing and new entrants. The market is increasingly witnessing the rise of specialized BNPL solutions tailored to specific industries or consumer segments.
Dominant Markets & Segments in Asia Pacific Pay Later Industry
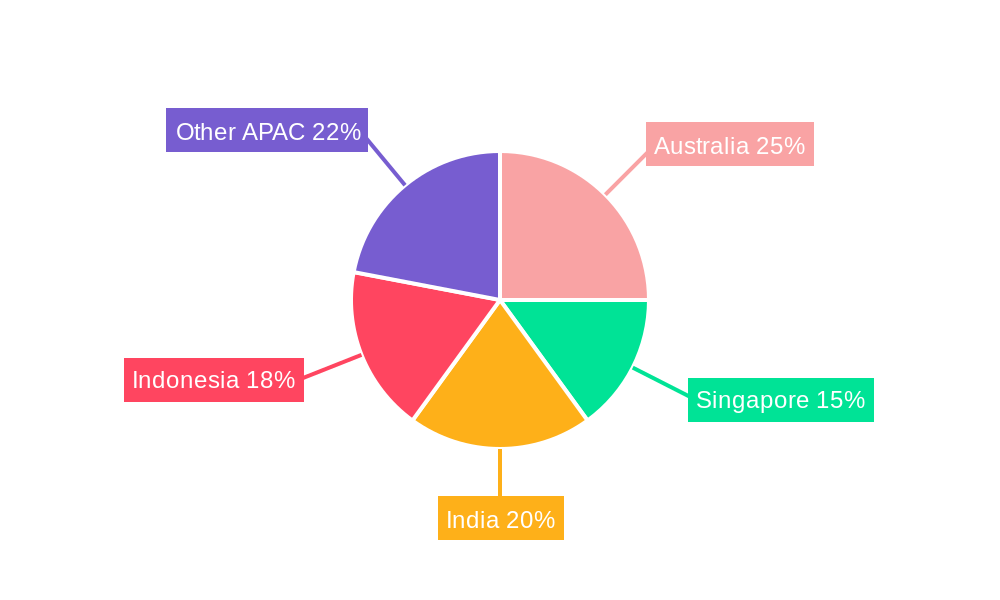
While the entire Asia Pacific region presents substantial growth potential, specific countries demonstrate more pronounced market dominance. India and China, propelled by their vast populations and rapidly growing e-commerce sectors, are leading markets. Australia and Singapore, with their advanced fintech ecosystems and high digital literacy rates, also exhibit robust adoption rates.
Key Drivers for Dominant Markets:
- India: Rising smartphone penetration, growing e-commerce sector, and a large young population driving demand for convenient payment options.
- China: Mature e-commerce infrastructure, expanding digital payments adoption, and government initiatives promoting digital finance.
- Australia: Well-established fintech infrastructure, high consumer trust in online transactions, and supportive regulatory environment.
- Singapore: Strong government support for innovation, high digital literacy, and a sophisticated financial ecosystem.
Dominance is further segmented by consumer demographics (age, income), product type (point-of-sale financing, online financing), and industry verticals (e-commerce, travel, healthcare). This report presents a comprehensive analysis of these market segments and their respective growth trajectories.
Asia Pacific Pay Later Industry Product Developments
Recent innovations in the Asia Pacific Pay Later industry center on enhancing user experience, improving risk management, and expanding product offerings. The integration of AI and machine learning algorithms for enhanced credit scoring and fraud detection is particularly notable. Several players are offering integrated payment solutions, combining BNPL with other financial services such as rewards programs and budgeting tools. This trend is driven by a focus on increasing customer engagement and loyalty. The market fit for these advanced solutions is exceptionally high given the increased consumer demand for more sophisticated financial products.
Report Scope & Segmentation Analysis
This report segments the Asia Pacific Pay Later market based on several criteria, offering a granular view of the market landscape. These include:
By Country: India, China, Australia, Singapore, Indonesia, and other key markets across the Asia Pacific region. Each country's unique market dynamics are analysed including market size projections and competitive landscape.
By Product Type: This covers the various models of BNPL including point-of-sale financing, online financing, and other variations. Growth projections are provided for each type, highlighting their respective market share and growth potential.
By Consumer Segment: This segmentation considers various demographics such as age, income levels and lifestyle preferences.
By Industry Vertical: This analyzes the usage of BNPL solutions across different industries. This includes growth projections, market sizes, and competitive analyses for each vertical. The competitive landscape is analyzed for each segment, considering key players, their market strategies, and their overall competitiveness.
Key Drivers of Asia Pacific Pay Later Industry Growth
Several factors contribute to the robust growth of the Asia Pacific Pay Later industry:
Rising E-commerce Adoption: The rapid expansion of online shopping across the region fuels demand for flexible payment options.
Increasing Smartphone Penetration: Widespread smartphone ownership enables seamless access to BNPL services.
Growing Middle Class: Expanding middle classes in several countries provide a broader customer base.
Government Support for Fintech: Supportive regulatory frameworks in several countries encourage innovation and investment.
Technological Advancements: AI and machine learning drive efficiency in risk assessment and customer service.
Challenges in the Asia Pacific Pay Later Industry Sector
The industry faces various challenges:
Regulatory Uncertainty: Inconsistent regulations across different countries create hurdles for expansion and standardization. This uncertainty can lead to increased compliance costs and operational complexities.
Credit Risk Management: The inherent risk of defaults requires robust credit assessment and fraud prevention mechanisms. The financial risk associated with loan defaults represents a significant obstacle to achieving profitability and sustainable growth.
Competition: Intense competition among established players and new entrants requires constant innovation and differentiation.
Emerging Opportunities in Asia Pacific Pay Later Industry
Several emerging opportunities are shaping the industry's future:
Expansion into Underserved Markets: Reaching rural populations and those with limited access to traditional credit presents significant potential.
Integration with other Financial Services: Combining BNPL with other offerings like budgeting tools and wealth management tools improves customer engagement.
Development of Specialized BNPL Solutions: Tailoring products to specific industries or consumer needs creates niche markets.
Leading Players in the Asia Pacific Pay Later Industry Market
- Reepay
- Akulaku
- Hoolah
- Atome
- Pine Lab
- Zest Money BNPL
- Openpay (Australia)
- Rely (Singapore)
- Limepay (Australia)
- PayRight (Australia)
- List Not Exhaustive
Key Developments in Asia Pacific Pay Later Industry Industry
June 2022: Kuaishou launched Sesame Credit's BNPL service in China, allowing users to try products before paying. This significantly impacted the market by introducing a novel approach to risk mitigation and improving customer experience.
February 2023: CRED launched its BNPL service in India, expanding its reach and further stimulating market competition. This development widened the scope of BNPL usage beyond e-commerce into diverse service sectors.
Strategic Outlook for Asia Pacific Pay Later Industry Market
The Asia Pacific Pay Later industry is poised for continued strong growth, driven by favorable demographics, technological advancements, and supportive government policies. Future opportunities lie in expanding into less-penetrated markets, enhancing product personalization, and leveraging innovative technologies like embedded finance to further integrate BNPL into broader financial ecosystems. The market is expected to witness further consolidation through mergers and acquisitions, leading to a more streamlined and efficient industry landscape. The focus will remain on innovation and the implementation of robust risk management strategies to ensure the long-term sustainability and growth of the sector.
Asia Pacific Pay Later Industry Segmentation
-
1. Channel
- 1.1. Online
- 1.2. POS
-
2. Enterprise
- 2.1. Large Enterprises
- 2.2. Small & Medium Enterprises
- 2.3. Others
-
3. End User
- 3.1. Consmer electronics
- 3.2. Fashion & garments
- 3.3. Healthcare
- 3.4. Leisure & entertainment
- 3.5. Retail
- 3.6. Others
Asia Pacific Pay Later Industry Segmentation By Geography
-
1. Asia Pacific
- 1.1. China
- 1.2. Japan
- 1.3. South Korea
- 1.4. India
- 1.5. Australia
- 1.6. New Zealand
- 1.7. Indonesia
- 1.8. Malaysia
- 1.9. Singapore
- 1.10. Thailand
- 1.11. Vietnam
- 1.12. Philippines
Asia Pacific Pay Later Industry REPORT HIGHLIGHTS
| Aspects | Details |
|---|---|
| Study Period | 2019-2033 |
| Base Year | 2024 |
| Estimated Year | 2025 |
| Forecast Period | 2025-2033 |
| Historical Period | 2019-2024 |
| Growth Rate | CAGR of 16.56% from 2019-2033 |
| Segmentation |
|
Table of Contents
- 1. Introduction
- 1.1. Research Scope
- 1.2. Market Segmentation
- 1.3. Research Methodology
- 1.4. Definitions and Assumptions
- 2. Executive Summary
- 2.1. Introduction
- 3. Market Dynamics
- 3.1. Introduction
- 3.2. Market Drivers
- 3.2.1. Lack Of Credit Availability In Small Transaction Driving BNPL Services; Rise In The Value Of Digital Transaction In Asia Pacific
- 3.3. Market Restrains
- 3.3.1. Lack Of Credit Availability In Small Transaction Driving BNPL Services; Rise In The Value Of Digital Transaction In Asia Pacific
- 3.4. Market Trends
- 3.4.1. Rising Digital Payments
- 4. Market Factor Analysis
- 4.1. Porters Five Forces
- 4.2. Supply/Value Chain
- 4.3. PESTEL analysis
- 4.4. Market Entropy
- 4.5. Patent/Trademark Analysis
- 5. Asia Pacific Pay Later Industry Analysis, Insights and Forecast, 2019-2031
- 5.1. Market Analysis, Insights and Forecast - by Channel
- 5.1.1. Online
- 5.1.2. POS
- 5.2. Market Analysis, Insights and Forecast - by Enterprise
- 5.2.1. Large Enterprises
- 5.2.2. Small & Medium Enterprises
- 5.2.3. Others
- 5.3. Market Analysis, Insights and Forecast - by End User
- 5.3.1. Consmer electronics
- 5.3.2. Fashion & garments
- 5.3.3. Healthcare
- 5.3.4. Leisure & entertainment
- 5.3.5. Retail
- 5.3.6. Others
- 5.4. Market Analysis, Insights and Forecast - by Region
- 5.4.1. Asia Pacific
- 5.1. Market Analysis, Insights and Forecast - by Channel
- 6. Competitive Analysis
- 6.1. Market Share Analysis 2024
- 6.2. Company Profiles
- 6.2.1 Reepay
- 6.2.1.1. Overview
- 6.2.1.2. Products
- 6.2.1.3. SWOT Analysis
- 6.2.1.4. Recent Developments
- 6.2.1.5. Financials (Based on Availability)
- 6.2.2 Akulaku
- 6.2.2.1. Overview
- 6.2.2.2. Products
- 6.2.2.3. SWOT Analysis
- 6.2.2.4. Recent Developments
- 6.2.2.5. Financials (Based on Availability)
- 6.2.3 Hoolah
- 6.2.3.1. Overview
- 6.2.3.2. Products
- 6.2.3.3. SWOT Analysis
- 6.2.3.4. Recent Developments
- 6.2.3.5. Financials (Based on Availability)
- 6.2.4 Atome
- 6.2.4.1. Overview
- 6.2.4.2. Products
- 6.2.4.3. SWOT Analysis
- 6.2.4.4. Recent Developments
- 6.2.4.5. Financials (Based on Availability)
- 6.2.5 Pine Lab
- 6.2.5.1. Overview
- 6.2.5.2. Products
- 6.2.5.3. SWOT Analysis
- 6.2.5.4. Recent Developments
- 6.2.5.5. Financials (Based on Availability)
- 6.2.6 Zest Money BNPL
- 6.2.6.1. Overview
- 6.2.6.2. Products
- 6.2.6.3. SWOT Analysis
- 6.2.6.4. Recent Developments
- 6.2.6.5. Financials (Based on Availability)
- 6.2.7 Openpay (Australia)
- 6.2.7.1. Overview
- 6.2.7.2. Products
- 6.2.7.3. SWOT Analysis
- 6.2.7.4. Recent Developments
- 6.2.7.5. Financials (Based on Availability)
- 6.2.8 Rely (Singapore)
- 6.2.8.1. Overview
- 6.2.8.2. Products
- 6.2.8.3. SWOT Analysis
- 6.2.8.4. Recent Developments
- 6.2.8.5. Financials (Based on Availability)
- 6.2.9 Limepay (Australia)
- 6.2.9.1. Overview
- 6.2.9.2. Products
- 6.2.9.3. SWOT Analysis
- 6.2.9.4. Recent Developments
- 6.2.9.5. Financials (Based on Availability)
- 6.2.10 PayRight (Australia)**List Not Exhaustive
- 6.2.10.1. Overview
- 6.2.10.2. Products
- 6.2.10.3. SWOT Analysis
- 6.2.10.4. Recent Developments
- 6.2.10.5. Financials (Based on Availability)
- 6.2.1 Reepay
List of Figures
- Figure 1: Asia Pacific Pay Later Industry Revenue Breakdown (Million, %) by Product 2024 & 2032
- Figure 2: Asia Pacific Pay Later Industry Share (%) by Company 2024
List of Tables
- Table 1: Asia Pacific Pay Later Industry Revenue Million Forecast, by Region 2019 & 2032
- Table 2: Asia Pacific Pay Later Industry Volume Billion Forecast, by Region 2019 & 2032
- Table 3: Asia Pacific Pay Later Industry Revenue Million Forecast, by Channel 2019 & 2032
- Table 4: Asia Pacific Pay Later Industry Volume Billion Forecast, by Channel 2019 & 2032
- Table 5: Asia Pacific Pay Later Industry Revenue Million Forecast, by Enterprise 2019 & 2032
- Table 6: Asia Pacific Pay Later Industry Volume Billion Forecast, by Enterprise 2019 & 2032
- Table 7: Asia Pacific Pay Later Industry Revenue Million Forecast, by End User 2019 & 2032
- Table 8: Asia Pacific Pay Later Industry Volume Billion Forecast, by End User 2019 & 2032
- Table 9: Asia Pacific Pay Later Industry Revenue Million Forecast, by Region 2019 & 2032
- Table 10: Asia Pacific Pay Later Industry Volume Billion Forecast, by Region 2019 & 2032
- Table 11: Asia Pacific Pay Later Industry Revenue Million Forecast, by Channel 2019 & 2032
- Table 12: Asia Pacific Pay Later Industry Volume Billion Forecast, by Channel 2019 & 2032
- Table 13: Asia Pacific Pay Later Industry Revenue Million Forecast, by Enterprise 2019 & 2032
- Table 14: Asia Pacific Pay Later Industry Volume Billion Forecast, by Enterprise 2019 & 2032
- Table 15: Asia Pacific Pay Later Industry Revenue Million Forecast, by End User 2019 & 2032
- Table 16: Asia Pacific Pay Later Industry Volume Billion Forecast, by End User 2019 & 2032
- Table 17: Asia Pacific Pay Later Industry Revenue Million Forecast, by Country 2019 & 2032
- Table 18: Asia Pacific Pay Later Industry Volume Billion Forecast, by Country 2019 & 2032
- Table 19: China Asia Pacific Pay Later Industry Revenue (Million) Forecast, by Application 2019 & 2032
- Table 20: China Asia Pacific Pay Later Industry Volume (Billion) Forecast, by Application 2019 & 2032
- Table 21: Japan Asia Pacific Pay Later Industry Revenue (Million) Forecast, by Application 2019 & 2032
- Table 22: Japan Asia Pacific Pay Later Industry Volume (Billion) Forecast, by Application 2019 & 2032
- Table 23: South Korea Asia Pacific Pay Later Industry Revenue (Million) Forecast, by Application 2019 & 2032
- Table 24: South Korea Asia Pacific Pay Later Industry Volume (Billion) Forecast, by Application 2019 & 2032
- Table 25: India Asia Pacific Pay Later Industry Revenue (Million) Forecast, by Application 2019 & 2032
- Table 26: India Asia Pacific Pay Later Industry Volume (Billion) Forecast, by Application 2019 & 2032
- Table 27: Australia Asia Pacific Pay Later Industry Revenue (Million) Forecast, by Application 2019 & 2032
- Table 28: Australia Asia Pacific Pay Later Industry Volume (Billion) Forecast, by Application 2019 & 2032
- Table 29: New Zealand Asia Pacific Pay Later Industry Revenue (Million) Forecast, by Application 2019 & 2032
- Table 30: New Zealand Asia Pacific Pay Later Industry Volume (Billion) Forecast, by Application 2019 & 2032
- Table 31: Indonesia Asia Pacific Pay Later Industry Revenue (Million) Forecast, by Application 2019 & 2032
- Table 32: Indonesia Asia Pacific Pay Later Industry Volume (Billion) Forecast, by Application 2019 & 2032
- Table 33: Malaysia Asia Pacific Pay Later Industry Revenue (Million) Forecast, by Application 2019 & 2032
- Table 34: Malaysia Asia Pacific Pay Later Industry Volume (Billion) Forecast, by Application 2019 & 2032
- Table 35: Singapore Asia Pacific Pay Later Industry Revenue (Million) Forecast, by Application 2019 & 2032
- Table 36: Singapore Asia Pacific Pay Later Industry Volume (Billion) Forecast, by Application 2019 & 2032
- Table 37: Thailand Asia Pacific Pay Later Industry Revenue (Million) Forecast, by Application 2019 & 2032
- Table 38: Thailand Asia Pacific Pay Later Industry Volume (Billion) Forecast, by Application 2019 & 2032
- Table 39: Vietnam Asia Pacific Pay Later Industry Revenue (Million) Forecast, by Application 2019 & 2032
- Table 40: Vietnam Asia Pacific Pay Later Industry Volume (Billion) Forecast, by Application 2019 & 2032
- Table 41: Philippines Asia Pacific Pay Later Industry Revenue (Million) Forecast, by Application 2019 & 2032
- Table 42: Philippines Asia Pacific Pay Later Industry Volume (Billion) Forecast, by Application 2019 & 2032
Frequently Asked Questions
1. What is the projected Compound Annual Growth Rate (CAGR) of the Asia Pacific Pay Later Industry?
The projected CAGR is approximately 16.56%.
2. Which companies are prominent players in the Asia Pacific Pay Later Industry?
Key companies in the market include Reepay, Akulaku, Hoolah, Atome, Pine Lab, Zest Money BNPL, Openpay (Australia), Rely (Singapore), Limepay (Australia), PayRight (Australia)**List Not Exhaustive.
3. What are the main segments of the Asia Pacific Pay Later Industry?
The market segments include Channel, Enterprise, End User.
4. Can you provide details about the market size?
The market size is estimated to be USD 155.72 Million as of 2022.
5. What are some drivers contributing to market growth?
Lack Of Credit Availability In Small Transaction Driving BNPL Services; Rise In The Value Of Digital Transaction In Asia Pacific.
6. What are the notable trends driving market growth?
Rising Digital Payments.
7. Are there any restraints impacting market growth?
Lack Of Credit Availability In Small Transaction Driving BNPL Services; Rise In The Value Of Digital Transaction In Asia Pacific.
8. Can you provide examples of recent developments in the market?
In June 2022, China E-commerce firm Kuaishou launched Sesame Credit's buy now and pay later (BNPL) service. Under the service users with a Sesame score of 550 and above will be able to order, receive, and try the products before paying on its e-commerce platform allowing its customers to easily return and exchange goods.
9. What pricing options are available for accessing the report?
Pricing options include single-user, multi-user, and enterprise licenses priced at USD 4750, USD 4950, and USD 6800 respectively.
10. Is the market size provided in terms of value or volume?
The market size is provided in terms of value, measured in Million and volume, measured in Billion.
11. Are there any specific market keywords associated with the report?
Yes, the market keyword associated with the report is "Asia Pacific Pay Later Industry," which aids in identifying and referencing the specific market segment covered.
12. How do I determine which pricing option suits my needs best?
The pricing options vary based on user requirements and access needs. Individual users may opt for single-user licenses, while businesses requiring broader access may choose multi-user or enterprise licenses for cost-effective access to the report.
13. Are there any additional resources or data provided in the Asia Pacific Pay Later Industry report?
While the report offers comprehensive insights, it's advisable to review the specific contents or supplementary materials provided to ascertain if additional resources or data are available.
14. How can I stay updated on further developments or reports in the Asia Pacific Pay Later Industry?
To stay informed about further developments, trends, and reports in the Asia Pacific Pay Later Industry, consider subscribing to industry newsletters, following relevant companies and organizations, or regularly checking reputable industry news sources and publications.
Methodology
Step 1 - Identification of Relevant Samples Size from Population Database


Step 2 - Approaches for Defining Global Market Size (Value, Volume* & Price*)

Note*: In applicable scenarios
Step 3 - Data Sources
Primary Research
- Web Analytics
- Survey Reports
- Research Institute
- Latest Research Reports
- Opinion Leaders
Secondary Research
- Annual Reports
- White Paper
- Latest Press Release
- Industry Association
- Paid Database
- Investor Presentations

Step 4 - Data Triangulation
Involves using different sources of information in order to increase the validity of a study
These sources are likely to be stakeholders in a program - participants, other researchers, program staff, other community members, and so on.
Then we put all data in single framework & apply various statistical tools to find out the dynamic on the market.
During the analysis stage, feedback from the stakeholder groups would be compared to determine areas of agreement as well as areas of divergence


