
Key Insights
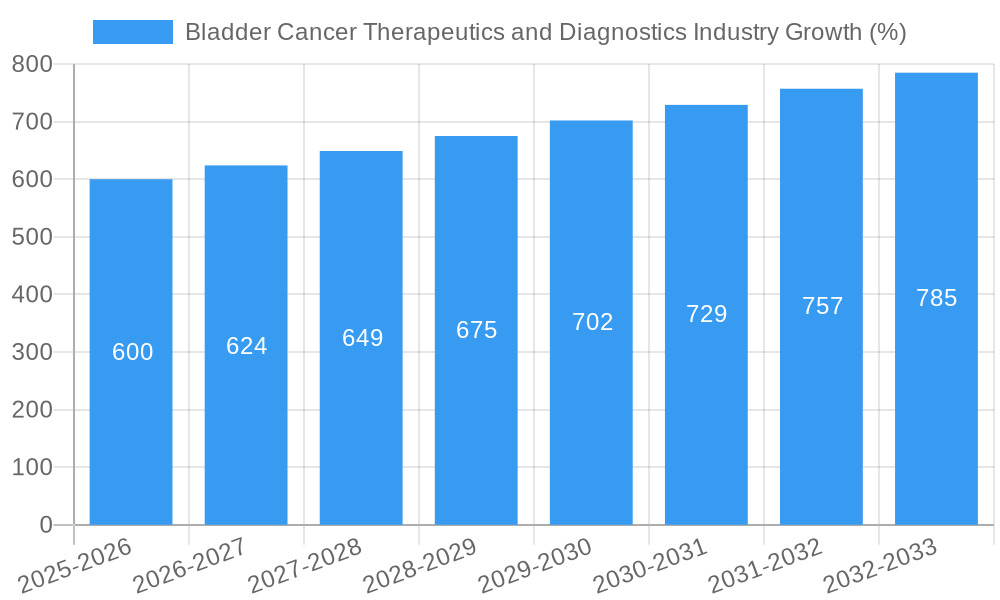
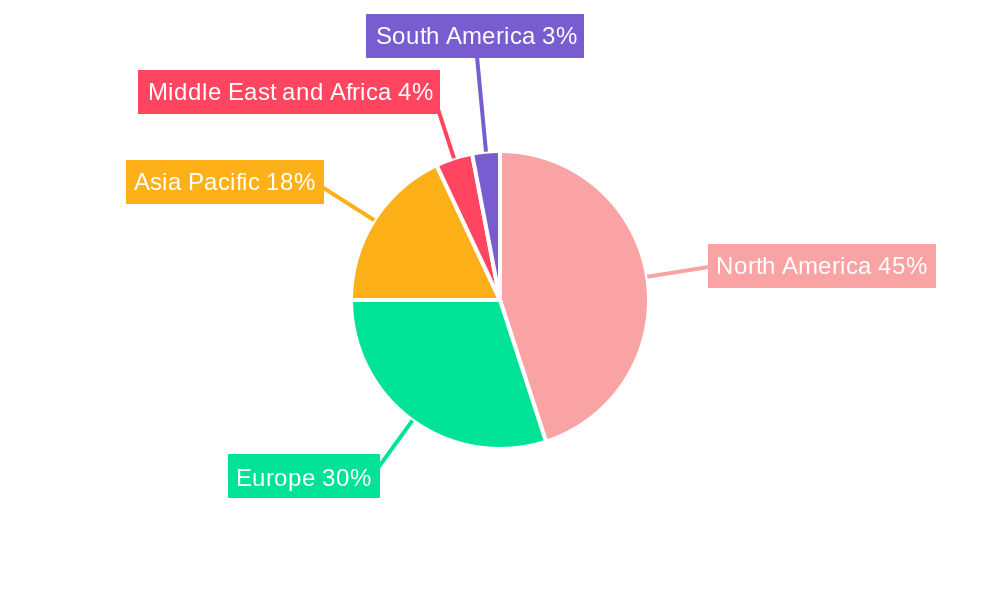
The global bladder cancer therapeutics and diagnostics market is experiencing steady growth, projected to maintain a Compound Annual Growth Rate (CAGR) of 4.00% from 2025 to 2033. This expansion is driven by several factors, including increasing prevalence of bladder cancer, particularly transitional cell carcinoma, advancements in targeted therapies and immunotherapies, and the growing adoption of sophisticated diagnostic tools such as advanced imaging techniques and molecular diagnostics. The market is segmented by product type (therapeutics and diagnostics), cancer type (transitional cell bladder cancer, squamous cell bladder cancer, and other types), and geography. North America currently holds a significant market share due to high healthcare expenditure, advanced infrastructure, and a large patient population. However, Asia Pacific is expected to witness substantial growth in the coming years driven by rising healthcare awareness, improving healthcare infrastructure, and a growing incidence of bladder cancer in developing economies. The market faces certain restraints, including the high cost of advanced therapies, the complexity of treatment regimens, and the development of drug resistance. Despite these challenges, ongoing research and development efforts focused on novel treatment approaches and improved diagnostic technologies are poised to fuel future market growth.
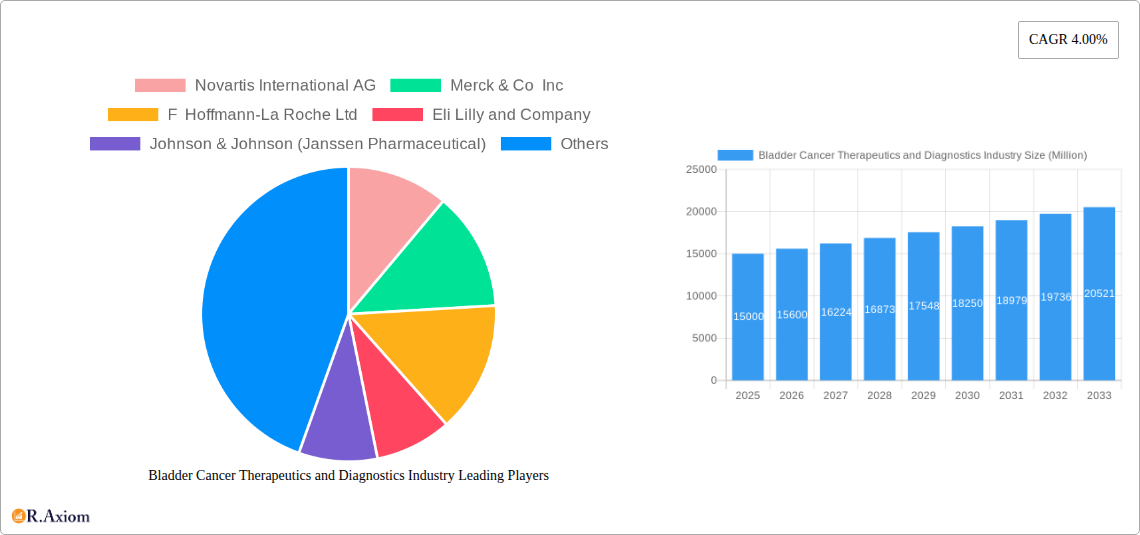
The competitive landscape is characterized by the presence of major pharmaceutical companies like Novartis, Merck, Roche, Eli Lilly, and Johnson & Johnson, along with several smaller diagnostic companies. These players are actively engaged in research, development, and commercialization efforts to expand their market presence. Strategic partnerships, mergers, and acquisitions are likely to shape the competitive dynamics in the years to come. The focus is shifting towards personalized medicine approaches to improve treatment efficacy and minimize adverse effects. This includes the development of biomarkers to identify patients most likely to benefit from specific therapies and the use of advanced diagnostic techniques to facilitate early detection and improved treatment planning. The ongoing evolution of therapeutic options, coupled with improvements in diagnostic capabilities, will continue to drive market expansion throughout the forecast period.
This comprehensive report provides an in-depth analysis of the Bladder Cancer Therapeutics and Diagnostics industry, offering valuable insights for stakeholders, investors, and industry professionals. The report covers the period 2019-2033, with a focus on the 2025 market and a forecast extending to 2033. Key market segments, leading players, and emerging trends are meticulously examined to provide a holistic understanding of this dynamic market. The report leverages extensive data analysis and expert insights to deliver actionable intelligence for strategic decision-making.
Bladder Cancer Therapeutics and Diagnostics Industry Market Concentration & Innovation
The Bladder Cancer Therapeutics and Diagnostics market exhibits a moderately concentrated landscape, with several multinational pharmaceutical companies holding significant market share. Novartis International AG, Merck & Co Inc, F Hoffmann-La Roche Ltd, and others dominate the therapeutics segment, while the diagnostics segment shows a mix of established players and emerging innovative companies like Nanostics Inc. Market share data for 2025 estimates that Novartis holds approximately xx%, Merck & Co Inc holds approximately xx%, and F Hoffmann-La Roche Ltd holds approximately xx% of the global therapeutics market. M&A activity has been relatively high in recent years, with deal values totaling an estimated $xx Million in 2024. Key drivers of innovation include the development of novel targeted therapies, advanced diagnostic tools (e.g., ClarityDX Bladder), and the ongoing research focusing on immunotherapy and personalized medicine. Stringent regulatory frameworks, particularly from the FDA, influence the pace of innovation and market entry. Product substitutes are limited, primarily focusing on alternative treatment modalities within oncology. The industry sees increasing demand driven by an aging global population and rising prevalence of bladder cancer.
- Market Concentration: Moderately concentrated, dominated by large pharmaceutical companies.
- Innovation Drivers: Targeted therapies, advanced diagnostics, immunotherapy, personalized medicine.
- Regulatory Frameworks: Stringent FDA guidelines influence approvals and market access.
- Product Substitutes: Limited alternatives, mainly other cancer treatments.
- End-User Trends: Growing demand driven by aging population and rising prevalence.
- M&A Activity: Significant activity in recent years, with deal values reaching $xx Million in 2024.
Bladder Cancer Therapeutics and Diagnostics Industry Industry Trends & Insights
The Bladder Cancer Therapeutics and Diagnostics market is experiencing robust growth, driven by factors such as the increasing prevalence of bladder cancer globally, advancements in treatment modalities (including immunotherapy and targeted therapies), and the development of more sophisticated diagnostic tools. The market is projected to register a CAGR of xx% during the forecast period (2025-2033). Technological disruptions are transforming the landscape, with the introduction of liquid biopsies and AI-powered diagnostic tools improving early detection and treatment efficacy. Consumer preferences are shifting towards minimally invasive procedures and personalized medicine approaches, leading to increased demand for targeted therapies and advanced diagnostics. Competitive dynamics are intense, with existing players constantly investing in R&D and new market entrants leveraging technological advancements to gain a foothold. Market penetration of advanced diagnostic tools remains relatively low, offering significant growth potential in the coming years. This is further amplified by increasing government initiatives to raise awareness and improve early detection rates.
Dominant Markets & Segments in Bladder Cancer Therapeutics and Diagnostics Industry
The North American market currently dominates the Bladder Cancer Therapeutics and Diagnostics industry, driven by factors such as high healthcare expenditure, advanced healthcare infrastructure, and a high prevalence of bladder cancer. Within the product segments, therapeutics currently hold a larger market share compared to diagnostics. Transitional cell bladder cancer accounts for the largest proportion of diagnosed cases, making it the dominant cancer type within this market.
Leading Region: North America
Key Drivers (North America): High healthcare expenditure, advanced infrastructure, high prevalence of bladder cancer.
Dominant Product Segment: Therapeutics
Dominant Cancer Type: Transitional Cell Bladder Cancer
Market Size (2025): Therapeutics: $xx Million; Diagnostics: $xx Million.
Transitional Cell Bladder Cancer: This segment represents the majority of bladder cancer cases, driving the demand for therapeutics and diagnostics.
Squamous Cell Bladder Cancer: While a smaller segment, it presents a significant need for targeted therapies and diagnostic solutions, contributing to market growth.
Other Cancer Types: This segment encompasses other rarer forms of bladder cancer and contributes to the market's overall diversity.
Bladder Cancer Therapeutics and Diagnostics Industry Product Developments
Recent years have witnessed significant advancements in bladder cancer therapeutics and diagnostics. Novel targeted therapies, such as immune checkpoint inhibitors and antibody-drug conjugates, are demonstrating improved efficacy and tolerability. In diagnostics, minimally invasive techniques like liquid biopsies are gaining traction, enabling early detection and improved patient outcomes. This innovation is driven by the need for more precise diagnostics and effective targeted treatments. These developments, coupled with a focus on personalized medicine, are shaping the future of bladder cancer care.
Report Scope & Segmentation Analysis
This report segments the Bladder Cancer Therapeutics and Diagnostics market based on product (Therapeutics, Diagnostics, Other Therapeutics), cancer type (Transitional Cell Bladder Cancer, Squamous Cell Bladder Cancer, Other Cancer Types), and geography. The Therapeutics segment is expected to witness substantial growth due to the development of novel targeted therapies and immunotherapies. The Diagnostics segment is also expected to expand significantly, driven by technological advancements. Transitional cell bladder cancer dominates the market share across all segments. Growth projections vary across segments and geographies, with North America consistently exhibiting strong growth compared to other regions.
Key Drivers of Bladder Cancer Therapeutics and Diagnostics Industry Growth
Several factors contribute to the growth of the Bladder Cancer Therapeutics and Diagnostics industry: the increasing prevalence of bladder cancer globally due to an aging population and lifestyle factors; advancements in research and development leading to new and more effective treatments; growing investment in R&D from pharmaceutical and diagnostic companies; and increasing government initiatives to raise awareness and improve early detection and treatment rates.
Challenges in the Bladder Cancer Therapeutics and Diagnostics Industry Sector
The Bladder Cancer Therapeutics and Diagnostics industry faces several challenges. The high cost of developing and commercializing new therapies can create barriers to entry for smaller companies. Stringent regulatory approvals can delay market access for innovative products. Supply chain disruptions can affect the availability of crucial raw materials. Intense competition among established pharmaceutical and diagnostic companies further complicates the industry landscape. The overall impact of these challenges is estimated to reduce the market's annual growth by approximately xx% during the forecast period.
Emerging Opportunities in Bladder Cancer Therapeutics and Diagnostics Industry
Emerging opportunities are presenting themselves within this industry. Personalized medicine, using genetic information to tailor treatments, is gaining momentum. Liquid biopsies are poised to revolutionize diagnostic techniques, leading to earlier and more accurate detection. The development of new, less toxic therapies is a key priority. The expansion into new geographical markets, particularly in emerging economies, offers significant untapped potential.
Leading Players in the Bladder Cancer Therapeutics and Diagnostics Industry Market
- Novartis International AG
- Merck & Co Inc
- F Hoffmann-La Roche Ltd
- Eli Lilly and Company
- Johnson & Johnson (Janssen Pharmaceutical)
- Ameritech Diagnostic Reagent(Jiaxing)Co Ltd
- Endo Pharmaceuticals Inc
- Astellas Pharma Inc
- Abbott Inc
- Bristol-Myers Squibb Company
- GlaxoSmithKline PLC
- Pfizer Inc
Key Developments in Bladder Cancer Therapeutics and Diagnostics Industry Industry
- July 2022: The FDA agreed to review ImmunityBio's BLA for N-803 for non-muscle-invasive bladder cancer (NMIBC). This could significantly impact treatment options for NMIBC patients.
- July 2022: Nanostics Inc. launched a clinical study for its ClarityDX Bladder diagnostic test, potentially improving early detection capabilities. This could lead to earlier interventions and improved patient outcomes.
Strategic Outlook for Bladder Cancer Therapeutics and Diagnostics Industry Market
The Bladder Cancer Therapeutics and Diagnostics market is poised for significant growth, driven by ongoing R&D efforts, technological advancements, and increasing awareness about bladder cancer. The focus on personalized medicine, minimally invasive procedures, and improved diagnostics will shape the future of the industry. Continued investment in innovative therapies and diagnostics will be crucial to meeting the growing global demand and improving patient outcomes. The market offers significant opportunities for established players and new entrants alike, particularly in the development and commercialization of cutting-edge technologies and personalized treatment approaches.
Bladder Cancer Therapeutics and Diagnostics Industry Segmentation
-
1. Product
-
1.1. Therapeutics
- 1.1.1. Chemotherapy
- 1.1.2. Immunotherapy
- 1.1.3. Other Therapeuticss
-
1.2. Diagnostics
- 1.2.1. Cystoscopy
- 1.2.2. Bladder Ultrasound
- 1.2.3. Urinalysis
- 1.2.4. Other Diagnostics
-
1.1. Therapeutics
-
2. Cancer Type
- 2.1. Transitional Cell Bladder Cancer
- 2.2. Squamous Cell Bladder Cancer
- 2.3. Other Cancer Types
Bladder Cancer Therapeutics and Diagnostics Industry Segmentation By Geography
-
1. North America
- 1.1. United States
- 1.2. Canada
- 1.3. Mexico
-
2. Europe
- 2.1. Germany
- 2.2. United Kingdom
- 2.3. France
- 2.4. Italy
- 2.5. Spain
- 2.6. Rest of Europe
-
3. Asia Pacific
- 3.1. China
- 3.2. Japan
- 3.3. India
- 3.4. Australia
- 3.5. South Korea
- 3.6. Rest of Asia Pacific
-
4. Middle East and Africa
- 4.1. GCC
- 4.2. South Africa
- 4.3. Rest of Middle East and Africa
-
5. South America
- 5.1. Brazil
- 5.2. Argentina
- 5.3. Rest of South America
Bladder Cancer Therapeutics and Diagnostics Industry REPORT HIGHLIGHTS
| Aspects | Details |
|---|---|
| Study Period | 2019-2033 |
| Base Year | 2024 |
| Estimated Year | 2025 |
| Forecast Period | 2025-2033 |
| Historical Period | 2019-2024 |
| Growth Rate | CAGR of 4.00% from 2019-2033 |
| Segmentation |
|
Table of Contents
- 1. Introduction
- 1.1. Research Scope
- 1.2. Market Segmentation
- 1.3. Research Methodology
- 1.4. Definitions and Assumptions
- 2. Executive Summary
- 2.1. Introduction
- 3. Market Dynamics
- 3.1. Introduction
- 3.2. Market Drivers
- 3.2.1. Increasing Awareness on Bladder Diseases and Available Therapies; Increasing Healthcare Expenditure; Increasing Burden of Bladder Cancer
- 3.3. Market Restrains
- 3.3.1. Rise in the Number of Patent Expiration and Increased Use of Generic Drugs; Asymptomatic Nature of the Disease
- 3.4. Market Trends
- 3.4.1. Cystoscopy is Anticipated to be the Dominant Segment in Studied Market Over the Forecast Period
- 4. Market Factor Analysis
- 4.1. Porters Five Forces
- 4.2. Supply/Value Chain
- 4.3. PESTEL analysis
- 4.4. Market Entropy
- 4.5. Patent/Trademark Analysis
- 5. Global Bladder Cancer Therapeutics and Diagnostics Industry Analysis, Insights and Forecast, 2019-2031
- 5.1. Market Analysis, Insights and Forecast - by Product
- 5.1.1. Therapeutics
- 5.1.1.1. Chemotherapy
- 5.1.1.2. Immunotherapy
- 5.1.1.3. Other Therapeuticss
- 5.1.2. Diagnostics
- 5.1.2.1. Cystoscopy
- 5.1.2.2. Bladder Ultrasound
- 5.1.2.3. Urinalysis
- 5.1.2.4. Other Diagnostics
- 5.1.1. Therapeutics
- 5.2. Market Analysis, Insights and Forecast - by Cancer Type
- 5.2.1. Transitional Cell Bladder Cancer
- 5.2.2. Squamous Cell Bladder Cancer
- 5.2.3. Other Cancer Types
- 5.3. Market Analysis, Insights and Forecast - by Region
- 5.3.1. North America
- 5.3.2. Europe
- 5.3.3. Asia Pacific
- 5.3.4. Middle East and Africa
- 5.3.5. South America
- 5.1. Market Analysis, Insights and Forecast - by Product
- 6. North America Bladder Cancer Therapeutics and Diagnostics Industry Analysis, Insights and Forecast, 2019-2031
- 6.1. Market Analysis, Insights and Forecast - by Product
- 6.1.1. Therapeutics
- 6.1.1.1. Chemotherapy
- 6.1.1.2. Immunotherapy
- 6.1.1.3. Other Therapeuticss
- 6.1.2. Diagnostics
- 6.1.2.1. Cystoscopy
- 6.1.2.2. Bladder Ultrasound
- 6.1.2.3. Urinalysis
- 6.1.2.4. Other Diagnostics
- 6.1.1. Therapeutics
- 6.2. Market Analysis, Insights and Forecast - by Cancer Type
- 6.2.1. Transitional Cell Bladder Cancer
- 6.2.2. Squamous Cell Bladder Cancer
- 6.2.3. Other Cancer Types
- 6.1. Market Analysis, Insights and Forecast - by Product
- 7. Europe Bladder Cancer Therapeutics and Diagnostics Industry Analysis, Insights and Forecast, 2019-2031
- 7.1. Market Analysis, Insights and Forecast - by Product
- 7.1.1. Therapeutics
- 7.1.1.1. Chemotherapy
- 7.1.1.2. Immunotherapy
- 7.1.1.3. Other Therapeuticss
- 7.1.2. Diagnostics
- 7.1.2.1. Cystoscopy
- 7.1.2.2. Bladder Ultrasound
- 7.1.2.3. Urinalysis
- 7.1.2.4. Other Diagnostics
- 7.1.1. Therapeutics
- 7.2. Market Analysis, Insights and Forecast - by Cancer Type
- 7.2.1. Transitional Cell Bladder Cancer
- 7.2.2. Squamous Cell Bladder Cancer
- 7.2.3. Other Cancer Types
- 7.1. Market Analysis, Insights and Forecast - by Product
- 8. Asia Pacific Bladder Cancer Therapeutics and Diagnostics Industry Analysis, Insights and Forecast, 2019-2031
- 8.1. Market Analysis, Insights and Forecast - by Product
- 8.1.1. Therapeutics
- 8.1.1.1. Chemotherapy
- 8.1.1.2. Immunotherapy
- 8.1.1.3. Other Therapeuticss
- 8.1.2. Diagnostics
- 8.1.2.1. Cystoscopy
- 8.1.2.2. Bladder Ultrasound
- 8.1.2.3. Urinalysis
- 8.1.2.4. Other Diagnostics
- 8.1.1. Therapeutics
- 8.2. Market Analysis, Insights and Forecast - by Cancer Type
- 8.2.1. Transitional Cell Bladder Cancer
- 8.2.2. Squamous Cell Bladder Cancer
- 8.2.3. Other Cancer Types
- 8.1. Market Analysis, Insights and Forecast - by Product
- 9. Middle East and Africa Bladder Cancer Therapeutics and Diagnostics Industry Analysis, Insights and Forecast, 2019-2031
- 9.1. Market Analysis, Insights and Forecast - by Product
- 9.1.1. Therapeutics
- 9.1.1.1. Chemotherapy
- 9.1.1.2. Immunotherapy
- 9.1.1.3. Other Therapeuticss
- 9.1.2. Diagnostics
- 9.1.2.1. Cystoscopy
- 9.1.2.2. Bladder Ultrasound
- 9.1.2.3. Urinalysis
- 9.1.2.4. Other Diagnostics
- 9.1.1. Therapeutics
- 9.2. Market Analysis, Insights and Forecast - by Cancer Type
- 9.2.1. Transitional Cell Bladder Cancer
- 9.2.2. Squamous Cell Bladder Cancer
- 9.2.3. Other Cancer Types
- 9.1. Market Analysis, Insights and Forecast - by Product
- 10. South America Bladder Cancer Therapeutics and Diagnostics Industry Analysis, Insights and Forecast, 2019-2031
- 10.1. Market Analysis, Insights and Forecast - by Product
- 10.1.1. Therapeutics
- 10.1.1.1. Chemotherapy
- 10.1.1.2. Immunotherapy
- 10.1.1.3. Other Therapeuticss
- 10.1.2. Diagnostics
- 10.1.2.1. Cystoscopy
- 10.1.2.2. Bladder Ultrasound
- 10.1.2.3. Urinalysis
- 10.1.2.4. Other Diagnostics
- 10.1.1. Therapeutics
- 10.2. Market Analysis, Insights and Forecast - by Cancer Type
- 10.2.1. Transitional Cell Bladder Cancer
- 10.2.2. Squamous Cell Bladder Cancer
- 10.2.3. Other Cancer Types
- 10.1. Market Analysis, Insights and Forecast - by Product
- 11. North America Bladder Cancer Therapeutics and Diagnostics Industry Analysis, Insights and Forecast, 2019-2031
- 11.1. Market Analysis, Insights and Forecast - By Country/Sub-region
- 11.1.1 United States
- 11.1.2 Canada
- 11.1.3 Mexico
- 12. Europe Bladder Cancer Therapeutics and Diagnostics Industry Analysis, Insights and Forecast, 2019-2031
- 12.1. Market Analysis, Insights and Forecast - By Country/Sub-region
- 12.1.1 Germany
- 12.1.2 United Kingdom
- 12.1.3 France
- 12.1.4 Italy
- 12.1.5 Spain
- 12.1.6 Rest of Europe
- 13. Asia Pacific Bladder Cancer Therapeutics and Diagnostics Industry Analysis, Insights and Forecast, 2019-2031
- 13.1. Market Analysis, Insights and Forecast - By Country/Sub-region
- 13.1.1 China
- 13.1.2 Japan
- 13.1.3 India
- 13.1.4 Australia
- 13.1.5 South Korea
- 13.1.6 Rest of Asia Pacific
- 14. Middle East and Africa Bladder Cancer Therapeutics and Diagnostics Industry Analysis, Insights and Forecast, 2019-2031
- 14.1. Market Analysis, Insights and Forecast - By Country/Sub-region
- 14.1.1 GCC
- 14.1.2 South Africa
- 14.1.3 Rest of Middle East and Africa
- 15. South America Bladder Cancer Therapeutics and Diagnostics Industry Analysis, Insights and Forecast, 2019-2031
- 15.1. Market Analysis, Insights and Forecast - By Country/Sub-region
- 15.1.1 Brazil
- 15.1.2 Argentina
- 15.1.3 Rest of South America
- 16. Competitive Analysis
- 16.1. Global Market Share Analysis 2024
- 16.2. Company Profiles
- 16.2.1 Novartis International AG
- 16.2.1.1. Overview
- 16.2.1.2. Products
- 16.2.1.3. SWOT Analysis
- 16.2.1.4. Recent Developments
- 16.2.1.5. Financials (Based on Availability)
- 16.2.2 Merck & Co Inc
- 16.2.2.1. Overview
- 16.2.2.2. Products
- 16.2.2.3. SWOT Analysis
- 16.2.2.4. Recent Developments
- 16.2.2.5. Financials (Based on Availability)
- 16.2.3 F Hoffmann-La Roche Ltd
- 16.2.3.1. Overview
- 16.2.3.2. Products
- 16.2.3.3. SWOT Analysis
- 16.2.3.4. Recent Developments
- 16.2.3.5. Financials (Based on Availability)
- 16.2.4 Eli Lilly and Company
- 16.2.4.1. Overview
- 16.2.4.2. Products
- 16.2.4.3. SWOT Analysis
- 16.2.4.4. Recent Developments
- 16.2.4.5. Financials (Based on Availability)
- 16.2.5 Johnson & Johnson (Janssen Pharmaceutical)
- 16.2.5.1. Overview
- 16.2.5.2. Products
- 16.2.5.3. SWOT Analysis
- 16.2.5.4. Recent Developments
- 16.2.5.5. Financials (Based on Availability)
- 16.2.6 Ameritech Diagnostic Reagent(Jiaxing)Co Ltd
- 16.2.6.1. Overview
- 16.2.6.2. Products
- 16.2.6.3. SWOT Analysis
- 16.2.6.4. Recent Developments
- 16.2.6.5. Financials (Based on Availability)
- 16.2.7 Endo Pharmaceuticals Inc
- 16.2.7.1. Overview
- 16.2.7.2. Products
- 16.2.7.3. SWOT Analysis
- 16.2.7.4. Recent Developments
- 16.2.7.5. Financials (Based on Availability)
- 16.2.8 Astellas Pharma Inc
- 16.2.8.1. Overview
- 16.2.8.2. Products
- 16.2.8.3. SWOT Analysis
- 16.2.8.4. Recent Developments
- 16.2.8.5. Financials (Based on Availability)
- 16.2.9 Abbott Inc
- 16.2.9.1. Overview
- 16.2.9.2. Products
- 16.2.9.3. SWOT Analysis
- 16.2.9.4. Recent Developments
- 16.2.9.5. Financials (Based on Availability)
- 16.2.10 Bristol-Myers Squibb Company
- 16.2.10.1. Overview
- 16.2.10.2. Products
- 16.2.10.3. SWOT Analysis
- 16.2.10.4. Recent Developments
- 16.2.10.5. Financials (Based on Availability)
- 16.2.11 GlaxoSmithKline PLC
- 16.2.11.1. Overview
- 16.2.11.2. Products
- 16.2.11.3. SWOT Analysis
- 16.2.11.4. Recent Developments
- 16.2.11.5. Financials (Based on Availability)
- 16.2.12 Pfizer Inc
- 16.2.12.1. Overview
- 16.2.12.2. Products
- 16.2.12.3. SWOT Analysis
- 16.2.12.4. Recent Developments
- 16.2.12.5. Financials (Based on Availability)
- 16.2.1 Novartis International AG
List of Figures
- Figure 1: Global Bladder Cancer Therapeutics and Diagnostics Industry Revenue Breakdown (Million, %) by Region 2024 & 2032
- Figure 2: Global Bladder Cancer Therapeutics and Diagnostics Industry Volume Breakdown (K Unit, %) by Region 2024 & 2032
- Figure 3: North America Bladder Cancer Therapeutics and Diagnostics Industry Revenue (Million), by Country 2024 & 2032
- Figure 4: North America Bladder Cancer Therapeutics and Diagnostics Industry Volume (K Unit), by Country 2024 & 2032
- Figure 5: North America Bladder Cancer Therapeutics and Diagnostics Industry Revenue Share (%), by Country 2024 & 2032
- Figure 6: North America Bladder Cancer Therapeutics and Diagnostics Industry Volume Share (%), by Country 2024 & 2032
- Figure 7: Europe Bladder Cancer Therapeutics and Diagnostics Industry Revenue (Million), by Country 2024 & 2032
- Figure 8: Europe Bladder Cancer Therapeutics and Diagnostics Industry Volume (K Unit), by Country 2024 & 2032
- Figure 9: Europe Bladder Cancer Therapeutics and Diagnostics Industry Revenue Share (%), by Country 2024 & 2032
- Figure 10: Europe Bladder Cancer Therapeutics and Diagnostics Industry Volume Share (%), by Country 2024 & 2032
- Figure 11: Asia Pacific Bladder Cancer Therapeutics and Diagnostics Industry Revenue (Million), by Country 2024 & 2032
- Figure 12: Asia Pacific Bladder Cancer Therapeutics and Diagnostics Industry Volume (K Unit), by Country 2024 & 2032
- Figure 13: Asia Pacific Bladder Cancer Therapeutics and Diagnostics Industry Revenue Share (%), by Country 2024 & 2032
- Figure 14: Asia Pacific Bladder Cancer Therapeutics and Diagnostics Industry Volume Share (%), by Country 2024 & 2032
- Figure 15: Middle East and Africa Bladder Cancer Therapeutics and Diagnostics Industry Revenue (Million), by Country 2024 & 2032
- Figure 16: Middle East and Africa Bladder Cancer Therapeutics and Diagnostics Industry Volume (K Unit), by Country 2024 & 2032
- Figure 17: Middle East and Africa Bladder Cancer Therapeutics and Diagnostics Industry Revenue Share (%), by Country 2024 & 2032
- Figure 18: Middle East and Africa Bladder Cancer Therapeutics and Diagnostics Industry Volume Share (%), by Country 2024 & 2032
- Figure 19: South America Bladder Cancer Therapeutics and Diagnostics Industry Revenue (Million), by Country 2024 & 2032
- Figure 20: South America Bladder Cancer Therapeutics and Diagnostics Industry Volume (K Unit), by Country 2024 & 2032
- Figure 21: South America Bladder Cancer Therapeutics and Diagnostics Industry Revenue Share (%), by Country 2024 & 2032
- Figure 22: South America Bladder Cancer Therapeutics and Diagnostics Industry Volume Share (%), by Country 2024 & 2032
- Figure 23: North America Bladder Cancer Therapeutics and Diagnostics Industry Revenue (Million), by Product 2024 & 2032
- Figure 24: North America Bladder Cancer Therapeutics and Diagnostics Industry Volume (K Unit), by Product 2024 & 2032
- Figure 25: North America Bladder Cancer Therapeutics and Diagnostics Industry Revenue Share (%), by Product 2024 & 2032
- Figure 26: North America Bladder Cancer Therapeutics and Diagnostics Industry Volume Share (%), by Product 2024 & 2032
- Figure 27: North America Bladder Cancer Therapeutics and Diagnostics Industry Revenue (Million), by Cancer Type 2024 & 2032
- Figure 28: North America Bladder Cancer Therapeutics and Diagnostics Industry Volume (K Unit), by Cancer Type 2024 & 2032
- Figure 29: North America Bladder Cancer Therapeutics and Diagnostics Industry Revenue Share (%), by Cancer Type 2024 & 2032
- Figure 30: North America Bladder Cancer Therapeutics and Diagnostics Industry Volume Share (%), by Cancer Type 2024 & 2032
- Figure 31: North America Bladder Cancer Therapeutics and Diagnostics Industry Revenue (Million), by Country 2024 & 2032
- Figure 32: North America Bladder Cancer Therapeutics and Diagnostics Industry Volume (K Unit), by Country 2024 & 2032
- Figure 33: North America Bladder Cancer Therapeutics and Diagnostics Industry Revenue Share (%), by Country 2024 & 2032
- Figure 34: North America Bladder Cancer Therapeutics and Diagnostics Industry Volume Share (%), by Country 2024 & 2032
- Figure 35: Europe Bladder Cancer Therapeutics and Diagnostics Industry Revenue (Million), by Product 2024 & 2032
- Figure 36: Europe Bladder Cancer Therapeutics and Diagnostics Industry Volume (K Unit), by Product 2024 & 2032
- Figure 37: Europe Bladder Cancer Therapeutics and Diagnostics Industry Revenue Share (%), by Product 2024 & 2032
- Figure 38: Europe Bladder Cancer Therapeutics and Diagnostics Industry Volume Share (%), by Product 2024 & 2032
- Figure 39: Europe Bladder Cancer Therapeutics and Diagnostics Industry Revenue (Million), by Cancer Type 2024 & 2032
- Figure 40: Europe Bladder Cancer Therapeutics and Diagnostics Industry Volume (K Unit), by Cancer Type 2024 & 2032
- Figure 41: Europe Bladder Cancer Therapeutics and Diagnostics Industry Revenue Share (%), by Cancer Type 2024 & 2032
- Figure 42: Europe Bladder Cancer Therapeutics and Diagnostics Industry Volume Share (%), by Cancer Type 2024 & 2032
- Figure 43: Europe Bladder Cancer Therapeutics and Diagnostics Industry Revenue (Million), by Country 2024 & 2032
- Figure 44: Europe Bladder Cancer Therapeutics and Diagnostics Industry Volume (K Unit), by Country 2024 & 2032
- Figure 45: Europe Bladder Cancer Therapeutics and Diagnostics Industry Revenue Share (%), by Country 2024 & 2032
- Figure 46: Europe Bladder Cancer Therapeutics and Diagnostics Industry Volume Share (%), by Country 2024 & 2032
- Figure 47: Asia Pacific Bladder Cancer Therapeutics and Diagnostics Industry Revenue (Million), by Product 2024 & 2032
- Figure 48: Asia Pacific Bladder Cancer Therapeutics and Diagnostics Industry Volume (K Unit), by Product 2024 & 2032
- Figure 49: Asia Pacific Bladder Cancer Therapeutics and Diagnostics Industry Revenue Share (%), by Product 2024 & 2032
- Figure 50: Asia Pacific Bladder Cancer Therapeutics and Diagnostics Industry Volume Share (%), by Product 2024 & 2032
- Figure 51: Asia Pacific Bladder Cancer Therapeutics and Diagnostics Industry Revenue (Million), by Cancer Type 2024 & 2032
- Figure 52: Asia Pacific Bladder Cancer Therapeutics and Diagnostics Industry Volume (K Unit), by Cancer Type 2024 & 2032
- Figure 53: Asia Pacific Bladder Cancer Therapeutics and Diagnostics Industry Revenue Share (%), by Cancer Type 2024 & 2032
- Figure 54: Asia Pacific Bladder Cancer Therapeutics and Diagnostics Industry Volume Share (%), by Cancer Type 2024 & 2032
- Figure 55: Asia Pacific Bladder Cancer Therapeutics and Diagnostics Industry Revenue (Million), by Country 2024 & 2032
- Figure 56: Asia Pacific Bladder Cancer Therapeutics and Diagnostics Industry Volume (K Unit), by Country 2024 & 2032
- Figure 57: Asia Pacific Bladder Cancer Therapeutics and Diagnostics Industry Revenue Share (%), by Country 2024 & 2032
- Figure 58: Asia Pacific Bladder Cancer Therapeutics and Diagnostics Industry Volume Share (%), by Country 2024 & 2032
- Figure 59: Middle East and Africa Bladder Cancer Therapeutics and Diagnostics Industry Revenue (Million), by Product 2024 & 2032
- Figure 60: Middle East and Africa Bladder Cancer Therapeutics and Diagnostics Industry Volume (K Unit), by Product 2024 & 2032
- Figure 61: Middle East and Africa Bladder Cancer Therapeutics and Diagnostics Industry Revenue Share (%), by Product 2024 & 2032
- Figure 62: Middle East and Africa Bladder Cancer Therapeutics and Diagnostics Industry Volume Share (%), by Product 2024 & 2032
- Figure 63: Middle East and Africa Bladder Cancer Therapeutics and Diagnostics Industry Revenue (Million), by Cancer Type 2024 & 2032
- Figure 64: Middle East and Africa Bladder Cancer Therapeutics and Diagnostics Industry Volume (K Unit), by Cancer Type 2024 & 2032
- Figure 65: Middle East and Africa Bladder Cancer Therapeutics and Diagnostics Industry Revenue Share (%), by Cancer Type 2024 & 2032
- Figure 66: Middle East and Africa Bladder Cancer Therapeutics and Diagnostics Industry Volume Share (%), by Cancer Type 2024 & 2032
- Figure 67: Middle East and Africa Bladder Cancer Therapeutics and Diagnostics Industry Revenue (Million), by Country 2024 & 2032
- Figure 68: Middle East and Africa Bladder Cancer Therapeutics and Diagnostics Industry Volume (K Unit), by Country 2024 & 2032
- Figure 69: Middle East and Africa Bladder Cancer Therapeutics and Diagnostics Industry Revenue Share (%), by Country 2024 & 2032
- Figure 70: Middle East and Africa Bladder Cancer Therapeutics and Diagnostics Industry Volume Share (%), by Country 2024 & 2032
- Figure 71: South America Bladder Cancer Therapeutics and Diagnostics Industry Revenue (Million), by Product 2024 & 2032
- Figure 72: South America Bladder Cancer Therapeutics and Diagnostics Industry Volume (K Unit), by Product 2024 & 2032
- Figure 73: South America Bladder Cancer Therapeutics and Diagnostics Industry Revenue Share (%), by Product 2024 & 2032
- Figure 74: South America Bladder Cancer Therapeutics and Diagnostics Industry Volume Share (%), by Product 2024 & 2032
- Figure 75: South America Bladder Cancer Therapeutics and Diagnostics Industry Revenue (Million), by Cancer Type 2024 & 2032
- Figure 76: South America Bladder Cancer Therapeutics and Diagnostics Industry Volume (K Unit), by Cancer Type 2024 & 2032
- Figure 77: South America Bladder Cancer Therapeutics and Diagnostics Industry Revenue Share (%), by Cancer Type 2024 & 2032
- Figure 78: South America Bladder Cancer Therapeutics and Diagnostics Industry Volume Share (%), by Cancer Type 2024 & 2032
- Figure 79: South America Bladder Cancer Therapeutics and Diagnostics Industry Revenue (Million), by Country 2024 & 2032
- Figure 80: South America Bladder Cancer Therapeutics and Diagnostics Industry Volume (K Unit), by Country 2024 & 2032
- Figure 81: South America Bladder Cancer Therapeutics and Diagnostics Industry Revenue Share (%), by Country 2024 & 2032
- Figure 82: South America Bladder Cancer Therapeutics and Diagnostics Industry Volume Share (%), by Country 2024 & 2032
List of Tables
- Table 1: Global Bladder Cancer Therapeutics and Diagnostics Industry Revenue Million Forecast, by Region 2019 & 2032
- Table 2: Global Bladder Cancer Therapeutics and Diagnostics Industry Volume K Unit Forecast, by Region 2019 & 2032
- Table 3: Global Bladder Cancer Therapeutics and Diagnostics Industry Revenue Million Forecast, by Product 2019 & 2032
- Table 4: Global Bladder Cancer Therapeutics and Diagnostics Industry Volume K Unit Forecast, by Product 2019 & 2032
- Table 5: Global Bladder Cancer Therapeutics and Diagnostics Industry Revenue Million Forecast, by Cancer Type 2019 & 2032
- Table 6: Global Bladder Cancer Therapeutics and Diagnostics Industry Volume K Unit Forecast, by Cancer Type 2019 & 2032
- Table 7: Global Bladder Cancer Therapeutics and Diagnostics Industry Revenue Million Forecast, by Region 2019 & 2032
- Table 8: Global Bladder Cancer Therapeutics and Diagnostics Industry Volume K Unit Forecast, by Region 2019 & 2032
- Table 9: Global Bladder Cancer Therapeutics and Diagnostics Industry Revenue Million Forecast, by Country 2019 & 2032
- Table 10: Global Bladder Cancer Therapeutics and Diagnostics Industry Volume K Unit Forecast, by Country 2019 & 2032
- Table 11: United States Bladder Cancer Therapeutics and Diagnostics Industry Revenue (Million) Forecast, by Application 2019 & 2032
- Table 12: United States Bladder Cancer Therapeutics and Diagnostics Industry Volume (K Unit) Forecast, by Application 2019 & 2032
- Table 13: Canada Bladder Cancer Therapeutics and Diagnostics Industry Revenue (Million) Forecast, by Application 2019 & 2032
- Table 14: Canada Bladder Cancer Therapeutics and Diagnostics Industry Volume (K Unit) Forecast, by Application 2019 & 2032
- Table 15: Mexico Bladder Cancer Therapeutics and Diagnostics Industry Revenue (Million) Forecast, by Application 2019 & 2032
- Table 16: Mexico Bladder Cancer Therapeutics and Diagnostics Industry Volume (K Unit) Forecast, by Application 2019 & 2032
- Table 17: Global Bladder Cancer Therapeutics and Diagnostics Industry Revenue Million Forecast, by Country 2019 & 2032
- Table 18: Global Bladder Cancer Therapeutics and Diagnostics Industry Volume K Unit Forecast, by Country 2019 & 2032
- Table 19: Germany Bladder Cancer Therapeutics and Diagnostics Industry Revenue (Million) Forecast, by Application 2019 & 2032
- Table 20: Germany Bladder Cancer Therapeutics and Diagnostics Industry Volume (K Unit) Forecast, by Application 2019 & 2032
- Table 21: United Kingdom Bladder Cancer Therapeutics and Diagnostics Industry Revenue (Million) Forecast, by Application 2019 & 2032
- Table 22: United Kingdom Bladder Cancer Therapeutics and Diagnostics Industry Volume (K Unit) Forecast, by Application 2019 & 2032
- Table 23: France Bladder Cancer Therapeutics and Diagnostics Industry Revenue (Million) Forecast, by Application 2019 & 2032
- Table 24: France Bladder Cancer Therapeutics and Diagnostics Industry Volume (K Unit) Forecast, by Application 2019 & 2032
- Table 25: Italy Bladder Cancer Therapeutics and Diagnostics Industry Revenue (Million) Forecast, by Application 2019 & 2032
- Table 26: Italy Bladder Cancer Therapeutics and Diagnostics Industry Volume (K Unit) Forecast, by Application 2019 & 2032
- Table 27: Spain Bladder Cancer Therapeutics and Diagnostics Industry Revenue (Million) Forecast, by Application 2019 & 2032
- Table 28: Spain Bladder Cancer Therapeutics and Diagnostics Industry Volume (K Unit) Forecast, by Application 2019 & 2032
- Table 29: Rest of Europe Bladder Cancer Therapeutics and Diagnostics Industry Revenue (Million) Forecast, by Application 2019 & 2032
- Table 30: Rest of Europe Bladder Cancer Therapeutics and Diagnostics Industry Volume (K Unit) Forecast, by Application 2019 & 2032
- Table 31: Global Bladder Cancer Therapeutics and Diagnostics Industry Revenue Million Forecast, by Country 2019 & 2032
- Table 32: Global Bladder Cancer Therapeutics and Diagnostics Industry Volume K Unit Forecast, by Country 2019 & 2032
- Table 33: China Bladder Cancer Therapeutics and Diagnostics Industry Revenue (Million) Forecast, by Application 2019 & 2032
- Table 34: China Bladder Cancer Therapeutics and Diagnostics Industry Volume (K Unit) Forecast, by Application 2019 & 2032
- Table 35: Japan Bladder Cancer Therapeutics and Diagnostics Industry Revenue (Million) Forecast, by Application 2019 & 2032
- Table 36: Japan Bladder Cancer Therapeutics and Diagnostics Industry Volume (K Unit) Forecast, by Application 2019 & 2032
- Table 37: India Bladder Cancer Therapeutics and Diagnostics Industry Revenue (Million) Forecast, by Application 2019 & 2032
- Table 38: India Bladder Cancer Therapeutics and Diagnostics Industry Volume (K Unit) Forecast, by Application 2019 & 2032
- Table 39: Australia Bladder Cancer Therapeutics and Diagnostics Industry Revenue (Million) Forecast, by Application 2019 & 2032
- Table 40: Australia Bladder Cancer Therapeutics and Diagnostics Industry Volume (K Unit) Forecast, by Application 2019 & 2032
- Table 41: South Korea Bladder Cancer Therapeutics and Diagnostics Industry Revenue (Million) Forecast, by Application 2019 & 2032
- Table 42: South Korea Bladder Cancer Therapeutics and Diagnostics Industry Volume (K Unit) Forecast, by Application 2019 & 2032
- Table 43: Rest of Asia Pacific Bladder Cancer Therapeutics and Diagnostics Industry Revenue (Million) Forecast, by Application 2019 & 2032
- Table 44: Rest of Asia Pacific Bladder Cancer Therapeutics and Diagnostics Industry Volume (K Unit) Forecast, by Application 2019 & 2032
- Table 45: Global Bladder Cancer Therapeutics and Diagnostics Industry Revenue Million Forecast, by Country 2019 & 2032
- Table 46: Global Bladder Cancer Therapeutics and Diagnostics Industry Volume K Unit Forecast, by Country 2019 & 2032
- Table 47: GCC Bladder Cancer Therapeutics and Diagnostics Industry Revenue (Million) Forecast, by Application 2019 & 2032
- Table 48: GCC Bladder Cancer Therapeutics and Diagnostics Industry Volume (K Unit) Forecast, by Application 2019 & 2032
- Table 49: South Africa Bladder Cancer Therapeutics and Diagnostics Industry Revenue (Million) Forecast, by Application 2019 & 2032
- Table 50: South Africa Bladder Cancer Therapeutics and Diagnostics Industry Volume (K Unit) Forecast, by Application 2019 & 2032
- Table 51: Rest of Middle East and Africa Bladder Cancer Therapeutics and Diagnostics Industry Revenue (Million) Forecast, by Application 2019 & 2032
- Table 52: Rest of Middle East and Africa Bladder Cancer Therapeutics and Diagnostics Industry Volume (K Unit) Forecast, by Application 2019 & 2032
- Table 53: Global Bladder Cancer Therapeutics and Diagnostics Industry Revenue Million Forecast, by Country 2019 & 2032
- Table 54: Global Bladder Cancer Therapeutics and Diagnostics Industry Volume K Unit Forecast, by Country 2019 & 2032
- Table 55: Brazil Bladder Cancer Therapeutics and Diagnostics Industry Revenue (Million) Forecast, by Application 2019 & 2032
- Table 56: Brazil Bladder Cancer Therapeutics and Diagnostics Industry Volume (K Unit) Forecast, by Application 2019 & 2032
- Table 57: Argentina Bladder Cancer Therapeutics and Diagnostics Industry Revenue (Million) Forecast, by Application 2019 & 2032
- Table 58: Argentina Bladder Cancer Therapeutics and Diagnostics Industry Volume (K Unit) Forecast, by Application 2019 & 2032
- Table 59: Rest of South America Bladder Cancer Therapeutics and Diagnostics Industry Revenue (Million) Forecast, by Application 2019 & 2032
- Table 60: Rest of South America Bladder Cancer Therapeutics and Diagnostics Industry Volume (K Unit) Forecast, by Application 2019 & 2032
- Table 61: Global Bladder Cancer Therapeutics and Diagnostics Industry Revenue Million Forecast, by Product 2019 & 2032
- Table 62: Global Bladder Cancer Therapeutics and Diagnostics Industry Volume K Unit Forecast, by Product 2019 & 2032
- Table 63: Global Bladder Cancer Therapeutics and Diagnostics Industry Revenue Million Forecast, by Cancer Type 2019 & 2032
- Table 64: Global Bladder Cancer Therapeutics and Diagnostics Industry Volume K Unit Forecast, by Cancer Type 2019 & 2032
- Table 65: Global Bladder Cancer Therapeutics and Diagnostics Industry Revenue Million Forecast, by Country 2019 & 2032
- Table 66: Global Bladder Cancer Therapeutics and Diagnostics Industry Volume K Unit Forecast, by Country 2019 & 2032
- Table 67: United States Bladder Cancer Therapeutics and Diagnostics Industry Revenue (Million) Forecast, by Application 2019 & 2032
- Table 68: United States Bladder Cancer Therapeutics and Diagnostics Industry Volume (K Unit) Forecast, by Application 2019 & 2032
- Table 69: Canada Bladder Cancer Therapeutics and Diagnostics Industry Revenue (Million) Forecast, by Application 2019 & 2032
- Table 70: Canada Bladder Cancer Therapeutics and Diagnostics Industry Volume (K Unit) Forecast, by Application 2019 & 2032
- Table 71: Mexico Bladder Cancer Therapeutics and Diagnostics Industry Revenue (Million) Forecast, by Application 2019 & 2032
- Table 72: Mexico Bladder Cancer Therapeutics and Diagnostics Industry Volume (K Unit) Forecast, by Application 2019 & 2032
- Table 73: Global Bladder Cancer Therapeutics and Diagnostics Industry Revenue Million Forecast, by Product 2019 & 2032
- Table 74: Global Bladder Cancer Therapeutics and Diagnostics Industry Volume K Unit Forecast, by Product 2019 & 2032
- Table 75: Global Bladder Cancer Therapeutics and Diagnostics Industry Revenue Million Forecast, by Cancer Type 2019 & 2032
- Table 76: Global Bladder Cancer Therapeutics and Diagnostics Industry Volume K Unit Forecast, by Cancer Type 2019 & 2032
- Table 77: Global Bladder Cancer Therapeutics and Diagnostics Industry Revenue Million Forecast, by Country 2019 & 2032
- Table 78: Global Bladder Cancer Therapeutics and Diagnostics Industry Volume K Unit Forecast, by Country 2019 & 2032
- Table 79: Germany Bladder Cancer Therapeutics and Diagnostics Industry Revenue (Million) Forecast, by Application 2019 & 2032
- Table 80: Germany Bladder Cancer Therapeutics and Diagnostics Industry Volume (K Unit) Forecast, by Application 2019 & 2032
- Table 81: United Kingdom Bladder Cancer Therapeutics and Diagnostics Industry Revenue (Million) Forecast, by Application 2019 & 2032
- Table 82: United Kingdom Bladder Cancer Therapeutics and Diagnostics Industry Volume (K Unit) Forecast, by Application 2019 & 2032
- Table 83: France Bladder Cancer Therapeutics and Diagnostics Industry Revenue (Million) Forecast, by Application 2019 & 2032
- Table 84: France Bladder Cancer Therapeutics and Diagnostics Industry Volume (K Unit) Forecast, by Application 2019 & 2032
- Table 85: Italy Bladder Cancer Therapeutics and Diagnostics Industry Revenue (Million) Forecast, by Application 2019 & 2032
- Table 86: Italy Bladder Cancer Therapeutics and Diagnostics Industry Volume (K Unit) Forecast, by Application 2019 & 2032
- Table 87: Spain Bladder Cancer Therapeutics and Diagnostics Industry Revenue (Million) Forecast, by Application 2019 & 2032
- Table 88: Spain Bladder Cancer Therapeutics and Diagnostics Industry Volume (K Unit) Forecast, by Application 2019 & 2032
- Table 89: Rest of Europe Bladder Cancer Therapeutics and Diagnostics Industry Revenue (Million) Forecast, by Application 2019 & 2032
- Table 90: Rest of Europe Bladder Cancer Therapeutics and Diagnostics Industry Volume (K Unit) Forecast, by Application 2019 & 2032
- Table 91: Global Bladder Cancer Therapeutics and Diagnostics Industry Revenue Million Forecast, by Product 2019 & 2032
- Table 92: Global Bladder Cancer Therapeutics and Diagnostics Industry Volume K Unit Forecast, by Product 2019 & 2032
- Table 93: Global Bladder Cancer Therapeutics and Diagnostics Industry Revenue Million Forecast, by Cancer Type 2019 & 2032
- Table 94: Global Bladder Cancer Therapeutics and Diagnostics Industry Volume K Unit Forecast, by Cancer Type 2019 & 2032
- Table 95: Global Bladder Cancer Therapeutics and Diagnostics Industry Revenue Million Forecast, by Country 2019 & 2032
- Table 96: Global Bladder Cancer Therapeutics and Diagnostics Industry Volume K Unit Forecast, by Country 2019 & 2032
- Table 97: China Bladder Cancer Therapeutics and Diagnostics Industry Revenue (Million) Forecast, by Application 2019 & 2032
- Table 98: China Bladder Cancer Therapeutics and Diagnostics Industry Volume (K Unit) Forecast, by Application 2019 & 2032
- Table 99: Japan Bladder Cancer Therapeutics and Diagnostics Industry Revenue (Million) Forecast, by Application 2019 & 2032
- Table 100: Japan Bladder Cancer Therapeutics and Diagnostics Industry Volume (K Unit) Forecast, by Application 2019 & 2032
- Table 101: India Bladder Cancer Therapeutics and Diagnostics Industry Revenue (Million) Forecast, by Application 2019 & 2032
- Table 102: India Bladder Cancer Therapeutics and Diagnostics Industry Volume (K Unit) Forecast, by Application 2019 & 2032
- Table 103: Australia Bladder Cancer Therapeutics and Diagnostics Industry Revenue (Million) Forecast, by Application 2019 & 2032
- Table 104: Australia Bladder Cancer Therapeutics and Diagnostics Industry Volume (K Unit) Forecast, by Application 2019 & 2032
- Table 105: South Korea Bladder Cancer Therapeutics and Diagnostics Industry Revenue (Million) Forecast, by Application 2019 & 2032
- Table 106: South Korea Bladder Cancer Therapeutics and Diagnostics Industry Volume (K Unit) Forecast, by Application 2019 & 2032
- Table 107: Rest of Asia Pacific Bladder Cancer Therapeutics and Diagnostics Industry Revenue (Million) Forecast, by Application 2019 & 2032
- Table 108: Rest of Asia Pacific Bladder Cancer Therapeutics and Diagnostics Industry Volume (K Unit) Forecast, by Application 2019 & 2032
- Table 109: Global Bladder Cancer Therapeutics and Diagnostics Industry Revenue Million Forecast, by Product 2019 & 2032
- Table 110: Global Bladder Cancer Therapeutics and Diagnostics Industry Volume K Unit Forecast, by Product 2019 & 2032
- Table 111: Global Bladder Cancer Therapeutics and Diagnostics Industry Revenue Million Forecast, by Cancer Type 2019 & 2032
- Table 112: Global Bladder Cancer Therapeutics and Diagnostics Industry Volume K Unit Forecast, by Cancer Type 2019 & 2032
- Table 113: Global Bladder Cancer Therapeutics and Diagnostics Industry Revenue Million Forecast, by Country 2019 & 2032
- Table 114: Global Bladder Cancer Therapeutics and Diagnostics Industry Volume K Unit Forecast, by Country 2019 & 2032
- Table 115: GCC Bladder Cancer Therapeutics and Diagnostics Industry Revenue (Million) Forecast, by Application 2019 & 2032
- Table 116: GCC Bladder Cancer Therapeutics and Diagnostics Industry Volume (K Unit) Forecast, by Application 2019 & 2032
- Table 117: South Africa Bladder Cancer Therapeutics and Diagnostics Industry Revenue (Million) Forecast, by Application 2019 & 2032
- Table 118: South Africa Bladder Cancer Therapeutics and Diagnostics Industry Volume (K Unit) Forecast, by Application 2019 & 2032
- Table 119: Rest of Middle East and Africa Bladder Cancer Therapeutics and Diagnostics Industry Revenue (Million) Forecast, by Application 2019 & 2032
- Table 120: Rest of Middle East and Africa Bladder Cancer Therapeutics and Diagnostics Industry Volume (K Unit) Forecast, by Application 2019 & 2032
- Table 121: Global Bladder Cancer Therapeutics and Diagnostics Industry Revenue Million Forecast, by Product 2019 & 2032
- Table 122: Global Bladder Cancer Therapeutics and Diagnostics Industry Volume K Unit Forecast, by Product 2019 & 2032
- Table 123: Global Bladder Cancer Therapeutics and Diagnostics Industry Revenue Million Forecast, by Cancer Type 2019 & 2032
- Table 124: Global Bladder Cancer Therapeutics and Diagnostics Industry Volume K Unit Forecast, by Cancer Type 2019 & 2032
- Table 125: Global Bladder Cancer Therapeutics and Diagnostics Industry Revenue Million Forecast, by Country 2019 & 2032
- Table 126: Global Bladder Cancer Therapeutics and Diagnostics Industry Volume K Unit Forecast, by Country 2019 & 2032
- Table 127: Brazil Bladder Cancer Therapeutics and Diagnostics Industry Revenue (Million) Forecast, by Application 2019 & 2032
- Table 128: Brazil Bladder Cancer Therapeutics and Diagnostics Industry Volume (K Unit) Forecast, by Application 2019 & 2032
- Table 129: Argentina Bladder Cancer Therapeutics and Diagnostics Industry Revenue (Million) Forecast, by Application 2019 & 2032
- Table 130: Argentina Bladder Cancer Therapeutics and Diagnostics Industry Volume (K Unit) Forecast, by Application 2019 & 2032
- Table 131: Rest of South America Bladder Cancer Therapeutics and Diagnostics Industry Revenue (Million) Forecast, by Application 2019 & 2032
- Table 132: Rest of South America Bladder Cancer Therapeutics and Diagnostics Industry Volume (K Unit) Forecast, by Application 2019 & 2032
Frequently Asked Questions
1. What is the projected Compound Annual Growth Rate (CAGR) of the Bladder Cancer Therapeutics and Diagnostics Industry?
The projected CAGR is approximately 4.00%.
2. Which companies are prominent players in the Bladder Cancer Therapeutics and Diagnostics Industry?
Key companies in the market include Novartis International AG, Merck & Co Inc, F Hoffmann-La Roche Ltd, Eli Lilly and Company, Johnson & Johnson (Janssen Pharmaceutical), Ameritech Diagnostic Reagent(Jiaxing)Co Ltd, Endo Pharmaceuticals Inc, Astellas Pharma Inc , Abbott Inc, Bristol-Myers Squibb Company, GlaxoSmithKline PLC, Pfizer Inc.
3. What are the main segments of the Bladder Cancer Therapeutics and Diagnostics Industry?
The market segments include Product, Cancer Type.
4. Can you provide details about the market size?
The market size is estimated to be USD XX Million as of 2022.
5. What are some drivers contributing to market growth?
Increasing Awareness on Bladder Diseases and Available Therapies; Increasing Healthcare Expenditure; Increasing Burden of Bladder Cancer.
6. What are the notable trends driving market growth?
Cystoscopy is Anticipated to be the Dominant Segment in Studied Market Over the Forecast Period.
7. Are there any restraints impacting market growth?
Rise in the Number of Patent Expiration and Increased Use of Generic Drugs; Asymptomatic Nature of the Disease.
8. Can you provide examples of recent developments in the market?
In July 2022, The United States Food and Drug Administration (FDA) agreed to review ImmunityBio's Biologics License Application (BLA) for N-803 in patients with or without Ta or T1 illness who have non-muscle-invasive bladder cancer (NMIBC) carcinoma in situ (CIS).
9. What pricing options are available for accessing the report?
Pricing options include single-user, multi-user, and enterprise licenses priced at USD 4750, USD 5250, and USD 8750 respectively.
10. Is the market size provided in terms of value or volume?
The market size is provided in terms of value, measured in Million and volume, measured in K Unit.
11. Are there any specific market keywords associated with the report?
Yes, the market keyword associated with the report is "Bladder Cancer Therapeutics and Diagnostics Industry," which aids in identifying and referencing the specific market segment covered.
12. How do I determine which pricing option suits my needs best?
The pricing options vary based on user requirements and access needs. Individual users may opt for single-user licenses, while businesses requiring broader access may choose multi-user or enterprise licenses for cost-effective access to the report.
13. Are there any additional resources or data provided in the Bladder Cancer Therapeutics and Diagnostics Industry report?
While the report offers comprehensive insights, it's advisable to review the specific contents or supplementary materials provided to ascertain if additional resources or data are available.
14. How can I stay updated on further developments or reports in the Bladder Cancer Therapeutics and Diagnostics Industry?
To stay informed about further developments, trends, and reports in the Bladder Cancer Therapeutics and Diagnostics Industry, consider subscribing to industry newsletters, following relevant companies and organizations, or regularly checking reputable industry news sources and publications.
Methodology
Step 1 - Identification of Relevant Samples Size from Population Database


Step 2 - Approaches for Defining Global Market Size (Value, Volume* & Price*)

Note*: In applicable scenarios
Step 3 - Data Sources
Primary Research
- Web Analytics
- Survey Reports
- Research Institute
- Latest Research Reports
- Opinion Leaders
Secondary Research
- Annual Reports
- White Paper
- Latest Press Release
- Industry Association
- Paid Database
- Investor Presentations

Step 4 - Data Triangulation
Involves using different sources of information in order to increase the validity of a study
These sources are likely to be stakeholders in a program - participants, other researchers, program staff, other community members, and so on.
Then we put all data in single framework & apply various statistical tools to find out the dynamic on the market.
During the analysis stage, feedback from the stakeholder groups would be compared to determine areas of agreement as well as areas of divergence


