


Key Insights
The global Blockchain in Metals and Mining market is projected to experience significant expansion, driven by the intrinsic need for enhanced transparency, traceability, and security across complex supply chains. The estimated market size for 2025 is around $150 million, with an anticipated Compound Annual Growth Rate (CAGR) of 25% through 2033. This robust growth is fueled by the increasing adoption of blockchain technology to combat issues such as illicit mining, provenance fraud, and inefficient transaction processes within the industry. Key drivers include the growing demand for ethically sourced and conflict-free minerals, stringent regulatory frameworks mandating supply chain transparency, and the potential for blockchain to streamline administrative processes, reduce operational costs, and improve investor confidence. Public blockchains, offering decentralized and immutable records, are gaining traction, while private blockchains are being favored by larger enterprises for their controlled access and scalability in specific use cases like metal trading and origin verification.
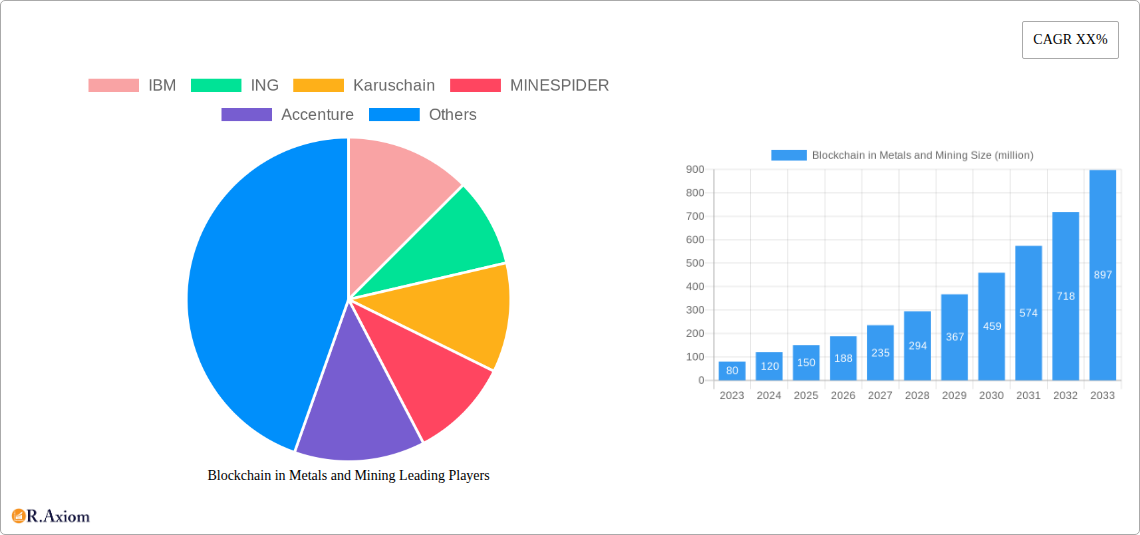
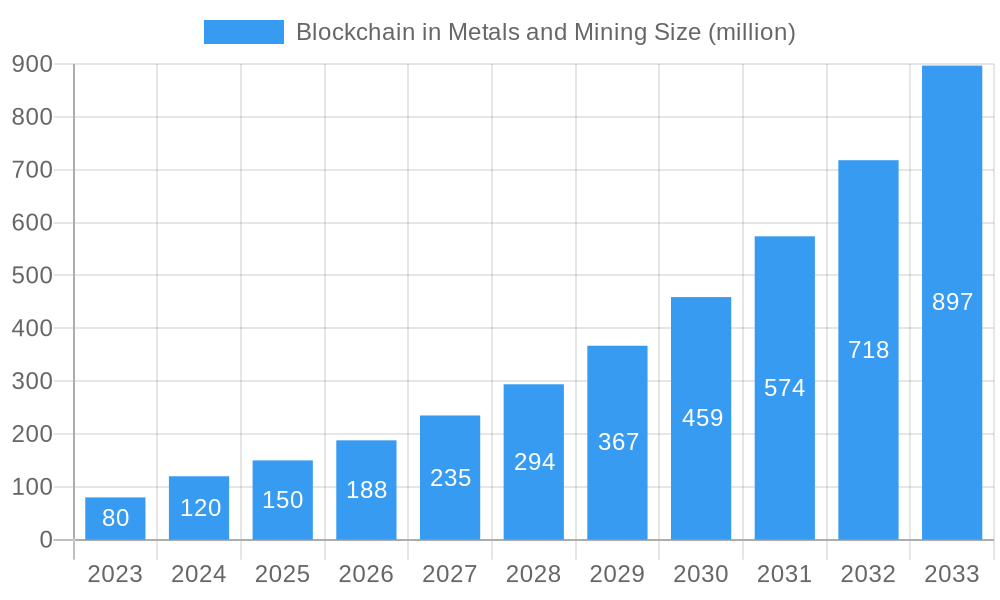
Blockchain in Metals and Mining Market Size (In Million)

The market's trajectory is further shaped by emerging trends such as the integration of IoT devices with blockchain for real-time data capture and the development of smart contracts to automate payments and compliance. These advancements are crucial for both the metal and mining industries, enabling better management of resources, improved financial settlements, and enhanced stakeholder engagement. While the potential is immense, restraints such as the high initial implementation costs, the need for industry-wide standardization, and the skilled workforce gap could pose challenges. However, the undeniable benefits of improved data integrity, reduced counterparty risk, and enhanced operational efficiency are expected to outweigh these hurdles, paving the way for widespread blockchain adoption across various applications, including supply chain management, financing, and commodity trading. The market's expansion will likely be concentrated in regions with significant mining operations and established financial infrastructure.
Blockchain in Metals and Mining Company Market Share
This comprehensive report provides an in-depth analysis of the global Blockchain in Metals and Mining market. Spanning a study period from 2019 to 2033, with a base year of 2025 and a forecast period of 2025-2033, this report offers critical insights into market dynamics, growth drivers, challenges, and emerging opportunities. It meticulously examines key segments such as the Metal Industry and Mining Industry, alongside blockchain types including Public Blockchain and Private Blockchain. The analysis is enriched by exploring industry developments and the strategic landscape of leading players like IBM, ING, Karuschain, MINESPIDER, Accenture, MineHub, Blockhead Technologies, Everledger, Minexx, Verisk, RCS Global Group, and others. Leveraging high-traffic keywords for enhanced search visibility, this report is an indispensable resource for industry stakeholders seeking to navigate the evolving blockchain adoption in the metals and mining sectors.
Blockchain in Metals and Mining Market Concentration & Innovation
The Blockchain in Metals and Mining market is characterized by a moderate to high level of concentration, driven by significant investments in technological innovation and a growing demand for enhanced supply chain transparency and traceability. Key innovation drivers include the need to combat illicit trade, improve provenance tracking of critical minerals, streamline financial transactions, and enhance regulatory compliance across complex global networks. Leading companies are investing heavily in developing robust platforms that leverage distributed ledger technology (DLT) to create immutable records of mining operations, metal sourcing, and trading activities. Regulatory frameworks, while still evolving, are increasingly recognizing the potential of blockchain to address challenges related to ethical sourcing and anti-money laundering (AML) in the precious metals sector. Product substitutes, such as traditional paper-based systems and centralized databases, are gradually being phased out as their inherent inefficiencies and vulnerabilities become apparent. End-user trends are leaning towards solutions that offer end-to-end visibility, from mine to market, ensuring fair trade practices and investor confidence. Mergers and acquisitions (M&A) activities are expected to play a crucial role in market consolidation, with estimated M&A deal values projected to reach billions of dollars over the forecast period as larger entities acquire innovative startups to expand their blockchain capabilities and market reach. For instance, the market share of companies actively developing blockchain solutions for supply chain management in the metals and mining sector is steadily increasing, demonstrating a clear shift towards digital transformation.
Blockchain in Metals and Mining Industry Trends & Insights
The global Blockchain in Metals and Mining market is poised for significant expansion, driven by a confluence of technological advancements, evolving industry demands, and increasing regulatory impetus. The market is projected to experience a robust Compound Annual Growth Rate (CAGR) of approximately 30-35% during the forecast period (2025-2033). This remarkable growth is fueled by the inherent capabilities of blockchain technology to address long-standing challenges within the metals and mining industries, including issues of transparency, traceability, security, and efficiency. The increasing demand for ethically sourced minerals, particularly in the context of electric vehicle batteries and renewable energy technologies, is a major catalyst. Consumers and regulators alike are demanding verifiable proof of origin and responsible mining practices, which blockchain solutions are ideally positioned to provide. Technological disruptions, such as the integration of IoT devices with blockchain for real-time data capture and the development of sophisticated smart contracts for automated transactions and compliance, are further accelerating adoption. Market penetration of blockchain solutions is still in its nascent stages, estimated to be around 5-10% currently, offering substantial room for growth. End-user preferences are shifting towards solutions that can reduce operational costs, mitigate risks associated with fraud and counterfeiting, and improve overall supply chain resilience. Competitive dynamics are intensifying as established technology providers, alongside specialized blockchain startups, vie for market leadership by offering tailored solutions for different segments of the metals and mining value chain, from exploration and extraction to refining and trading. The imperative for increased sustainability and corporate social responsibility is also pushing companies to adopt blockchain to demonstrate their commitment to ethical sourcing and environmental stewardship, thereby enhancing their brand reputation and investor appeal.
Dominant Markets & Segments in Blockchain in Metals and Mining
The Metal Industry segment is expected to dominate the Blockchain in Metals and Mining market, driven by the high value of traded commodities and the critical need for provenance and authenticity verification, especially for precious metals, rare earths, and conflict-free minerals. Within this segment, countries with significant metal processing and trading hubs, such as China, the United States, and European nations, will likely lead adoption. Key drivers for this dominance include stringent regulations on ethical sourcing and anti-money laundering, the presence of global financial institutions and trading platforms that can integrate blockchain solutions, and a strong demand for transparency from end-consumers in industries like automotive, electronics, and jewelry. Economic policies that encourage digital transformation and secure trade are also playing a pivotal role.
The Mining Industry, while a significant contributor, follows closely. The adoption here is driven by the need to improve operational efficiency, enhance safety, secure mining rights, and ensure responsible resource management. Countries with extensive mining operations, including Australia, Canada, Russia, and various African nations, are progressively exploring and implementing blockchain solutions. Infrastructure development supporting digital mining operations and the increasing focus on environmental, social, and governance (ESG) factors are crucial here.
Regarding blockchain types, Private Blockchains are projected to hold a larger market share in the near to medium term. This is primarily due to the sensitive nature of data within the metals and mining industries, where companies require greater control over network participation and data privacy. Private blockchains offer permissioned access, allowing only authorized entities to participate and view specific data, which is crucial for maintaining competitive advantages and ensuring confidentiality of proprietary information. Key drivers for private blockchain dominance include enhanced security, faster transaction speeds compared to public blockchains, and the ability to customize governance models to meet specific industry needs. Economic policies encouraging secure and controlled data sharing are also supporting this trend.
Public Blockchains, while offering greater decentralization and transparency, are expected to see adoption grow as the market matures and interoperability solutions improve. Their use cases are likely to expand in areas requiring broad public verification, such as carbon credit tracking, commodity certifications, and broader supply chain auditing where public accountability is paramount.
Blockchain in Metals and Mining Product Developments
Product developments in the Blockchain in Metals and Mining sector are increasingly focused on creating interoperable and scalable solutions that address specific industry pain points. Innovations include advanced DLT platforms for end-to-end supply chain tracking, from the point of extraction to the final consumer. These developments emphasize secure data sharing, automated compliance with evolving regulations, and enhanced fraud prevention. Competitive advantages are being carved out by solutions that integrate with existing enterprise resource planning (ERP) systems, leverage IoT for real-time data capture, and utilize smart contracts for streamlined financial settlements and provenance verification, offering unparalleled transparency and efficiency in the global metals and mining ecosystem.
Report Scope & Segmentation Analysis
This report meticulously segments the Blockchain in Metals and Mining market by Application and Type. The Application segmentation includes the Metal Industry and the Mining Industry. The Metal Industry segment, projected to be valued at over $500 million by 2025, encompasses applications in trading, refining, and supply chain management of various metals. The Mining Industry segment, anticipated to reach over $400 million by 2025, focuses on exploration, extraction, resource management, and operational efficiency.
The Type segmentation covers Public Blockchain and Private Blockchain. The Private Blockchain segment, estimated at over $600 million by 2025, offers controlled access and enhanced data privacy, crucial for sensitive industry data. The Public Blockchain segment, projected to exceed $300 million by 2025, provides broader decentralization and transparency, suitable for certain verification and certification applications. Growth projections indicate a higher CAGR for the Private Blockchain segment in the near term due to industry requirements for data security.
Key Drivers of Blockchain in Metals and Mining Growth
Several key factors are propelling the growth of the Blockchain in Metals and Mining market. Technological advancements in DLT and smart contract capabilities offer enhanced security, transparency, and efficiency in complex supply chains. The increasing demand for ethical and sustainable sourcing of minerals, particularly for critical components in green technologies, necessitates verifiable provenance tracking, which blockchain provides. Stringent regulatory frameworks concerning anti-money laundering (AML), conflict minerals, and environmental compliance are pushing companies towards immutable record-keeping solutions. Furthermore, the potential for cost reduction through streamlined processes, reduced fraud, and efficient dispute resolution is a significant economic driver. For instance, blockchain solutions are being developed to automate royalty payments and ensure fair compensation across the value chain, a crucial development for resource-rich nations.
Challenges in the Blockchain in Metals and Mining Sector
Despite its immense potential, the Blockchain in Metals and Mining sector faces several significant challenges. Regulatory uncertainty and fragmentation across different jurisdictions can hinder widespread adoption, creating compliance complexities. Scalability issues with certain blockchain platforms can limit their ability to handle the high volume of transactions in the global metals and mining trade. Interoperability between different blockchain networks and legacy systems remains a considerable hurdle, requiring significant investment in integration. Resistance to change from established stakeholders and the initial cost of implementing new technologies are also significant barriers. For example, the upfront investment for implementing a comprehensive blockchain solution for a multinational mining corporation can run into tens of millions of dollars.
Emerging Opportunities in Blockchain in Metals and Mining
Emerging opportunities in the Blockchain in Metals and Mining market are vast and transformative. The increasing focus on ESG (Environmental, Social, and Governance) compliance presents a significant avenue for blockchain solutions to track and verify a company's sustainability efforts, from carbon emissions reduction to fair labor practices. The development of decentralized finance (DeFi) applications within the mining sector, such as tokenized commodities for easier investment and trading, offers new avenues for capital formation and liquidity. The integration of Artificial Intelligence (AI) with blockchain can unlock advanced analytics for predictive maintenance, fraud detection, and optimized resource exploration. Furthermore, the growing demand for traceable critical minerals, driven by geopolitical considerations and the green energy transition, creates a substantial market for blockchain-based provenance solutions, potentially worth billions of dollars.
Leading Players in the Blockchain in Metals and Mining Market
- IBM
- ING
- Karuschain
- MINESPIDER
- Accenture
- MineHub
- Blockhead Technologies
- Everledger
- Minexx
- Verisk
- RCS Global Group
Key Developments in Blockchain in Metals and Mining Industry
- 2023: MineHub launched its blockchain-based platform to enhance transparency and efficiency in the global metals trading industry.
- 2023: IBM announced new blockchain solutions aimed at improving supply chain traceability for precious metals, partnering with several financial institutions.
- 2023: Karuschain secured significant funding to expand its blockchain solutions for the mining sector, focusing on provenance and regulatory compliance.
- 2024: Verisk introduced an advanced analytics platform leveraging blockchain for risk assessment in mineral exploration and supply chain security.
- 2024: ING continued its exploration of blockchain for cross-border payments in the commodity trading sector, including metals and mining.
- 2024: RCS Global Group expanded its ethical sourcing verification services by integrating blockchain technology to provide immutable audit trails.
- 2024: MINESPIDER unveiled a new feature for its platform, enabling real-time tracking of environmental impact in mining operations via blockchain.
- 2025: Accenture is anticipated to release a whitepaper detailing strategic recommendations for blockchain adoption in large-scale mining operations.
- 2025: Blockhead Technologies is expected to launch a pilot program for tokenizing mining assets on a private blockchain for enhanced investment opportunities.
- 2025: Everledger is projected to expand its focus on the responsible sourcing of industrial minerals through its blockchain-based digital identity solution.
- 2025: Minexx is expected to announce new partnerships to integrate its blockchain platform for precious metals with international commodity exchanges.
Strategic Outlook for Blockchain in Metals and Mining Market
The strategic outlook for the Blockchain in Metals and Mining market is overwhelmingly positive, characterized by sustained innovation and increasing adoption. The market is poised for significant growth, driven by the ongoing digital transformation within the industry and the persistent demand for greater transparency, security, and efficiency. Companies that proactively invest in and integrate blockchain solutions will gain a competitive edge by optimizing their operations, mitigating risks, and enhancing their brand reputation through verifiable ethical and sustainable practices. The expansion of public-private blockchain collaborations and the development of industry-wide standards will further accelerate adoption. The projected market size, reaching tens of billions of dollars by the end of the forecast period, underscores the transformative potential of blockchain in reshaping the future of metals and mining.
Blockchain in Metals and Mining Segmentation
-
1. Application
- 1.1. Metal Industry
- 1.2. Mining Industry
-
2. Types
- 2.1. Public Blockchain
- 2.2. Private Blockchain
Blockchain in Metals and Mining Segmentation By Geography
-
1. North America
- 1.1. United States
- 1.2. Canada
- 1.3. Mexico
-
2. South America
- 2.1. Brazil
- 2.2. Argentina
- 2.3. Rest of South America
-
3. Europe
- 3.1. United Kingdom
- 3.2. Germany
- 3.3. France
- 3.4. Italy
- 3.5. Spain
- 3.6. Russia
- 3.7. Benelux
- 3.8. Nordics
- 3.9. Rest of Europe
-
4. Middle East & Africa
- 4.1. Turkey
- 4.2. Israel
- 4.3. GCC
- 4.4. North Africa
- 4.5. South Africa
- 4.6. Rest of Middle East & Africa
-
5. Asia Pacific
- 5.1. China
- 5.2. India
- 5.3. Japan
- 5.4. South Korea
- 5.5. ASEAN
- 5.6. Oceania
- 5.7. Rest of Asia Pacific
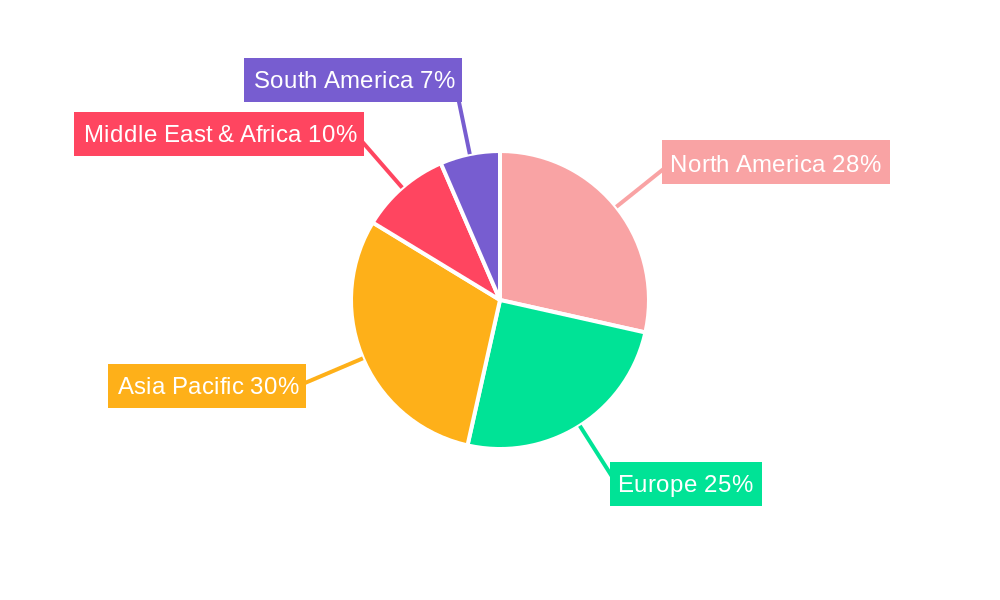
Blockchain in Metals and Mining Regional Market Share
Geographic Coverage of Blockchain in Metals and Mining
Blockchain in Metals and Mining REPORT HIGHLIGHTS
| Aspects | Details |
|---|---|
| Study Period | 2020-2034 |
| Base Year | 2025 |
| Estimated Year | 2026 |
| Forecast Period | 2026-2034 |
| Historical Period | 2020-2025 |
| Growth Rate | CAGR of XX% from 2020-2034 |
| Segmentation |
|
Table of Contents
- 1. Introduction
- 1.1. Research Scope
- 1.2. Market Segmentation
- 1.3. Research Methodology
- 1.4. Definitions and Assumptions
- 2. Executive Summary
- 2.1. Introduction
- 3. Market Dynamics
- 3.1. Introduction
- 3.2. Market Drivers
- 3.3. Market Restrains
- 3.4. Market Trends
- 4. Market Factor Analysis
- 4.1. Porters Five Forces
- 4.2. Supply/Value Chain
- 4.3. PESTEL analysis
- 4.4. Market Entropy
- 4.5. Patent/Trademark Analysis
- 5. Global Blockchain in Metals and Mining Analysis, Insights and Forecast, 2020-2032
- 5.1. Market Analysis, Insights and Forecast - by Application
- 5.1.1. Metal Industry
- 5.1.2. Mining Industry
- 5.2. Market Analysis, Insights and Forecast - by Types
- 5.2.1. Public Blockchain
- 5.2.2. Private Blockchain
- 5.3. Market Analysis, Insights and Forecast - by Region
- 5.3.1. North America
- 5.3.2. South America
- 5.3.3. Europe
- 5.3.4. Middle East & Africa
- 5.3.5. Asia Pacific
- 5.1. Market Analysis, Insights and Forecast - by Application
- 6. North America Blockchain in Metals and Mining Analysis, Insights and Forecast, 2020-2032
- 6.1. Market Analysis, Insights and Forecast - by Application
- 6.1.1. Metal Industry
- 6.1.2. Mining Industry
- 6.2. Market Analysis, Insights and Forecast - by Types
- 6.2.1. Public Blockchain
- 6.2.2. Private Blockchain
- 6.1. Market Analysis, Insights and Forecast - by Application
- 7. South America Blockchain in Metals and Mining Analysis, Insights and Forecast, 2020-2032
- 7.1. Market Analysis, Insights and Forecast - by Application
- 7.1.1. Metal Industry
- 7.1.2. Mining Industry
- 7.2. Market Analysis, Insights and Forecast - by Types
- 7.2.1. Public Blockchain
- 7.2.2. Private Blockchain
- 7.1. Market Analysis, Insights and Forecast - by Application
- 8. Europe Blockchain in Metals and Mining Analysis, Insights and Forecast, 2020-2032
- 8.1. Market Analysis, Insights and Forecast - by Application
- 8.1.1. Metal Industry
- 8.1.2. Mining Industry
- 8.2. Market Analysis, Insights and Forecast - by Types
- 8.2.1. Public Blockchain
- 8.2.2. Private Blockchain
- 8.1. Market Analysis, Insights and Forecast - by Application
- 9. Middle East & Africa Blockchain in Metals and Mining Analysis, Insights and Forecast, 2020-2032
- 9.1. Market Analysis, Insights and Forecast - by Application
- 9.1.1. Metal Industry
- 9.1.2. Mining Industry
- 9.2. Market Analysis, Insights and Forecast - by Types
- 9.2.1. Public Blockchain
- 9.2.2. Private Blockchain
- 9.1. Market Analysis, Insights and Forecast - by Application
- 10. Asia Pacific Blockchain in Metals and Mining Analysis, Insights and Forecast, 2020-2032
- 10.1. Market Analysis, Insights and Forecast - by Application
- 10.1.1. Metal Industry
- 10.1.2. Mining Industry
- 10.2. Market Analysis, Insights and Forecast - by Types
- 10.2.1. Public Blockchain
- 10.2.2. Private Blockchain
- 10.1. Market Analysis, Insights and Forecast - by Application
- 11. Competitive Analysis
- 11.1. Global Market Share Analysis 2025
- 11.2. Company Profiles
- 11.2.1 IBM
- 11.2.1.1. Overview
- 11.2.1.2. Products
- 11.2.1.3. SWOT Analysis
- 11.2.1.4. Recent Developments
- 11.2.1.5. Financials (Based on Availability)
- 11.2.2 ING
- 11.2.2.1. Overview
- 11.2.2.2. Products
- 11.2.2.3. SWOT Analysis
- 11.2.2.4. Recent Developments
- 11.2.2.5. Financials (Based on Availability)
- 11.2.3 Karuschain
- 11.2.3.1. Overview
- 11.2.3.2. Products
- 11.2.3.3. SWOT Analysis
- 11.2.3.4. Recent Developments
- 11.2.3.5. Financials (Based on Availability)
- 11.2.4 MINESPIDER
- 11.2.4.1. Overview
- 11.2.4.2. Products
- 11.2.4.3. SWOT Analysis
- 11.2.4.4. Recent Developments
- 11.2.4.5. Financials (Based on Availability)
- 11.2.5 Accenture
- 11.2.5.1. Overview
- 11.2.5.2. Products
- 11.2.5.3. SWOT Analysis
- 11.2.5.4. Recent Developments
- 11.2.5.5. Financials (Based on Availability)
- 11.2.6 MineHub
- 11.2.6.1. Overview
- 11.2.6.2. Products
- 11.2.6.3. SWOT Analysis
- 11.2.6.4. Recent Developments
- 11.2.6.5. Financials (Based on Availability)
- 11.2.7 Blockhead Technologies
- 11.2.7.1. Overview
- 11.2.7.2. Products
- 11.2.7.3. SWOT Analysis
- 11.2.7.4. Recent Developments
- 11.2.7.5. Financials (Based on Availability)
- 11.2.8 Everledger
- 11.2.8.1. Overview
- 11.2.8.2. Products
- 11.2.8.3. SWOT Analysis
- 11.2.8.4. Recent Developments
- 11.2.8.5. Financials (Based on Availability)
- 11.2.9 Minexx
- 11.2.9.1. Overview
- 11.2.9.2. Products
- 11.2.9.3. SWOT Analysis
- 11.2.9.4. Recent Developments
- 11.2.9.5. Financials (Based on Availability)
- 11.2.10 Verisk
- 11.2.10.1. Overview
- 11.2.10.2. Products
- 11.2.10.3. SWOT Analysis
- 11.2.10.4. Recent Developments
- 11.2.10.5. Financials (Based on Availability)
- 11.2.11 RCS Global Group
- 11.2.11.1. Overview
- 11.2.11.2. Products
- 11.2.11.3. SWOT Analysis
- 11.2.11.4. Recent Developments
- 11.2.11.5. Financials (Based on Availability)
- 11.2.1 IBM
List of Figures
- Figure 1: Global Blockchain in Metals and Mining Revenue Breakdown (million, %) by Region 2025 & 2033
- Figure 2: Global Blockchain in Metals and Mining Volume Breakdown (K, %) by Region 2025 & 2033
- Figure 3: North America Blockchain in Metals and Mining Revenue (million), by Application 2025 & 2033
- Figure 4: North America Blockchain in Metals and Mining Volume (K), by Application 2025 & 2033
- Figure 5: North America Blockchain in Metals and Mining Revenue Share (%), by Application 2025 & 2033
- Figure 6: North America Blockchain in Metals and Mining Volume Share (%), by Application 2025 & 2033
- Figure 7: North America Blockchain in Metals and Mining Revenue (million), by Types 2025 & 2033
- Figure 8: North America Blockchain in Metals and Mining Volume (K), by Types 2025 & 2033
- Figure 9: North America Blockchain in Metals and Mining Revenue Share (%), by Types 2025 & 2033
- Figure 10: North America Blockchain in Metals and Mining Volume Share (%), by Types 2025 & 2033
- Figure 11: North America Blockchain in Metals and Mining Revenue (million), by Country 2025 & 2033
- Figure 12: North America Blockchain in Metals and Mining Volume (K), by Country 2025 & 2033
- Figure 13: North America Blockchain in Metals and Mining Revenue Share (%), by Country 2025 & 2033
- Figure 14: North America Blockchain in Metals and Mining Volume Share (%), by Country 2025 & 2033
- Figure 15: South America Blockchain in Metals and Mining Revenue (million), by Application 2025 & 2033
- Figure 16: South America Blockchain in Metals and Mining Volume (K), by Application 2025 & 2033
- Figure 17: South America Blockchain in Metals and Mining Revenue Share (%), by Application 2025 & 2033
- Figure 18: South America Blockchain in Metals and Mining Volume Share (%), by Application 2025 & 2033
- Figure 19: South America Blockchain in Metals and Mining Revenue (million), by Types 2025 & 2033
- Figure 20: South America Blockchain in Metals and Mining Volume (K), by Types 2025 & 2033
- Figure 21: South America Blockchain in Metals and Mining Revenue Share (%), by Types 2025 & 2033
- Figure 22: South America Blockchain in Metals and Mining Volume Share (%), by Types 2025 & 2033
- Figure 23: South America Blockchain in Metals and Mining Revenue (million), by Country 2025 & 2033
- Figure 24: South America Blockchain in Metals and Mining Volume (K), by Country 2025 & 2033
- Figure 25: South America Blockchain in Metals and Mining Revenue Share (%), by Country 2025 & 2033
- Figure 26: South America Blockchain in Metals and Mining Volume Share (%), by Country 2025 & 2033
- Figure 27: Europe Blockchain in Metals and Mining Revenue (million), by Application 2025 & 2033
- Figure 28: Europe Blockchain in Metals and Mining Volume (K), by Application 2025 & 2033
- Figure 29: Europe Blockchain in Metals and Mining Revenue Share (%), by Application 2025 & 2033
- Figure 30: Europe Blockchain in Metals and Mining Volume Share (%), by Application 2025 & 2033
- Figure 31: Europe Blockchain in Metals and Mining Revenue (million), by Types 2025 & 2033
- Figure 32: Europe Blockchain in Metals and Mining Volume (K), by Types 2025 & 2033
- Figure 33: Europe Blockchain in Metals and Mining Revenue Share (%), by Types 2025 & 2033
- Figure 34: Europe Blockchain in Metals and Mining Volume Share (%), by Types 2025 & 2033
- Figure 35: Europe Blockchain in Metals and Mining Revenue (million), by Country 2025 & 2033
- Figure 36: Europe Blockchain in Metals and Mining Volume (K), by Country 2025 & 2033
- Figure 37: Europe Blockchain in Metals and Mining Revenue Share (%), by Country 2025 & 2033
- Figure 38: Europe Blockchain in Metals and Mining Volume Share (%), by Country 2025 & 2033
- Figure 39: Middle East & Africa Blockchain in Metals and Mining Revenue (million), by Application 2025 & 2033
- Figure 40: Middle East & Africa Blockchain in Metals and Mining Volume (K), by Application 2025 & 2033
- Figure 41: Middle East & Africa Blockchain in Metals and Mining Revenue Share (%), by Application 2025 & 2033
- Figure 42: Middle East & Africa Blockchain in Metals and Mining Volume Share (%), by Application 2025 & 2033
- Figure 43: Middle East & Africa Blockchain in Metals and Mining Revenue (million), by Types 2025 & 2033
- Figure 44: Middle East & Africa Blockchain in Metals and Mining Volume (K), by Types 2025 & 2033
- Figure 45: Middle East & Africa Blockchain in Metals and Mining Revenue Share (%), by Types 2025 & 2033
- Figure 46: Middle East & Africa Blockchain in Metals and Mining Volume Share (%), by Types 2025 & 2033
- Figure 47: Middle East & Africa Blockchain in Metals and Mining Revenue (million), by Country 2025 & 2033
- Figure 48: Middle East & Africa Blockchain in Metals and Mining Volume (K), by Country 2025 & 2033
- Figure 49: Middle East & Africa Blockchain in Metals and Mining Revenue Share (%), by Country 2025 & 2033
- Figure 50: Middle East & Africa Blockchain in Metals and Mining Volume Share (%), by Country 2025 & 2033
- Figure 51: Asia Pacific Blockchain in Metals and Mining Revenue (million), by Application 2025 & 2033
- Figure 52: Asia Pacific Blockchain in Metals and Mining Volume (K), by Application 2025 & 2033
- Figure 53: Asia Pacific Blockchain in Metals and Mining Revenue Share (%), by Application 2025 & 2033
- Figure 54: Asia Pacific Blockchain in Metals and Mining Volume Share (%), by Application 2025 & 2033
- Figure 55: Asia Pacific Blockchain in Metals and Mining Revenue (million), by Types 2025 & 2033
- Figure 56: Asia Pacific Blockchain in Metals and Mining Volume (K), by Types 2025 & 2033
- Figure 57: Asia Pacific Blockchain in Metals and Mining Revenue Share (%), by Types 2025 & 2033
- Figure 58: Asia Pacific Blockchain in Metals and Mining Volume Share (%), by Types 2025 & 2033
- Figure 59: Asia Pacific Blockchain in Metals and Mining Revenue (million), by Country 2025 & 2033
- Figure 60: Asia Pacific Blockchain in Metals and Mining Volume (K), by Country 2025 & 2033
- Figure 61: Asia Pacific Blockchain in Metals and Mining Revenue Share (%), by Country 2025 & 2033
- Figure 62: Asia Pacific Blockchain in Metals and Mining Volume Share (%), by Country 2025 & 2033
List of Tables
- Table 1: Global Blockchain in Metals and Mining Revenue million Forecast, by Application 2020 & 2033
- Table 2: Global Blockchain in Metals and Mining Volume K Forecast, by Application 2020 & 2033
- Table 3: Global Blockchain in Metals and Mining Revenue million Forecast, by Types 2020 & 2033
- Table 4: Global Blockchain in Metals and Mining Volume K Forecast, by Types 2020 & 2033
- Table 5: Global Blockchain in Metals and Mining Revenue million Forecast, by Region 2020 & 2033
- Table 6: Global Blockchain in Metals and Mining Volume K Forecast, by Region 2020 & 2033
- Table 7: Global Blockchain in Metals and Mining Revenue million Forecast, by Application 2020 & 2033
- Table 8: Global Blockchain in Metals and Mining Volume K Forecast, by Application 2020 & 2033
- Table 9: Global Blockchain in Metals and Mining Revenue million Forecast, by Types 2020 & 2033
- Table 10: Global Blockchain in Metals and Mining Volume K Forecast, by Types 2020 & 2033
- Table 11: Global Blockchain in Metals and Mining Revenue million Forecast, by Country 2020 & 2033
- Table 12: Global Blockchain in Metals and Mining Volume K Forecast, by Country 2020 & 2033
- Table 13: United States Blockchain in Metals and Mining Revenue (million) Forecast, by Application 2020 & 2033
- Table 14: United States Blockchain in Metals and Mining Volume (K) Forecast, by Application 2020 & 2033
- Table 15: Canada Blockchain in Metals and Mining Revenue (million) Forecast, by Application 2020 & 2033
- Table 16: Canada Blockchain in Metals and Mining Volume (K) Forecast, by Application 2020 & 2033
- Table 17: Mexico Blockchain in Metals and Mining Revenue (million) Forecast, by Application 2020 & 2033
- Table 18: Mexico Blockchain in Metals and Mining Volume (K) Forecast, by Application 2020 & 2033
- Table 19: Global Blockchain in Metals and Mining Revenue million Forecast, by Application 2020 & 2033
- Table 20: Global Blockchain in Metals and Mining Volume K Forecast, by Application 2020 & 2033
- Table 21: Global Blockchain in Metals and Mining Revenue million Forecast, by Types 2020 & 2033
- Table 22: Global Blockchain in Metals and Mining Volume K Forecast, by Types 2020 & 2033
- Table 23: Global Blockchain in Metals and Mining Revenue million Forecast, by Country 2020 & 2033
- Table 24: Global Blockchain in Metals and Mining Volume K Forecast, by Country 2020 & 2033
- Table 25: Brazil Blockchain in Metals and Mining Revenue (million) Forecast, by Application 2020 & 2033
- Table 26: Brazil Blockchain in Metals and Mining Volume (K) Forecast, by Application 2020 & 2033
- Table 27: Argentina Blockchain in Metals and Mining Revenue (million) Forecast, by Application 2020 & 2033
- Table 28: Argentina Blockchain in Metals and Mining Volume (K) Forecast, by Application 2020 & 2033
- Table 29: Rest of South America Blockchain in Metals and Mining Revenue (million) Forecast, by Application 2020 & 2033
- Table 30: Rest of South America Blockchain in Metals and Mining Volume (K) Forecast, by Application 2020 & 2033
- Table 31: Global Blockchain in Metals and Mining Revenue million Forecast, by Application 2020 & 2033
- Table 32: Global Blockchain in Metals and Mining Volume K Forecast, by Application 2020 & 2033
- Table 33: Global Blockchain in Metals and Mining Revenue million Forecast, by Types 2020 & 2033
- Table 34: Global Blockchain in Metals and Mining Volume K Forecast, by Types 2020 & 2033
- Table 35: Global Blockchain in Metals and Mining Revenue million Forecast, by Country 2020 & 2033
- Table 36: Global Blockchain in Metals and Mining Volume K Forecast, by Country 2020 & 2033
- Table 37: United Kingdom Blockchain in Metals and Mining Revenue (million) Forecast, by Application 2020 & 2033
- Table 38: United Kingdom Blockchain in Metals and Mining Volume (K) Forecast, by Application 2020 & 2033
- Table 39: Germany Blockchain in Metals and Mining Revenue (million) Forecast, by Application 2020 & 2033
- Table 40: Germany Blockchain in Metals and Mining Volume (K) Forecast, by Application 2020 & 2033
- Table 41: France Blockchain in Metals and Mining Revenue (million) Forecast, by Application 2020 & 2033
- Table 42: France Blockchain in Metals and Mining Volume (K) Forecast, by Application 2020 & 2033
- Table 43: Italy Blockchain in Metals and Mining Revenue (million) Forecast, by Application 2020 & 2033
- Table 44: Italy Blockchain in Metals and Mining Volume (K) Forecast, by Application 2020 & 2033
- Table 45: Spain Blockchain in Metals and Mining Revenue (million) Forecast, by Application 2020 & 2033
- Table 46: Spain Blockchain in Metals and Mining Volume (K) Forecast, by Application 2020 & 2033
- Table 47: Russia Blockchain in Metals and Mining Revenue (million) Forecast, by Application 2020 & 2033
- Table 48: Russia Blockchain in Metals and Mining Volume (K) Forecast, by Application 2020 & 2033
- Table 49: Benelux Blockchain in Metals and Mining Revenue (million) Forecast, by Application 2020 & 2033
- Table 50: Benelux Blockchain in Metals and Mining Volume (K) Forecast, by Application 2020 & 2033
- Table 51: Nordics Blockchain in Metals and Mining Revenue (million) Forecast, by Application 2020 & 2033
- Table 52: Nordics Blockchain in Metals and Mining Volume (K) Forecast, by Application 2020 & 2033
- Table 53: Rest of Europe Blockchain in Metals and Mining Revenue (million) Forecast, by Application 2020 & 2033
- Table 54: Rest of Europe Blockchain in Metals and Mining Volume (K) Forecast, by Application 2020 & 2033
- Table 55: Global Blockchain in Metals and Mining Revenue million Forecast, by Application 2020 & 2033
- Table 56: Global Blockchain in Metals and Mining Volume K Forecast, by Application 2020 & 2033
- Table 57: Global Blockchain in Metals and Mining Revenue million Forecast, by Types 2020 & 2033
- Table 58: Global Blockchain in Metals and Mining Volume K Forecast, by Types 2020 & 2033
- Table 59: Global Blockchain in Metals and Mining Revenue million Forecast, by Country 2020 & 2033
- Table 60: Global Blockchain in Metals and Mining Volume K Forecast, by Country 2020 & 2033
- Table 61: Turkey Blockchain in Metals and Mining Revenue (million) Forecast, by Application 2020 & 2033
- Table 62: Turkey Blockchain in Metals and Mining Volume (K) Forecast, by Application 2020 & 2033
- Table 63: Israel Blockchain in Metals and Mining Revenue (million) Forecast, by Application 2020 & 2033
- Table 64: Israel Blockchain in Metals and Mining Volume (K) Forecast, by Application 2020 & 2033
- Table 65: GCC Blockchain in Metals and Mining Revenue (million) Forecast, by Application 2020 & 2033
- Table 66: GCC Blockchain in Metals and Mining Volume (K) Forecast, by Application 2020 & 2033
- Table 67: North Africa Blockchain in Metals and Mining Revenue (million) Forecast, by Application 2020 & 2033
- Table 68: North Africa Blockchain in Metals and Mining Volume (K) Forecast, by Application 2020 & 2033
- Table 69: South Africa Blockchain in Metals and Mining Revenue (million) Forecast, by Application 2020 & 2033
- Table 70: South Africa Blockchain in Metals and Mining Volume (K) Forecast, by Application 2020 & 2033
- Table 71: Rest of Middle East & Africa Blockchain in Metals and Mining Revenue (million) Forecast, by Application 2020 & 2033
- Table 72: Rest of Middle East & Africa Blockchain in Metals and Mining Volume (K) Forecast, by Application 2020 & 2033
- Table 73: Global Blockchain in Metals and Mining Revenue million Forecast, by Application 2020 & 2033
- Table 74: Global Blockchain in Metals and Mining Volume K Forecast, by Application 2020 & 2033
- Table 75: Global Blockchain in Metals and Mining Revenue million Forecast, by Types 2020 & 2033
- Table 76: Global Blockchain in Metals and Mining Volume K Forecast, by Types 2020 & 2033
- Table 77: Global Blockchain in Metals and Mining Revenue million Forecast, by Country 2020 & 2033
- Table 78: Global Blockchain in Metals and Mining Volume K Forecast, by Country 2020 & 2033
- Table 79: China Blockchain in Metals and Mining Revenue (million) Forecast, by Application 2020 & 2033
- Table 80: China Blockchain in Metals and Mining Volume (K) Forecast, by Application 2020 & 2033
- Table 81: India Blockchain in Metals and Mining Revenue (million) Forecast, by Application 2020 & 2033
- Table 82: India Blockchain in Metals and Mining Volume (K) Forecast, by Application 2020 & 2033
- Table 83: Japan Blockchain in Metals and Mining Revenue (million) Forecast, by Application 2020 & 2033
- Table 84: Japan Blockchain in Metals and Mining Volume (K) Forecast, by Application 2020 & 2033
- Table 85: South Korea Blockchain in Metals and Mining Revenue (million) Forecast, by Application 2020 & 2033
- Table 86: South Korea Blockchain in Metals and Mining Volume (K) Forecast, by Application 2020 & 2033
- Table 87: ASEAN Blockchain in Metals and Mining Revenue (million) Forecast, by Application 2020 & 2033
- Table 88: ASEAN Blockchain in Metals and Mining Volume (K) Forecast, by Application 2020 & 2033
- Table 89: Oceania Blockchain in Metals and Mining Revenue (million) Forecast, by Application 2020 & 2033
- Table 90: Oceania Blockchain in Metals and Mining Volume (K) Forecast, by Application 2020 & 2033
- Table 91: Rest of Asia Pacific Blockchain in Metals and Mining Revenue (million) Forecast, by Application 2020 & 2033
- Table 92: Rest of Asia Pacific Blockchain in Metals and Mining Volume (K) Forecast, by Application 2020 & 2033
Frequently Asked Questions
1. What is the projected Compound Annual Growth Rate (CAGR) of the Blockchain in Metals and Mining?
The projected CAGR is approximately XX%.
2. Which companies are prominent players in the Blockchain in Metals and Mining?
Key companies in the market include IBM, ING, Karuschain, MINESPIDER, Accenture, MineHub, Blockhead Technologies, Everledger, Minexx, Verisk, RCS Global Group.
3. What are the main segments of the Blockchain in Metals and Mining?
The market segments include Application, Types.
4. Can you provide details about the market size?
The market size is estimated to be USD XXX million as of 2022.
5. What are some drivers contributing to market growth?
N/A
6. What are the notable trends driving market growth?
N/A
7. Are there any restraints impacting market growth?
N/A
8. Can you provide examples of recent developments in the market?
N/A
9. What pricing options are available for accessing the report?
Pricing options include single-user, multi-user, and enterprise licenses priced at USD 3350.00, USD 5025.00, and USD 6700.00 respectively.
10. Is the market size provided in terms of value or volume?
The market size is provided in terms of value, measured in million and volume, measured in K.
11. Are there any specific market keywords associated with the report?
Yes, the market keyword associated with the report is "Blockchain in Metals and Mining," which aids in identifying and referencing the specific market segment covered.
12. How do I determine which pricing option suits my needs best?
The pricing options vary based on user requirements and access needs. Individual users may opt for single-user licenses, while businesses requiring broader access may choose multi-user or enterprise licenses for cost-effective access to the report.
13. Are there any additional resources or data provided in the Blockchain in Metals and Mining report?
While the report offers comprehensive insights, it's advisable to review the specific contents or supplementary materials provided to ascertain if additional resources or data are available.
14. How can I stay updated on further developments or reports in the Blockchain in Metals and Mining?
To stay informed about further developments, trends, and reports in the Blockchain in Metals and Mining, consider subscribing to industry newsletters, following relevant companies and organizations, or regularly checking reputable industry news sources and publications.
Methodology
Step 1 - Identification of Relevant Samples Size from Population Database


Step 2 - Approaches for Defining Global Market Size (Value, Volume* & Price*)

Note*: In applicable scenarios
Step 3 - Data Sources
Primary Research
- Web Analytics
- Survey Reports
- Research Institute
- Latest Research Reports
- Opinion Leaders
Secondary Research
- Annual Reports
- White Paper
- Latest Press Release
- Industry Association
- Paid Database
- Investor Presentations

Step 4 - Data Triangulation
Involves using different sources of information in order to increase the validity of a study
These sources are likely to be stakeholders in a program - participants, other researchers, program staff, other community members, and so on.
Then we put all data in single framework & apply various statistical tools to find out the dynamic on the market.
During the analysis stage, feedback from the stakeholder groups would be compared to determine areas of agreement as well as areas of divergence