

Key Insights
The US Hazardous Location LED Lighting market is poised for substantial growth, projected to reach an estimated $2.5 billion in 2025. This expansion is fueled by an impressive Compound Annual Growth Rate (CAGR) of 8% anticipated over the forecast period of 2025-2033. The increasing demand for enhanced safety and efficiency in environments with flammable or explosive atmospheres is a primary driver. Industries such as Oil & Gas and Petrochemical, where the risk of ignition is ever-present, are heavily investing in robust and reliable LED lighting solutions that minimize heat generation and offer superior longevity compared to traditional lighting. Furthermore, stringent regulatory compliances and the growing awareness of the energy-saving benefits of LED technology are compelling businesses across various sectors, including industrial manufacturing and power generation, to upgrade their existing infrastructure with hazardous location-certified LED fixtures. The trend towards smart lighting integration, offering remote monitoring and control capabilities, is also a significant contributor to market expansion.

US Hazardous Location LED Lighting Industry Market Size (In Billion)
The market is segmented across various device types, including Zone 0, Zone 1, Zone 2, Zone 20, and Zone 22, catering to a wide spectrum of hazardous conditions. While the Oil & Gas and Petrochemical sectors represent the largest end-user segments, the Pharmaceutical and Industrial verticals are also demonstrating considerable growth potential as they increasingly adopt advanced safety protocols. Key players like ABB Installation Products Inc., GE Current, and Emerson Electric Co. are at the forefront, driving innovation and offering a diverse range of certified lighting solutions. Despite the strong growth trajectory, certain restraints, such as the initial high cost of specialized hazardous location LED fixtures and the complexity of installation in some environments, need to be addressed. However, the long-term cost savings through reduced energy consumption and lower maintenance requirements are expected to outweigh these initial challenges, ensuring a sustained upward trend for the US Hazardous Location LED Lighting market.

US Hazardous Location LED Lighting Industry Company Market Share
US Hazardous Location LED Lighting Industry Market Concentration & Innovation
The US Hazardous Location LED Lighting Industry exhibits a moderately concentrated market landscape, with a few prominent players vying for significant market share. Innovation is a key differentiator, driven by escalating demand for enhanced safety standards, energy efficiency, and extended product lifecycles in intrinsically hazardous environments. Regulatory frameworks, such as those mandated by OSHA and ATEX equivalents, play a pivotal role in shaping product development and adoption, ensuring compliance with stringent safety protocols. The presence of viable product substitutes, though less prevalent in highly critical applications, necessitates continuous technological advancement. End-user trends point towards a growing preference for smart, connected lighting solutions that offer remote monitoring and control capabilities, further boosting innovation. Mergers and acquisitions (M&A) are observed as strategic moves to consolidate market presence and acquire specialized technological expertise, with M&A deal values estimated to reach approximately $2.5 billion within the study period. Key players like Nemalux Inc., ABB Installation Products Inc., and Eaton Corporation are at the forefront of these innovation and consolidation efforts.
US Hazardous Location LED Lighting Industry Industry Trends & Insights
The US Hazardous Location LED Lighting Industry is poised for robust growth, propelled by a confluence of compelling market growth drivers. A significant CAGR of approximately 8.7% is projected over the forecast period of 2025–2033, a testament to the increasing demand for safer and more efficient illumination solutions in environments where flammable gases, vapors, or dust are present. Technological disruptions are central to this upward trajectory, with the relentless advancement of LED technology offering superior performance, reduced energy consumption, and extended operational life compared to traditional lighting. These advancements directly address the stringent requirements of end-user verticals such as Oil and Gas, Petrochemical, and Power Generation, which are undergoing significant modernization and safety upgrades. Consumer preferences are increasingly shifting towards integrated safety systems, where intelligent hazardous location lighting plays a critical role in preventing potential catastrophic events. The market penetration of LED solutions in these hazardous zones is steadily increasing, displacing older, less reliable technologies. Competitive dynamics are intensifying, with companies investing heavily in R&D to develop specialized lighting fixtures that meet diverse zone classifications (Zone 0, Zone 1, Zone 2, Zone 20, Zone 21, Zone 22) and offer advanced features like explosion-proofing, corrosion resistance, and superior ingress protection. The historical period of 2019–2024 saw steady adoption, laying the groundwork for accelerated growth in the base year of 2025 and beyond. The estimated market size for the base year 2025 is projected to be in the billions of dollars, with further substantial expansion anticipated.
Dominant Markets & Segments in US Hazardous Location LED Lighting Industry
The US Hazardous Location LED Lighting Industry is characterized by significant dominance within specific end-user verticals and device types. The Oil and Gas sector stands out as a leading market, driven by extensive exploration, production, and refining operations that inherently involve highly volatile environments. Robust investment in infrastructure upgrades and stringent safety regulations in this industry necessitate the widespread adoption of reliable hazardous location lighting. The Petrochemical industry closely follows, with similar demands for explosion-proof and intrinsically safe lighting solutions due to the handling of flammable chemicals.
Within Device Type segmentation, Zone 1 and Zone 2 classifications represent the largest market share, as these zones are more commonly encountered in industrial settings compared to the ultra-high-risk Zone 0 and Zone 20. The ongoing replacement of traditional lighting with advanced LED technology in these prevalent zones is a key market driver. Furthermore, the Industrial sector, encompassing a broad range of manufacturing facilities that handle potentially hazardous materials, contributes significantly to market demand across various zone classifications.
- Key Drivers for Dominant Markets:
- Stringent Safety Regulations: Mandates from regulatory bodies like OSHA and EPA enforce the use of certified hazardous location lighting to prevent ignition sources.
- Technological Advancements in LED: Improved energy efficiency, longer lifespan, and enhanced durability of LED fixtures make them a preferred choice.
- Infrastructure Modernization: Significant capital investments in upgrading existing facilities and building new plants in the Oil & Gas and Petrochemical sectors.
- Increased Focus on Worker Safety: A proactive approach to minimizing workplace accidents and ensuring employee well-being.
- Cost-Effectiveness: While initial investment might be higher, the reduced energy consumption and maintenance costs of LED lighting offer substantial long-term savings.
The dominance analysis reveals that regions with a high concentration of Oil and Gas, Petrochemical, and heavy Industrial activities are the primary consumers of hazardous location LED lighting. Economic policies supporting industrial growth and infrastructure development further bolster demand in these segments. The Processing industry also presents a growing market, with advancements in process control and automation requiring reliable illumination in potentially hazardous conditions. While Power Generation and Pharmaceutical industries also utilize these specialized lights, their demand is relatively lower compared to the energy and heavy manufacturing sectors.
US Hazardous Location LED Lighting Industry Product Developments
Product developments in the US Hazardous Location LED Lighting Industry are centered on enhancing safety, efficiency, and intelligence. Innovations include explosion-proof LED fixtures with advanced thermal management for extended lifespan, integrated emergency lighting functionalities, and corrosion-resistant materials for harsh environments. The development of smart hazardous location lighting, featuring IoT connectivity for remote monitoring, diagnostics, and predictive maintenance, is a significant trend. These products offer superior illumination quality and energy savings, providing a competitive advantage by meeting increasingly stringent safety standards and operational demands across diverse hazardous zones.
Report Scope & Segmentation Analysis
This report provides a comprehensive analysis of the US Hazardous Location LED Lighting Industry, segmenting the market by Device Type and End-User Vertical.
- Device Type Segmentation: The market is meticulously analyzed across Zone 0, Zone 20, Zone 1, Zone 21, and Zone 22 classifications, with detailed insights into the specific lighting requirements and market dynamics for each. Projections indicate robust growth for Zone 1 and Zone 2, owing to their prevalence in industrial applications.
- End-User Vertical Segmentation: Key end-user industries examined include Oil and Gas, Petro Chemical, Industrial, Power Generation, Pharmaceutical, and Processing, along with Other End-user Industries. The Oil and Gas and Petrochemical sectors are projected to hold the largest market share due to inherent safety risks. Competitive dynamics within each segment are thoroughly assessed, highlighting growth opportunities and market penetration rates.
Key Drivers of US Hazardous Location LED Lighting Industry Growth
The growth of the US Hazardous Location LED Lighting Industry is primarily fueled by stringent regulatory mandates for workplace safety, compelling industries to invest in certified explosion-proof and intrinsically safe lighting solutions. Technological advancements in LED technology, offering superior energy efficiency, extended lifespan, and enhanced illumination compared to traditional lighting, are a significant driver. Furthermore, the ongoing modernization of infrastructure within the Oil & Gas, Petrochemical, and general Industrial sectors, coupled with a heightened corporate focus on worker safety and operational continuity, further propels market expansion. The pursuit of reduced operational costs through energy savings and decreased maintenance also incentivizes the adoption of LED solutions.
Challenges in the US Hazardous Location LED Lighting Industry Sector
Despite robust growth, the US Hazardous Location LED Lighting Industry faces several challenges. Stringent and evolving regulatory frameworks, while essential for safety, can lead to increased compliance costs and product certification delays. Supply chain disruptions and the volatility of raw material prices can impact production costs and availability. Intense competition among established players and new entrants can lead to price pressures. Moreover, the high initial investment cost for specialized hazardous location LED fixtures can be a barrier for some smaller enterprises, even with long-term cost savings. The need for specialized installation expertise also presents a logistical challenge.
Emerging Opportunities in US Hazardous Location LED Lighting Industry
Emerging opportunities in the US Hazardous Location LED Lighting Industry are driven by the increasing adoption of smart technologies and the expansion into new end-user applications. The integration of IoT capabilities for remote monitoring, diagnostics, and predictive maintenance in hazardous environments presents a significant growth avenue. The development of specialized lighting solutions for emerging industries, such as advanced manufacturing and data centers with specific environmental controls, also offers untapped potential. Furthermore, the growing demand for sustainable and energy-efficient solutions, coupled with government incentives for green technologies, will continue to shape market opportunities. The trend towards miniaturization and enhanced ruggedness in lighting fixtures for confined or challenging spaces also presents a fertile ground for innovation.
Leading Players in the US Hazardous Location LED Lighting Industry Market
- Nemalux Inc.
- ABB Installation Products Inc.
- Azz Inc.
- Worksite Lighting LLC
- Larson Electronics
- GE Current
- Hubbell Limited
- Emerson Electric Co
- Digital Lumens Inc (OSRAM)
- Eaton Corporation
Key Developments in US Hazardous Location LED Lighting Industry Industry
- 2024: Nemalux Inc. launches a new series of ultra-high-performance explosion-proof LED floodlights with enhanced lumen output and energy efficiency.
- 2023: Eaton Corporation acquires a specialized manufacturer of intrinsically safe lighting solutions, strengthening its hazardous location product portfolio.
- 2023: GE Current introduces an IoT-enabled hazardous location lighting system with advanced remote monitoring capabilities for the Oil & Gas sector.
- 2022: Larson Electronics develops custom LED lighting solutions for Zone 0 applications in the petrochemical industry, featuring extreme temperature resilience.
- 2021: ABB Installation Products Inc. expands its range of ATEX-certified LED luminaires for hazardous areas, focusing on improved corrosion resistance.
- 2020: Digital Lumens Inc. (OSRAM) enhances its smart hazardous location lighting platform with AI-driven predictive maintenance features.
Strategic Outlook for US Hazardous Location LED Lighting Industry Market
The strategic outlook for the US Hazardous Location LED Lighting Industry is highly positive, driven by an unwavering commitment to safety and efficiency. Continued innovation in smart, connected lighting solutions will be crucial for competitive differentiation, offering enhanced operational control and reduced risk in hazardous environments. The industry will witness further consolidation through strategic acquisitions as companies seek to expand their technological capabilities and market reach. Growth catalysts include the increasing demand for energy-efficient solutions, the ongoing modernization of critical infrastructure, and the development of specialized lighting for niche applications within burgeoning sectors. The increasing global emphasis on stringent safety standards will continue to fuel demand, positioning the US market for sustained expansion.
US Hazardous Location LED Lighting Industry Segmentation
-
1. Device Type
- 1.1. Zone 0
- 1.2. Zone 20
- 1.3. Zone 1
- 1.4. Zone 21
- 1.5. Zone 22
-
2. End-User Vertical
- 2.1. Oil and Gas
- 2.2. Petro Chemical
- 2.3. Industrial
- 2.4. Power Generation
- 2.5. Pharmaceutical
- 2.6. Processing
- 2.7. Other End-user Industries
US Hazardous Location LED Lighting Industry Segmentation By Geography
-
1. North America
- 1.1. United States
- 1.2. Canada
- 1.3. Mexico
-
2. South America
- 2.1. Brazil
- 2.2. Argentina
- 2.3. Rest of South America
-
3. Europe
- 3.1. United Kingdom
- 3.2. Germany
- 3.3. France
- 3.4. Italy
- 3.5. Spain
- 3.6. Russia
- 3.7. Benelux
- 3.8. Nordics
- 3.9. Rest of Europe
-
4. Middle East & Africa
- 4.1. Turkey
- 4.2. Israel
- 4.3. GCC
- 4.4. North Africa
- 4.5. South Africa
- 4.6. Rest of Middle East & Africa
-
5. Asia Pacific
- 5.1. China
- 5.2. India
- 5.3. Japan
- 5.4. South Korea
- 5.5. ASEAN
- 5.6. Oceania
- 5.7. Rest of Asia Pacific
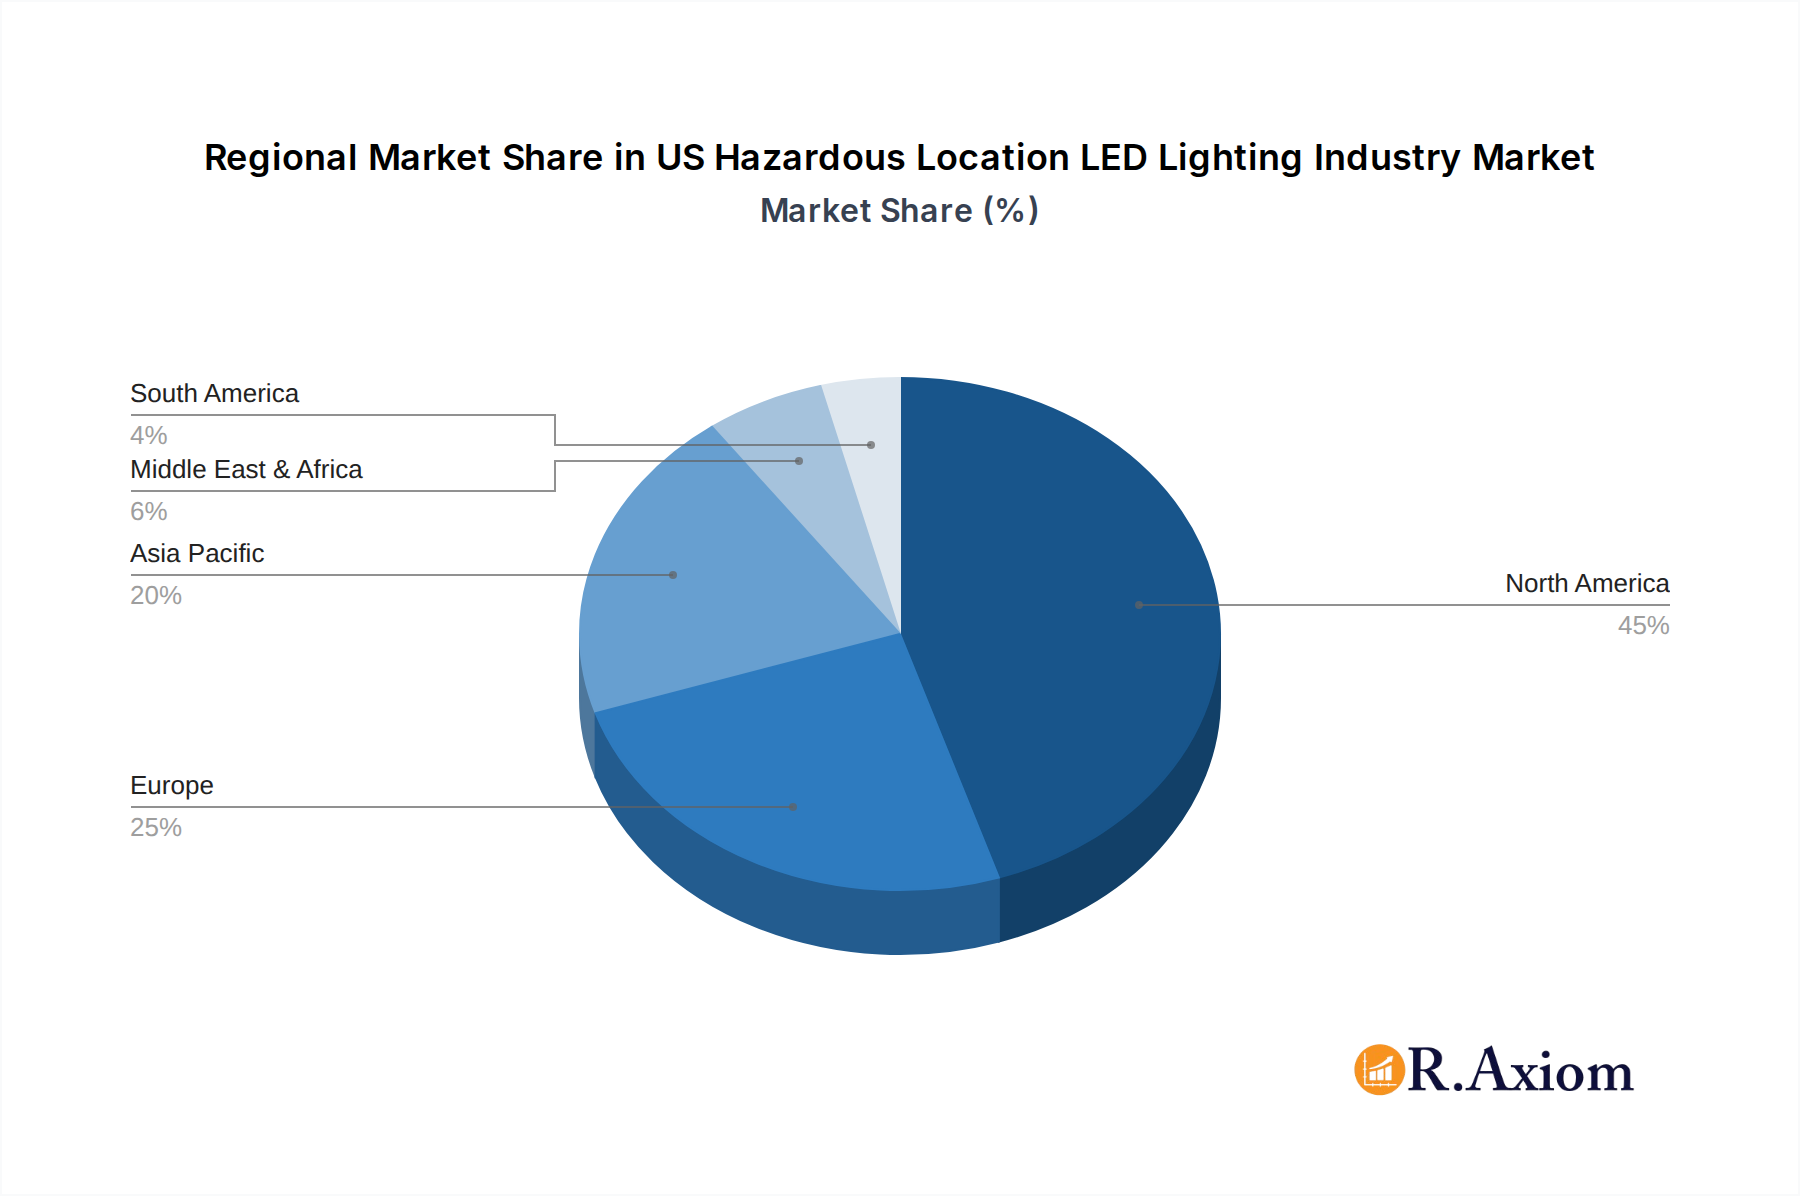
US Hazardous Location LED Lighting Industry Regional Market Share
Geographic Coverage of US Hazardous Location LED Lighting Industry
US Hazardous Location LED Lighting Industry REPORT HIGHLIGHTS
| Aspects | Details |
|---|---|
| Study Period | 2020-2034 |
| Base Year | 2025 |
| Estimated Year | 2026 |
| Forecast Period | 2026-2034 |
| Historical Period | 2020-2025 |
| Growth Rate | CAGR of 8% from 2020-2034 |
| Segmentation |
|
Table of Contents
- 1. Introduction
- 1.1. Research Scope
- 1.2. Market Segmentation
- 1.3. Research Objective
- 1.4. Definitions and Assumptions
- 2. Executive Summary
- 2.1. Market Snapshot
- 3. Market Dynamics
- 3.1. Market Drivers
- 3.2. Market Restrains
- 3.3. Market Trends
- 3.4. Market Opportunities
- 4. Market Factor Analysis
- 4.1. Porters Five Forces
- 4.1.1. Bargaining Power of Suppliers
- 4.1.2. Bargaining Power of Buyers
- 4.1.3. Threat of New Entrants
- 4.1.4. Threat of Substitutes
- 4.1.5. Competitive Rivalry
- 4.2. PESTEL analysis
- 4.3. BCG Analysis
- 4.3.1. Stars (High Growth, High Market Share)
- 4.3.2. Cash Cows (Low Growth, High Market Share)
- 4.3.3. Question Mark (High Growth, Low Market Share)
- 4.3.4. Dogs (Low Growth, Low Market Share)
- 4.4. Ansoff Matrix Analysis
- 4.5. Supply Chain Analysis
- 4.6. Regulatory Landscape
- 4.7. Current Market Potential and Opportunity Assessment (TAM–SAM–SOM Framework)
- 4.8. RAX Analyst Note
- 4.1. Porters Five Forces
- 5. Market Analysis, Insights and Forecast 2021-2033
- 5.1. Market Analysis, Insights and Forecast - by Device Type
- 5.1.1. Zone 0
- 5.1.2. Zone 20
- 5.1.3. Zone 1
- 5.1.4. Zone 21
- 5.1.5. Zone 22
- 5.2. Market Analysis, Insights and Forecast - by End-User Vertical
- 5.2.1. Oil and Gas
- 5.2.2. Petro Chemical
- 5.2.3. Industrial
- 5.2.4. Power Generation
- 5.2.5. Pharmaceutical
- 5.2.6. Processing
- 5.2.7. Other End-user Industries
- 5.3. Market Analysis, Insights and Forecast - by Region
- 5.3.1. North America
- 5.3.2. South America
- 5.3.3. Europe
- 5.3.4. Middle East & Africa
- 5.3.5. Asia Pacific
- 5.1. Market Analysis, Insights and Forecast - by Device Type
- 6. Global US Hazardous Location LED Lighting Industry Analysis, Insights and Forecast, 2021-2033
- 6.1. Market Analysis, Insights and Forecast - by Device Type
- 6.1.1. Zone 0
- 6.1.2. Zone 20
- 6.1.3. Zone 1
- 6.1.4. Zone 21
- 6.1.5. Zone 22
- 6.2. Market Analysis, Insights and Forecast - by End-User Vertical
- 6.2.1. Oil and Gas
- 6.2.2. Petro Chemical
- 6.2.3. Industrial
- 6.2.4. Power Generation
- 6.2.5. Pharmaceutical
- 6.2.6. Processing
- 6.2.7. Other End-user Industries
- 6.1. Market Analysis, Insights and Forecast - by Device Type
- 7. North America US Hazardous Location LED Lighting Industry Analysis, Insights and Forecast, 2020-2032
- 7.1. Market Analysis, Insights and Forecast - by Device Type
- 7.1.1. Zone 0
- 7.1.2. Zone 20
- 7.1.3. Zone 1
- 7.1.4. Zone 21
- 7.1.5. Zone 22
- 7.2. Market Analysis, Insights and Forecast - by End-User Vertical
- 7.2.1. Oil and Gas
- 7.2.2. Petro Chemical
- 7.2.3. Industrial
- 7.2.4. Power Generation
- 7.2.5. Pharmaceutical
- 7.2.6. Processing
- 7.2.7. Other End-user Industries
- 7.1. Market Analysis, Insights and Forecast - by Device Type
- 8. South America US Hazardous Location LED Lighting Industry Analysis, Insights and Forecast, 2020-2032
- 8.1. Market Analysis, Insights and Forecast - by Device Type
- 8.1.1. Zone 0
- 8.1.2. Zone 20
- 8.1.3. Zone 1
- 8.1.4. Zone 21
- 8.1.5. Zone 22
- 8.2. Market Analysis, Insights and Forecast - by End-User Vertical
- 8.2.1. Oil and Gas
- 8.2.2. Petro Chemical
- 8.2.3. Industrial
- 8.2.4. Power Generation
- 8.2.5. Pharmaceutical
- 8.2.6. Processing
- 8.2.7. Other End-user Industries
- 8.1. Market Analysis, Insights and Forecast - by Device Type
- 9. Europe US Hazardous Location LED Lighting Industry Analysis, Insights and Forecast, 2020-2032
- 9.1. Market Analysis, Insights and Forecast - by Device Type
- 9.1.1. Zone 0
- 9.1.2. Zone 20
- 9.1.3. Zone 1
- 9.1.4. Zone 21
- 9.1.5. Zone 22
- 9.2. Market Analysis, Insights and Forecast - by End-User Vertical
- 9.2.1. Oil and Gas
- 9.2.2. Petro Chemical
- 9.2.3. Industrial
- 9.2.4. Power Generation
- 9.2.5. Pharmaceutical
- 9.2.6. Processing
- 9.2.7. Other End-user Industries
- 9.1. Market Analysis, Insights and Forecast - by Device Type
- 10. Middle East & Africa US Hazardous Location LED Lighting Industry Analysis, Insights and Forecast, 2020-2032
- 10.1. Market Analysis, Insights and Forecast - by Device Type
- 10.1.1. Zone 0
- 10.1.2. Zone 20
- 10.1.3. Zone 1
- 10.1.4. Zone 21
- 10.1.5. Zone 22
- 10.2. Market Analysis, Insights and Forecast - by End-User Vertical
- 10.2.1. Oil and Gas
- 10.2.2. Petro Chemical
- 10.2.3. Industrial
- 10.2.4. Power Generation
- 10.2.5. Pharmaceutical
- 10.2.6. Processing
- 10.2.7. Other End-user Industries
- 10.1. Market Analysis, Insights and Forecast - by Device Type
- 11. Asia Pacific US Hazardous Location LED Lighting Industry Analysis, Insights and Forecast, 2020-2032
- 11.1. Market Analysis, Insights and Forecast - by Device Type
- 11.1.1. Zone 0
- 11.1.2. Zone 20
- 11.1.3. Zone 1
- 11.1.4. Zone 21
- 11.1.5. Zone 22
- 11.2. Market Analysis, Insights and Forecast - by End-User Vertical
- 11.2.1. Oil and Gas
- 11.2.2. Petro Chemical
- 11.2.3. Industrial
- 11.2.4. Power Generation
- 11.2.5. Pharmaceutical
- 11.2.6. Processing
- 11.2.7. Other End-user Industries
- 11.1. Market Analysis, Insights and Forecast - by Device Type
- 12. Competitive Analysis
- 12.1. Company Profiles
- 12.1.1 Nemalux Inc
- 12.1.1.1. Company Overview
- 12.1.1.2. Products
- 12.1.1.3. Company Financials
- 12.1.1.4. SWOT Analysis
- 12.1.2 ABB Installation Products Inc
- 12.1.2.1. Company Overview
- 12.1.2.2. Products
- 12.1.2.3. Company Financials
- 12.1.2.4. SWOT Analysis
- 12.1.3 Azz Inc
- 12.1.3.1. Company Overview
- 12.1.3.2. Products
- 12.1.3.3. Company Financials
- 12.1.3.4. SWOT Analysis
- 12.1.4 Worksite Lighting LLC*List Not Exhaustive
- 12.1.4.1. Company Overview
- 12.1.4.2. Products
- 12.1.4.3. Company Financials
- 12.1.4.4. SWOT Analysis
- 12.1.5 Larson Electronics
- 12.1.5.1. Company Overview
- 12.1.5.2. Products
- 12.1.5.3. Company Financials
- 12.1.5.4. SWOT Analysis
- 12.1.6 GE Current
- 12.1.6.1. Company Overview
- 12.1.6.2. Products
- 12.1.6.3. Company Financials
- 12.1.6.4. SWOT Analysis
- 12.1.7 Hubbell Limited
- 12.1.7.1. Company Overview
- 12.1.7.2. Products
- 12.1.7.3. Company Financials
- 12.1.7.4. SWOT Analysis
- 12.1.8 Emerson Electric Co
- 12.1.8.1. Company Overview
- 12.1.8.2. Products
- 12.1.8.3. Company Financials
- 12.1.8.4. SWOT Analysis
- 12.1.9 Digital Lumens Inc (OSRAM)
- 12.1.9.1. Company Overview
- 12.1.9.2. Products
- 12.1.9.3. Company Financials
- 12.1.9.4. SWOT Analysis
- 12.1.10 Eaton Corporation
- 12.1.10.1. Company Overview
- 12.1.10.2. Products
- 12.1.10.3. Company Financials
- 12.1.10.4. SWOT Analysis
- 12.1.1 Nemalux Inc
- 12.2. Market Entropy
- 12.2.1 Company's Key Areas Served
- 12.2.2 Recent Developments
- 12.3. Company Market Share Analysis 2025
- 12.3.1 Top 5 Companies Market Share Analysis
- 12.3.2 Top 3 Companies Market Share Analysis
- 12.4. List of Potential Customers
- 13. Research Methodology
List of Figures
- Figure 1: Global US Hazardous Location LED Lighting Industry Revenue Breakdown (undefined, %) by Region 2025 & 2033
- Figure 2: North America US Hazardous Location LED Lighting Industry Revenue (undefined), by Device Type 2025 & 2033
- Figure 3: North America US Hazardous Location LED Lighting Industry Revenue Share (%), by Device Type 2025 & 2033
- Figure 4: North America US Hazardous Location LED Lighting Industry Revenue (undefined), by End-User Vertical 2025 & 2033
- Figure 5: North America US Hazardous Location LED Lighting Industry Revenue Share (%), by End-User Vertical 2025 & 2033
- Figure 6: North America US Hazardous Location LED Lighting Industry Revenue (undefined), by Country 2025 & 2033
- Figure 7: North America US Hazardous Location LED Lighting Industry Revenue Share (%), by Country 2025 & 2033
- Figure 8: South America US Hazardous Location LED Lighting Industry Revenue (undefined), by Device Type 2025 & 2033
- Figure 9: South America US Hazardous Location LED Lighting Industry Revenue Share (%), by Device Type 2025 & 2033
- Figure 10: South America US Hazardous Location LED Lighting Industry Revenue (undefined), by End-User Vertical 2025 & 2033
- Figure 11: South America US Hazardous Location LED Lighting Industry Revenue Share (%), by End-User Vertical 2025 & 2033
- Figure 12: South America US Hazardous Location LED Lighting Industry Revenue (undefined), by Country 2025 & 2033
- Figure 13: South America US Hazardous Location LED Lighting Industry Revenue Share (%), by Country 2025 & 2033
- Figure 14: Europe US Hazardous Location LED Lighting Industry Revenue (undefined), by Device Type 2025 & 2033
- Figure 15: Europe US Hazardous Location LED Lighting Industry Revenue Share (%), by Device Type 2025 & 2033
- Figure 16: Europe US Hazardous Location LED Lighting Industry Revenue (undefined), by End-User Vertical 2025 & 2033
- Figure 17: Europe US Hazardous Location LED Lighting Industry Revenue Share (%), by End-User Vertical 2025 & 2033
- Figure 18: Europe US Hazardous Location LED Lighting Industry Revenue (undefined), by Country 2025 & 2033
- Figure 19: Europe US Hazardous Location LED Lighting Industry Revenue Share (%), by Country 2025 & 2033
- Figure 20: Middle East & Africa US Hazardous Location LED Lighting Industry Revenue (undefined), by Device Type 2025 & 2033
- Figure 21: Middle East & Africa US Hazardous Location LED Lighting Industry Revenue Share (%), by Device Type 2025 & 2033
- Figure 22: Middle East & Africa US Hazardous Location LED Lighting Industry Revenue (undefined), by End-User Vertical 2025 & 2033
- Figure 23: Middle East & Africa US Hazardous Location LED Lighting Industry Revenue Share (%), by End-User Vertical 2025 & 2033
- Figure 24: Middle East & Africa US Hazardous Location LED Lighting Industry Revenue (undefined), by Country 2025 & 2033
- Figure 25: Middle East & Africa US Hazardous Location LED Lighting Industry Revenue Share (%), by Country 2025 & 2033
- Figure 26: Asia Pacific US Hazardous Location LED Lighting Industry Revenue (undefined), by Device Type 2025 & 2033
- Figure 27: Asia Pacific US Hazardous Location LED Lighting Industry Revenue Share (%), by Device Type 2025 & 2033
- Figure 28: Asia Pacific US Hazardous Location LED Lighting Industry Revenue (undefined), by End-User Vertical 2025 & 2033
- Figure 29: Asia Pacific US Hazardous Location LED Lighting Industry Revenue Share (%), by End-User Vertical 2025 & 2033
- Figure 30: Asia Pacific US Hazardous Location LED Lighting Industry Revenue (undefined), by Country 2025 & 2033
- Figure 31: Asia Pacific US Hazardous Location LED Lighting Industry Revenue Share (%), by Country 2025 & 2033
List of Tables
- Table 1: Global US Hazardous Location LED Lighting Industry Revenue undefined Forecast, by Device Type 2020 & 2033
- Table 2: Global US Hazardous Location LED Lighting Industry Revenue undefined Forecast, by End-User Vertical 2020 & 2033
- Table 3: Global US Hazardous Location LED Lighting Industry Revenue undefined Forecast, by Region 2020 & 2033
- Table 4: Global US Hazardous Location LED Lighting Industry Revenue undefined Forecast, by Device Type 2020 & 2033
- Table 5: Global US Hazardous Location LED Lighting Industry Revenue undefined Forecast, by End-User Vertical 2020 & 2033
- Table 6: Global US Hazardous Location LED Lighting Industry Revenue undefined Forecast, by Country 2020 & 2033
- Table 7: United States US Hazardous Location LED Lighting Industry Revenue (undefined) Forecast, by Application 2020 & 2033
- Table 8: Canada US Hazardous Location LED Lighting Industry Revenue (undefined) Forecast, by Application 2020 & 2033
- Table 9: Mexico US Hazardous Location LED Lighting Industry Revenue (undefined) Forecast, by Application 2020 & 2033
- Table 10: Global US Hazardous Location LED Lighting Industry Revenue undefined Forecast, by Device Type 2020 & 2033
- Table 11: Global US Hazardous Location LED Lighting Industry Revenue undefined Forecast, by End-User Vertical 2020 & 2033
- Table 12: Global US Hazardous Location LED Lighting Industry Revenue undefined Forecast, by Country 2020 & 2033
- Table 13: Brazil US Hazardous Location LED Lighting Industry Revenue (undefined) Forecast, by Application 2020 & 2033
- Table 14: Argentina US Hazardous Location LED Lighting Industry Revenue (undefined) Forecast, by Application 2020 & 2033
- Table 15: Rest of South America US Hazardous Location LED Lighting Industry Revenue (undefined) Forecast, by Application 2020 & 2033
- Table 16: Global US Hazardous Location LED Lighting Industry Revenue undefined Forecast, by Device Type 2020 & 2033
- Table 17: Global US Hazardous Location LED Lighting Industry Revenue undefined Forecast, by End-User Vertical 2020 & 2033
- Table 18: Global US Hazardous Location LED Lighting Industry Revenue undefined Forecast, by Country 2020 & 2033
- Table 19: United Kingdom US Hazardous Location LED Lighting Industry Revenue (undefined) Forecast, by Application 2020 & 2033
- Table 20: Germany US Hazardous Location LED Lighting Industry Revenue (undefined) Forecast, by Application 2020 & 2033
- Table 21: France US Hazardous Location LED Lighting Industry Revenue (undefined) Forecast, by Application 2020 & 2033
- Table 22: Italy US Hazardous Location LED Lighting Industry Revenue (undefined) Forecast, by Application 2020 & 2033
- Table 23: Spain US Hazardous Location LED Lighting Industry Revenue (undefined) Forecast, by Application 2020 & 2033
- Table 24: Russia US Hazardous Location LED Lighting Industry Revenue (undefined) Forecast, by Application 2020 & 2033
- Table 25: Benelux US Hazardous Location LED Lighting Industry Revenue (undefined) Forecast, by Application 2020 & 2033
- Table 26: Nordics US Hazardous Location LED Lighting Industry Revenue (undefined) Forecast, by Application 2020 & 2033
- Table 27: Rest of Europe US Hazardous Location LED Lighting Industry Revenue (undefined) Forecast, by Application 2020 & 2033
- Table 28: Global US Hazardous Location LED Lighting Industry Revenue undefined Forecast, by Device Type 2020 & 2033
- Table 29: Global US Hazardous Location LED Lighting Industry Revenue undefined Forecast, by End-User Vertical 2020 & 2033
- Table 30: Global US Hazardous Location LED Lighting Industry Revenue undefined Forecast, by Country 2020 & 2033
- Table 31: Turkey US Hazardous Location LED Lighting Industry Revenue (undefined) Forecast, by Application 2020 & 2033
- Table 32: Israel US Hazardous Location LED Lighting Industry Revenue (undefined) Forecast, by Application 2020 & 2033
- Table 33: GCC US Hazardous Location LED Lighting Industry Revenue (undefined) Forecast, by Application 2020 & 2033
- Table 34: North Africa US Hazardous Location LED Lighting Industry Revenue (undefined) Forecast, by Application 2020 & 2033
- Table 35: South Africa US Hazardous Location LED Lighting Industry Revenue (undefined) Forecast, by Application 2020 & 2033
- Table 36: Rest of Middle East & Africa US Hazardous Location LED Lighting Industry Revenue (undefined) Forecast, by Application 2020 & 2033
- Table 37: Global US Hazardous Location LED Lighting Industry Revenue undefined Forecast, by Device Type 2020 & 2033
- Table 38: Global US Hazardous Location LED Lighting Industry Revenue undefined Forecast, by End-User Vertical 2020 & 2033
- Table 39: Global US Hazardous Location LED Lighting Industry Revenue undefined Forecast, by Country 2020 & 2033
- Table 40: China US Hazardous Location LED Lighting Industry Revenue (undefined) Forecast, by Application 2020 & 2033
- Table 41: India US Hazardous Location LED Lighting Industry Revenue (undefined) Forecast, by Application 2020 & 2033
- Table 42: Japan US Hazardous Location LED Lighting Industry Revenue (undefined) Forecast, by Application 2020 & 2033
- Table 43: South Korea US Hazardous Location LED Lighting Industry Revenue (undefined) Forecast, by Application 2020 & 2033
- Table 44: ASEAN US Hazardous Location LED Lighting Industry Revenue (undefined) Forecast, by Application 2020 & 2033
- Table 45: Oceania US Hazardous Location LED Lighting Industry Revenue (undefined) Forecast, by Application 2020 & 2033
- Table 46: Rest of Asia Pacific US Hazardous Location LED Lighting Industry Revenue (undefined) Forecast, by Application 2020 & 2033
Frequently Asked Questions
1. What is the projected Compound Annual Growth Rate (CAGR) of the US Hazardous Location LED Lighting Industry?
The projected CAGR is approximately 8%.
2. Which companies are prominent players in the US Hazardous Location LED Lighting Industry?
Key companies in the market include Nemalux Inc, ABB Installation Products Inc, Azz Inc, Worksite Lighting LLC*List Not Exhaustive, Larson Electronics, GE Current, Hubbell Limited, Emerson Electric Co, Digital Lumens Inc (OSRAM), Eaton Corporation.
3. What are the main segments of the US Hazardous Location LED Lighting Industry?
The market segments include Device Type, End-User Vertical.
4. Can you provide details about the market size?
The market size is estimated to be USD XXX N/A as of 2022.
5. What are some drivers contributing to market growth?
; Regulations Promoting Proper Lighting for Worker Safety in Hazardous Locations; Rising Demand for Cost-effective and Energy-efficient LED Lighting Solution.
6. What are the notable trends driving market growth?
Increasing Demand for Low-Cost. Low-Energy LED Lighting Solutions.
7. Are there any restraints impacting market growth?
Security and Privacy Concerns Due To Communication Technology.
8. Can you provide examples of recent developments in the market?
N/A
9. What pricing options are available for accessing the report?
Pricing options include single-user, multi-user, and enterprise licenses priced at USD 3800, USD 4500, and USD 5800 respectively.
10. Is the market size provided in terms of value or volume?
The market size is provided in terms of value, measured in N/A.
11. Are there any specific market keywords associated with the report?
Yes, the market keyword associated with the report is "US Hazardous Location LED Lighting Industry," which aids in identifying and referencing the specific market segment covered.
12. How do I determine which pricing option suits my needs best?
The pricing options vary based on user requirements and access needs. Individual users may opt for single-user licenses, while businesses requiring broader access may choose multi-user or enterprise licenses for cost-effective access to the report.
13. Are there any additional resources or data provided in the US Hazardous Location LED Lighting Industry report?
While the report offers comprehensive insights, it's advisable to review the specific contents or supplementary materials provided to ascertain if additional resources or data are available.
14. How can I stay updated on further developments or reports in the US Hazardous Location LED Lighting Industry?
To stay informed about further developments, trends, and reports in the US Hazardous Location LED Lighting Industry, consider subscribing to industry newsletters, following relevant companies and organizations, or regularly checking reputable industry news sources and publications.
Methodology
Step 1 - Identification of Relevant Samples Size from Population Database


Step 2 - Approaches for Defining Global Market Size (Value, Volume* & Price*)

Note*: In applicable scenarios
Step 3 - Data Sources
Primary Research
- Web Analytics
- Survey Reports
- Research Institute
- Latest Research Reports
- Opinion Leaders
Secondary Research
- Annual Reports
- White Paper
- Latest Press Release
- Industry Association
- Paid Database
- Investor Presentations

Step 4 - Data Triangulation
Involves using different sources of information in order to increase the validity of a study
These sources are likely to be stakeholders in a program - participants, other researchers, program staff, other community members, and so on.
Then we put all data in single framework & apply various statistical tools to find out the dynamic on the market.
During the analysis stage, feedback from the stakeholder groups would be compared to determine areas of agreement as well as areas of divergence