

Key Insights
India's Buy Now Pay Later (BNPL) market is experiencing significant expansion, driven by widespread smartphone adoption, increasing digital engagement, and a young demographic actively seeking credit alternatives. With a projected Compound Annual Growth Rate (CAGR) of 13.4%, the market is fundamentally reshaping consumer purchasing habits. Key growth catalysts include the inherent convenience and accessibility of BNPL solutions, especially for individuals with limited traditional credit history. Seamless integration with e-commerce platforms further enhances the consumer checkout experience. While established players like Paytm Postpaid and ZestMoney currently lead, the competitive landscape is poised for innovation and potential market consolidation.
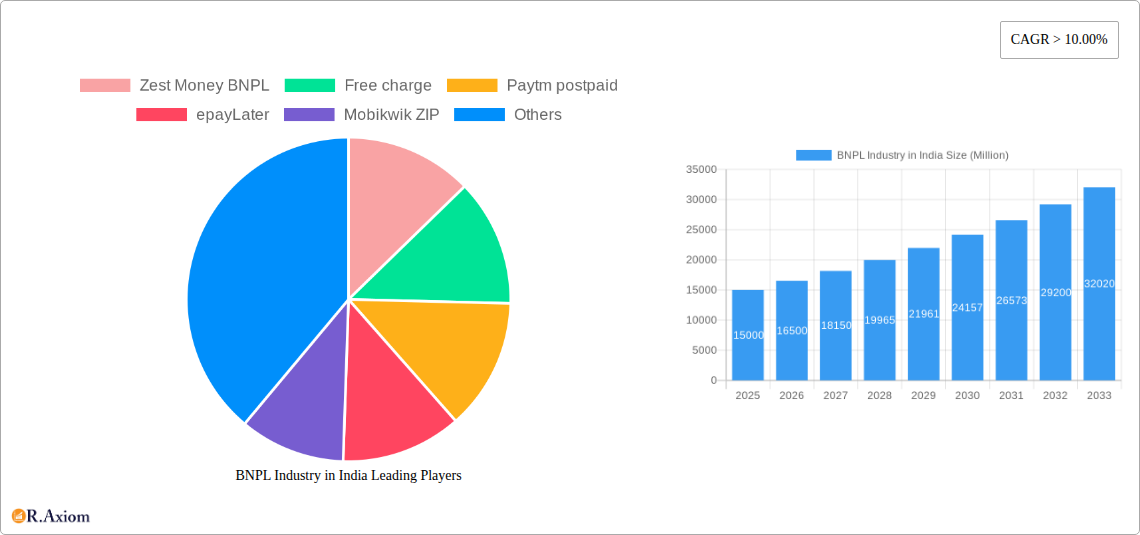
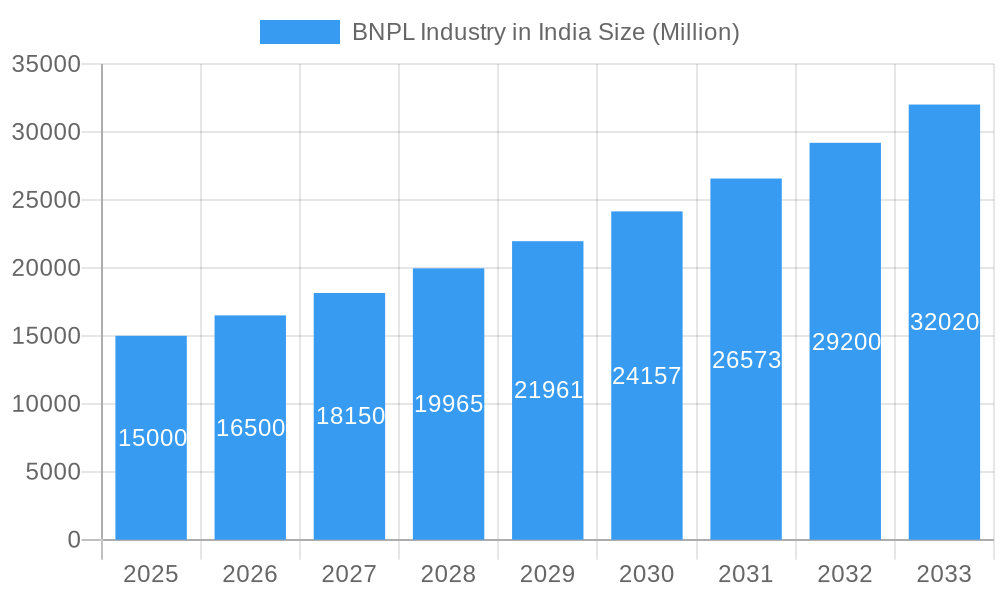
BNPL Industry in India Market Size (In Billion)
The integration of embedded finance, offering BNPL directly within diverse platforms, is expected to fuel further market growth. However, evolving regulatory oversight and concerns regarding consumer over-indebtedness represent potential market restraints. The market can be segmented by consumer demographics (age, income), transaction value, and the types of goods and services procured via BNPL.
BNPL Industry in India Company Market Share
The forecast period from 2025 to 2033 anticipates sustained market expansion, though potentially at a more moderate pace as the market matures. Factors such as evolving lending regulations, heightened consumer awareness of responsible credit practices, and strategic competitive advancements (including pricing models and loyalty programs) will significantly influence market dynamics. The penetration of BNPL into under-served segments, including smaller towns and rural areas, presents a substantial growth opportunity. Innovative offerings tailored to specific consumer needs, coupled with robust risk management, will be paramount for sustained success in India's increasingly competitive BNPL sector. We forecast the market size to reach 21.95 billion by 2025, driven by increasing financial inclusion and ongoing digitalization.
This comprehensive report offers an in-depth analysis of India's Buy Now Pay Later (BNPL) industry, encompassing market size, growth forecasts, key participants, prevailing trends, and future outlook. Utilizing data from the historical period (2019-2024), base year (2025), and projected year (2025), this report forecasts market trends through 2033, providing critical insights for investors, businesses, and stakeholders navigating this dynamic market.
BNPL Industry in India Market Concentration & Innovation
The Indian BNPL market is characterized by a moderately concentrated landscape with several major players vying for market share. While precise market share figures fluctuate constantly, key players like Paytm Postpaid, PhonePe, and Amazon Pay Later hold significant positions. However, the market exhibits considerable dynamism, with new entrants and mergers & acquisitions (M&A) activity reshaping the competitive structure. Innovation is a significant driver, with companies constantly introducing new features, partnerships, and technological advancements to enhance user experience and expand market reach. The regulatory framework, while evolving, plays a crucial role in shaping industry practices and growth. The increasing adoption of digital payments and rising consumer preference for flexible payment options contribute to market growth, while established credit card systems and other financing options remain key substitutes. Recent M&A activity in the sector has involved deals with values ranging from tens of Millions to hundreds of Millions, although exact figures often remain undisclosed.
- Market Concentration: Moderately concentrated, with several dominant players and numerous smaller competitors.
- Innovation Drivers: Technological advancements, evolving customer preferences, and competitive pressures.
- Regulatory Framework: Evolving regulations influence industry practices and growth trajectory.
- Product Substitutes: Traditional credit cards, personal loans, and other financing options.
- End-User Trends: Increasing preference for flexible and convenient payment methods.
- M&A Activities: Ongoing consolidation with deals of varying values (xx Million - xx Million).
BNPL Industry in India Industry Trends & Insights
The Indian BNPL market is experiencing exponential growth, driven by factors such as rising smartphone penetration, increasing internet usage, and a growing preference for online shopping. The Compound Annual Growth Rate (CAGR) during the forecast period (2025-2033) is projected to be xx%, significantly higher than the global average. Market penetration, currently at xx%, is expected to reach xx% by 2033. Technological disruptions, including the integration of BNPL into e-commerce platforms and the rise of embedded finance, are transforming the industry landscape. Consumer preferences are shifting towards seamless and personalized experiences, demanding greater transparency and flexibility from BNPL providers. The competitive landscape is highly dynamic, with companies constantly innovating to attract and retain customers. Key challenges include regulatory scrutiny, potential risks associated with rising consumer debt, and the need for effective risk management.
Dominant Markets & Segments in BNPL Industry in India
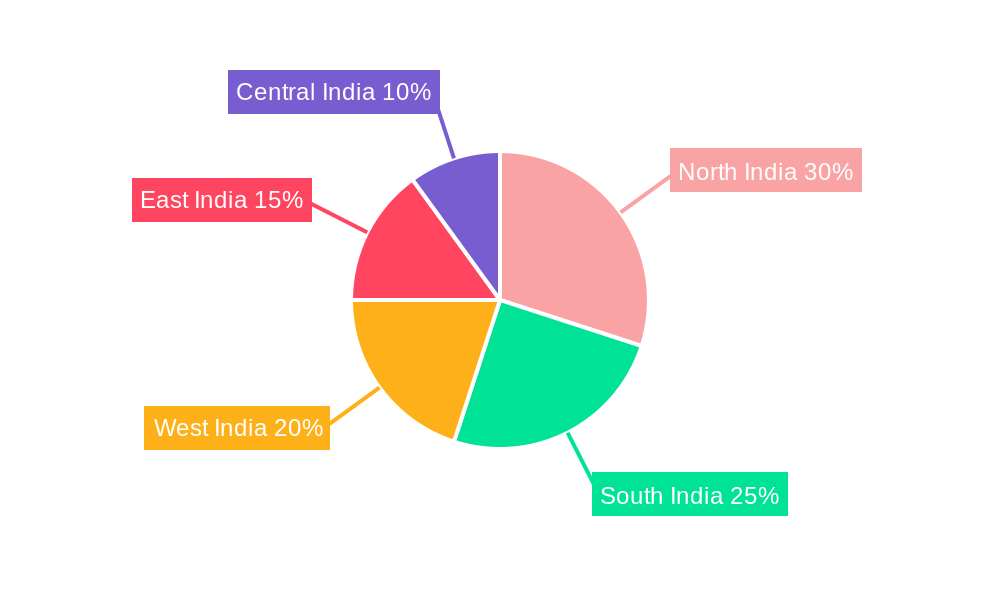
The Indian BNPL market exhibits robust growth across various segments and regions. While detailed regional breakdown data is unavailable, urban areas with higher internet and smartphone penetration show faster growth. The dominance is fueled by several factors:
Key Drivers:
- Economic Policies: Government initiatives promoting digital payments and financial inclusion.
- Infrastructure: Improved digital infrastructure enabling widespread adoption of online transactions.
- Consumer Behavior: Increasing preference for online shopping and flexible payment options.
Dominance Analysis: While precise market share data is unavailable, the dominance is distributed among several key players, with no single entity holding an overwhelming majority. The market exhibits a fragmented structure with significant opportunities for growth and expansion for new and existing players.
BNPL Industry in India Product Developments
BNPL providers are constantly innovating to enhance user experience and expand their reach. Recent advancements include the integration of BNPL solutions into various platforms, such as e-commerce websites and mobile apps, creating seamless checkout experiences. Some BNPL providers are incorporating AI-powered credit scoring and risk assessment to enhance their decision-making processes. The market is seeing a trend towards personalized offerings and reward programs, aimed at boosting customer engagement and loyalty.
Report Scope & Segmentation Analysis
This report segments the Indian BNPL market based on various parameters:
By Provider Type: This segment categorizes BNPL providers based on their business model (e.g., banks, fintech companies, e-commerce platforms). The market is witnessing growth across various provider types, with fintech companies rapidly gaining traction.
By User Demographics: This segment analyzes BNPL usage patterns across different age groups, income levels, and geographic locations. The young population and expanding middle class are significant growth drivers.
By Transaction Value: This segment analyses the market based on the transaction value associated with each BNPL purchase. This analysis helps in understanding the spending habits of users and overall market volume.
Growth projections and market size vary significantly across segments, driven by factors such as consumer demographics, digital adoption levels, and regulatory frameworks. The competitive landscape also varies based on segments, with different players having advantages in various areas.
Key Drivers of BNPL Industry in India Growth
Several factors propel the growth of the Indian BNPL sector:
Technological Advancements: The proliferation of smartphones, internet penetration, and digital payment systems facilitates widespread BNPL adoption.
Economic Factors: A young, growing population with increasing disposable incomes fuels demand for consumer goods and services, driving BNPL usage.
Regulatory Support: Government initiatives aimed at promoting digital payments and financial inclusion create a favorable environment for BNPL growth.
Challenges in the BNPL Industry in India Sector
Despite rapid growth, the Indian BNPL sector faces several challenges:
Regulatory Scrutiny: Concerns about consumer debt levels and potential risks associated with BNPL lead to increased regulatory oversight and potential policy changes. This uncertainty can impact investment and expansion plans.
Supply Chain Issues: Disruptions in global supply chains and inflation can impact the availability and pricing of goods, affecting consumer spending and BNPL usage.
Competitive Pressure: The highly competitive nature of the market requires BNPL providers to constantly innovate and offer competitive pricing and features to retain and attract customers. This intensifies the pressure to maintain profitability.
Emerging Opportunities in BNPL Industry in India
Despite challenges, the Indian BNPL market presents several emerging opportunities:
Expansion into Underserved Markets: Reaching consumers in rural areas and smaller towns offers significant growth potential.
Integration with Emerging Technologies: Leveraging technologies such as AI and machine learning for risk management and personalized offerings can improve efficiency and profitability.
Strategic Partnerships: Collaborating with banks, merchants, and other financial institutions expands reach and enhances service offerings.
Leading Players in the BNPL Industry in India Market
- ZestMoney BNPL https://www.zestmoney.in/
- Freecharge
- Paytm Postpaid https://paytm.com/
- epayLater
- Mobikwik ZIP
- Flipkart pay later https://www.flipkart.com/
- Olamoney Postpaid
- Money Tap
- Simpl
- Lazy Pay
- Flexmoney
- Amazon Pay later https://www.amazon.in/
- Capital float
- Slice
- Kreditbee
- Postpe
Key Developments in BNPL Industry in India Industry
May 2023: ZestMoney announces plans to achieve profitability within six months and secures a new investment round from existing shareholders. This signals confidence in the sector's growth potential and highlights the company's strategic shift towards a lending service provider (LSP) model.
February 2023: The Indian IT Ministry lifts the ban on several lending apps, including PayU's LazyPay, providing relief to the BNPL sector and indicating a potential easing of regulatory pressure.
Strategic Outlook for BNPL Industry in India Market
The Indian BNPL market is poised for significant growth, driven by increasing digital adoption, favorable economic conditions, and evolving consumer preferences. Opportunities exist in expanding into underserved markets, leveraging innovative technologies, and forging strategic partnerships. However, navigating regulatory changes and maintaining sustainable business models remain crucial for sustained success. The sector's future hinges on adapting to evolving regulations, managing risks effectively, and continuously innovating to meet evolving consumer demands.
BNPL Industry in India Segmentation
-
1. Channel
- 1.1. Online
- 1.2. POS
-
2. Enterprise
- 2.1. Large Enterprise
- 2.2. Small & medium enterprise
-
3. End-user
- 3.1. Consmer electronics
- 3.2. Fashion & garments
- 3.3. Healthcare
- 3.4. Leisure & entertainment
- 3.5. Retail
- 3.6. Other End-users
BNPL Industry in India Segmentation By Geography
-
1. North America
- 1.1. United States
- 1.2. Canada
- 1.3. Mexico
-
2. South America
- 2.1. Brazil
- 2.2. Argentina
- 2.3. Rest of South America
-
3. Europe
- 3.1. United Kingdom
- 3.2. Germany
- 3.3. France
- 3.4. Italy
- 3.5. Spain
- 3.6. Russia
- 3.7. Benelux
- 3.8. Nordics
- 3.9. Rest of Europe
-
4. Middle East & Africa
- 4.1. Turkey
- 4.2. Israel
- 4.3. GCC
- 4.4. North Africa
- 4.5. South Africa
- 4.6. Rest of Middle East & Africa
-
5. Asia Pacific
- 5.1. China
- 5.2. India
- 5.3. Japan
- 5.4. South Korea
- 5.5. ASEAN
- 5.6. Oceania
- 5.7. Rest of Asia Pacific
BNPL Industry in India Regional Market Share
Geographic Coverage of BNPL Industry in India
BNPL Industry in India REPORT HIGHLIGHTS
| Aspects | Details |
|---|---|
| Study Period | 2020-2034 |
| Base Year | 2025 |
| Estimated Year | 2026 |
| Forecast Period | 2026-2034 |
| Historical Period | 2020-2025 |
| Growth Rate | CAGR of 13.4% from 2020-2034 |
| Segmentation |
|
Table of Contents
- 1. Introduction
- 1.1. Research Scope
- 1.2. Market Segmentation
- 1.3. Research Objective
- 1.4. Definitions and Assumptions
- 2. Executive Summary
- 2.1. Market Snapshot
- 3. Market Dynamics
- 3.1. Market Drivers
- 3.2. Market Restrains
- 3.3. Market Trends
- 3.4. Market Opportunities
- 4. Market Factor Analysis
- 4.1. Porters Five Forces
- 4.1.1. Bargaining Power of Suppliers
- 4.1.2. Bargaining Power of Buyers
- 4.1.3. Threat of New Entrants
- 4.1.4. Threat of Substitutes
- 4.1.5. Competitive Rivalry
- 4.2. PESTEL analysis
- 4.3. BCG Analysis
- 4.3.1. Stars (High Growth, High Market Share)
- 4.3.2. Cash Cows (Low Growth, High Market Share)
- 4.3.3. Question Mark (High Growth, Low Market Share)
- 4.3.4. Dogs (Low Growth, Low Market Share)
- 4.4. Ansoff Matrix Analysis
- 4.5. Supply Chain Analysis
- 4.6. Regulatory Landscape
- 4.7. Current Market Potential and Opportunity Assessment (TAM–SAM–SOM Framework)
- 4.8. RAX Analyst Note
- 4.1. Porters Five Forces
- 5. Market Analysis, Insights and Forecast 2021-2033
- 5.1. Market Analysis, Insights and Forecast - by Channel
- 5.1.1. Online
- 5.1.2. POS
- 5.2. Market Analysis, Insights and Forecast - by Enterprise
- 5.2.1. Large Enterprise
- 5.2.2. Small & medium enterprise
- 5.3. Market Analysis, Insights and Forecast - by End-user
- 5.3.1. Consmer electronics
- 5.3.2. Fashion & garments
- 5.3.3. Healthcare
- 5.3.4. Leisure & entertainment
- 5.3.5. Retail
- 5.3.6. Other End-users
- 5.4. Market Analysis, Insights and Forecast - by Region
- 5.4.1. North America
- 5.4.2. South America
- 5.4.3. Europe
- 5.4.4. Middle East & Africa
- 5.4.5. Asia Pacific
- 5.1. Market Analysis, Insights and Forecast - by Channel
- 6. Global BNPL Industry in India Analysis, Insights and Forecast, 2021-2033
- 6.1. Market Analysis, Insights and Forecast - by Channel
- 6.1.1. Online
- 6.1.2. POS
- 6.2. Market Analysis, Insights and Forecast - by Enterprise
- 6.2.1. Large Enterprise
- 6.2.2. Small & medium enterprise
- 6.3. Market Analysis, Insights and Forecast - by End-user
- 6.3.1. Consmer electronics
- 6.3.2. Fashion & garments
- 6.3.3. Healthcare
- 6.3.4. Leisure & entertainment
- 6.3.5. Retail
- 6.3.6. Other End-users
- 6.1. Market Analysis, Insights and Forecast - by Channel
- 7. North America BNPL Industry in India Analysis, Insights and Forecast, 2020-2032
- 7.1. Market Analysis, Insights and Forecast - by Channel
- 7.1.1. Online
- 7.1.2. POS
- 7.2. Market Analysis, Insights and Forecast - by Enterprise
- 7.2.1. Large Enterprise
- 7.2.2. Small & medium enterprise
- 7.3. Market Analysis, Insights and Forecast - by End-user
- 7.3.1. Consmer electronics
- 7.3.2. Fashion & garments
- 7.3.3. Healthcare
- 7.3.4. Leisure & entertainment
- 7.3.5. Retail
- 7.3.6. Other End-users
- 7.1. Market Analysis, Insights and Forecast - by Channel
- 8. South America BNPL Industry in India Analysis, Insights and Forecast, 2020-2032
- 8.1. Market Analysis, Insights and Forecast - by Channel
- 8.1.1. Online
- 8.1.2. POS
- 8.2. Market Analysis, Insights and Forecast - by Enterprise
- 8.2.1. Large Enterprise
- 8.2.2. Small & medium enterprise
- 8.3. Market Analysis, Insights and Forecast - by End-user
- 8.3.1. Consmer electronics
- 8.3.2. Fashion & garments
- 8.3.3. Healthcare
- 8.3.4. Leisure & entertainment
- 8.3.5. Retail
- 8.3.6. Other End-users
- 8.1. Market Analysis, Insights and Forecast - by Channel
- 9. Europe BNPL Industry in India Analysis, Insights and Forecast, 2020-2032
- 9.1. Market Analysis, Insights and Forecast - by Channel
- 9.1.1. Online
- 9.1.2. POS
- 9.2. Market Analysis, Insights and Forecast - by Enterprise
- 9.2.1. Large Enterprise
- 9.2.2. Small & medium enterprise
- 9.3. Market Analysis, Insights and Forecast - by End-user
- 9.3.1. Consmer electronics
- 9.3.2. Fashion & garments
- 9.3.3. Healthcare
- 9.3.4. Leisure & entertainment
- 9.3.5. Retail
- 9.3.6. Other End-users
- 9.1. Market Analysis, Insights and Forecast - by Channel
- 10. Middle East & Africa BNPL Industry in India Analysis, Insights and Forecast, 2020-2032
- 10.1. Market Analysis, Insights and Forecast - by Channel
- 10.1.1. Online
- 10.1.2. POS
- 10.2. Market Analysis, Insights and Forecast - by Enterprise
- 10.2.1. Large Enterprise
- 10.2.2. Small & medium enterprise
- 10.3. Market Analysis, Insights and Forecast - by End-user
- 10.3.1. Consmer electronics
- 10.3.2. Fashion & garments
- 10.3.3. Healthcare
- 10.3.4. Leisure & entertainment
- 10.3.5. Retail
- 10.3.6. Other End-users
- 10.1. Market Analysis, Insights and Forecast - by Channel
- 11. Asia Pacific BNPL Industry in India Analysis, Insights and Forecast, 2020-2032
- 11.1. Market Analysis, Insights and Forecast - by Channel
- 11.1.1. Online
- 11.1.2. POS
- 11.2. Market Analysis, Insights and Forecast - by Enterprise
- 11.2.1. Large Enterprise
- 11.2.2. Small & medium enterprise
- 11.3. Market Analysis, Insights and Forecast - by End-user
- 11.3.1. Consmer electronics
- 11.3.2. Fashion & garments
- 11.3.3. Healthcare
- 11.3.4. Leisure & entertainment
- 11.3.5. Retail
- 11.3.6. Other End-users
- 11.1. Market Analysis, Insights and Forecast - by Channel
- 12. Competitive Analysis
- 12.1. Company Profiles
- 12.1.1 Zest Money BNPL
- 12.1.1.1. Company Overview
- 12.1.1.2. Products
- 12.1.1.3. Company Financials
- 12.1.1.4. SWOT Analysis
- 12.1.2 Free charge
- 12.1.2.1. Company Overview
- 12.1.2.2. Products
- 12.1.2.3. Company Financials
- 12.1.2.4. SWOT Analysis
- 12.1.3 Paytm postpaid
- 12.1.3.1. Company Overview
- 12.1.3.2. Products
- 12.1.3.3. Company Financials
- 12.1.3.4. SWOT Analysis
- 12.1.4 epayLater
- 12.1.4.1. Company Overview
- 12.1.4.2. Products
- 12.1.4.3. Company Financials
- 12.1.4.4. SWOT Analysis
- 12.1.5 Mobikwik ZIP
- 12.1.5.1. Company Overview
- 12.1.5.2. Products
- 12.1.5.3. Company Financials
- 12.1.5.4. SWOT Analysis
- 12.1.6 Flipkart pay later
- 12.1.6.1. Company Overview
- 12.1.6.2. Products
- 12.1.6.3. Company Financials
- 12.1.6.4. SWOT Analysis
- 12.1.7 Olamoney Postpaid
- 12.1.7.1. Company Overview
- 12.1.7.2. Products
- 12.1.7.3. Company Financials
- 12.1.7.4. SWOT Analysis
- 12.1.8 Money Tap
- 12.1.8.1. Company Overview
- 12.1.8.2. Products
- 12.1.8.3. Company Financials
- 12.1.8.4. SWOT Analysis
- 12.1.9 Simpl
- 12.1.9.1. Company Overview
- 12.1.9.2. Products
- 12.1.9.3. Company Financials
- 12.1.9.4. SWOT Analysis
- 12.1.10 Lazy Pay
- 12.1.10.1. Company Overview
- 12.1.10.2. Products
- 12.1.10.3. Company Financials
- 12.1.10.4. SWOT Analysis
- 12.1.11 Flexmoney
- 12.1.11.1. Company Overview
- 12.1.11.2. Products
- 12.1.11.3. Company Financials
- 12.1.11.4. SWOT Analysis
- 12.1.12 Amazon Pay later
- 12.1.12.1. Company Overview
- 12.1.12.2. Products
- 12.1.12.3. Company Financials
- 12.1.12.4. SWOT Analysis
- 12.1.13 Capital float
- 12.1.13.1. Company Overview
- 12.1.13.2. Products
- 12.1.13.3. Company Financials
- 12.1.13.4. SWOT Analysis
- 12.1.14 Slice
- 12.1.14.1. Company Overview
- 12.1.14.2. Products
- 12.1.14.3. Company Financials
- 12.1.14.4. SWOT Analysis
- 12.1.15 Kreditbee
- 12.1.15.1. Company Overview
- 12.1.15.2. Products
- 12.1.15.3. Company Financials
- 12.1.15.4. SWOT Analysis
- 12.1.16 Postpe**List Not Exhaustive
- 12.1.16.1. Company Overview
- 12.1.16.2. Products
- 12.1.16.3. Company Financials
- 12.1.16.4. SWOT Analysis
- 12.1.1 Zest Money BNPL
- 12.2. Market Entropy
- 12.2.1 Company's Key Areas Served
- 12.2.2 Recent Developments
- 12.3. Company Market Share Analysis 2025
- 12.3.1 Top 5 Companies Market Share Analysis
- 12.3.2 Top 3 Companies Market Share Analysis
- 12.4. List of Potential Customers
- 13. Research Methodology
List of Figures
- Figure 1: Global BNPL Industry in India Revenue Breakdown (billion, %) by Region 2025 & 2033
- Figure 2: North America BNPL Industry in India Revenue (billion), by Channel 2025 & 2033
- Figure 3: North America BNPL Industry in India Revenue Share (%), by Channel 2025 & 2033
- Figure 4: North America BNPL Industry in India Revenue (billion), by Enterprise 2025 & 2033
- Figure 5: North America BNPL Industry in India Revenue Share (%), by Enterprise 2025 & 2033
- Figure 6: North America BNPL Industry in India Revenue (billion), by End-user 2025 & 2033
- Figure 7: North America BNPL Industry in India Revenue Share (%), by End-user 2025 & 2033
- Figure 8: North America BNPL Industry in India Revenue (billion), by Country 2025 & 2033
- Figure 9: North America BNPL Industry in India Revenue Share (%), by Country 2025 & 2033
- Figure 10: South America BNPL Industry in India Revenue (billion), by Channel 2025 & 2033
- Figure 11: South America BNPL Industry in India Revenue Share (%), by Channel 2025 & 2033
- Figure 12: South America BNPL Industry in India Revenue (billion), by Enterprise 2025 & 2033
- Figure 13: South America BNPL Industry in India Revenue Share (%), by Enterprise 2025 & 2033
- Figure 14: South America BNPL Industry in India Revenue (billion), by End-user 2025 & 2033
- Figure 15: South America BNPL Industry in India Revenue Share (%), by End-user 2025 & 2033
- Figure 16: South America BNPL Industry in India Revenue (billion), by Country 2025 & 2033
- Figure 17: South America BNPL Industry in India Revenue Share (%), by Country 2025 & 2033
- Figure 18: Europe BNPL Industry in India Revenue (billion), by Channel 2025 & 2033
- Figure 19: Europe BNPL Industry in India Revenue Share (%), by Channel 2025 & 2033
- Figure 20: Europe BNPL Industry in India Revenue (billion), by Enterprise 2025 & 2033
- Figure 21: Europe BNPL Industry in India Revenue Share (%), by Enterprise 2025 & 2033
- Figure 22: Europe BNPL Industry in India Revenue (billion), by End-user 2025 & 2033
- Figure 23: Europe BNPL Industry in India Revenue Share (%), by End-user 2025 & 2033
- Figure 24: Europe BNPL Industry in India Revenue (billion), by Country 2025 & 2033
- Figure 25: Europe BNPL Industry in India Revenue Share (%), by Country 2025 & 2033
- Figure 26: Middle East & Africa BNPL Industry in India Revenue (billion), by Channel 2025 & 2033
- Figure 27: Middle East & Africa BNPL Industry in India Revenue Share (%), by Channel 2025 & 2033
- Figure 28: Middle East & Africa BNPL Industry in India Revenue (billion), by Enterprise 2025 & 2033
- Figure 29: Middle East & Africa BNPL Industry in India Revenue Share (%), by Enterprise 2025 & 2033
- Figure 30: Middle East & Africa BNPL Industry in India Revenue (billion), by End-user 2025 & 2033
- Figure 31: Middle East & Africa BNPL Industry in India Revenue Share (%), by End-user 2025 & 2033
- Figure 32: Middle East & Africa BNPL Industry in India Revenue (billion), by Country 2025 & 2033
- Figure 33: Middle East & Africa BNPL Industry in India Revenue Share (%), by Country 2025 & 2033
- Figure 34: Asia Pacific BNPL Industry in India Revenue (billion), by Channel 2025 & 2033
- Figure 35: Asia Pacific BNPL Industry in India Revenue Share (%), by Channel 2025 & 2033
- Figure 36: Asia Pacific BNPL Industry in India Revenue (billion), by Enterprise 2025 & 2033
- Figure 37: Asia Pacific BNPL Industry in India Revenue Share (%), by Enterprise 2025 & 2033
- Figure 38: Asia Pacific BNPL Industry in India Revenue (billion), by End-user 2025 & 2033
- Figure 39: Asia Pacific BNPL Industry in India Revenue Share (%), by End-user 2025 & 2033
- Figure 40: Asia Pacific BNPL Industry in India Revenue (billion), by Country 2025 & 2033
- Figure 41: Asia Pacific BNPL Industry in India Revenue Share (%), by Country 2025 & 2033
List of Tables
- Table 1: Global BNPL Industry in India Revenue billion Forecast, by Channel 2020 & 2033
- Table 2: Global BNPL Industry in India Revenue billion Forecast, by Enterprise 2020 & 2033
- Table 3: Global BNPL Industry in India Revenue billion Forecast, by End-user 2020 & 2033
- Table 4: Global BNPL Industry in India Revenue billion Forecast, by Region 2020 & 2033
- Table 5: Global BNPL Industry in India Revenue billion Forecast, by Channel 2020 & 2033
- Table 6: Global BNPL Industry in India Revenue billion Forecast, by Enterprise 2020 & 2033
- Table 7: Global BNPL Industry in India Revenue billion Forecast, by End-user 2020 & 2033
- Table 8: Global BNPL Industry in India Revenue billion Forecast, by Country 2020 & 2033
- Table 9: United States BNPL Industry in India Revenue (billion) Forecast, by Application 2020 & 2033
- Table 10: Canada BNPL Industry in India Revenue (billion) Forecast, by Application 2020 & 2033
- Table 11: Mexico BNPL Industry in India Revenue (billion) Forecast, by Application 2020 & 2033
- Table 12: Global BNPL Industry in India Revenue billion Forecast, by Channel 2020 & 2033
- Table 13: Global BNPL Industry in India Revenue billion Forecast, by Enterprise 2020 & 2033
- Table 14: Global BNPL Industry in India Revenue billion Forecast, by End-user 2020 & 2033
- Table 15: Global BNPL Industry in India Revenue billion Forecast, by Country 2020 & 2033
- Table 16: Brazil BNPL Industry in India Revenue (billion) Forecast, by Application 2020 & 2033
- Table 17: Argentina BNPL Industry in India Revenue (billion) Forecast, by Application 2020 & 2033
- Table 18: Rest of South America BNPL Industry in India Revenue (billion) Forecast, by Application 2020 & 2033
- Table 19: Global BNPL Industry in India Revenue billion Forecast, by Channel 2020 & 2033
- Table 20: Global BNPL Industry in India Revenue billion Forecast, by Enterprise 2020 & 2033
- Table 21: Global BNPL Industry in India Revenue billion Forecast, by End-user 2020 & 2033
- Table 22: Global BNPL Industry in India Revenue billion Forecast, by Country 2020 & 2033
- Table 23: United Kingdom BNPL Industry in India Revenue (billion) Forecast, by Application 2020 & 2033
- Table 24: Germany BNPL Industry in India Revenue (billion) Forecast, by Application 2020 & 2033
- Table 25: France BNPL Industry in India Revenue (billion) Forecast, by Application 2020 & 2033
- Table 26: Italy BNPL Industry in India Revenue (billion) Forecast, by Application 2020 & 2033
- Table 27: Spain BNPL Industry in India Revenue (billion) Forecast, by Application 2020 & 2033
- Table 28: Russia BNPL Industry in India Revenue (billion) Forecast, by Application 2020 & 2033
- Table 29: Benelux BNPL Industry in India Revenue (billion) Forecast, by Application 2020 & 2033
- Table 30: Nordics BNPL Industry in India Revenue (billion) Forecast, by Application 2020 & 2033
- Table 31: Rest of Europe BNPL Industry in India Revenue (billion) Forecast, by Application 2020 & 2033
- Table 32: Global BNPL Industry in India Revenue billion Forecast, by Channel 2020 & 2033
- Table 33: Global BNPL Industry in India Revenue billion Forecast, by Enterprise 2020 & 2033
- Table 34: Global BNPL Industry in India Revenue billion Forecast, by End-user 2020 & 2033
- Table 35: Global BNPL Industry in India Revenue billion Forecast, by Country 2020 & 2033
- Table 36: Turkey BNPL Industry in India Revenue (billion) Forecast, by Application 2020 & 2033
- Table 37: Israel BNPL Industry in India Revenue (billion) Forecast, by Application 2020 & 2033
- Table 38: GCC BNPL Industry in India Revenue (billion) Forecast, by Application 2020 & 2033
- Table 39: North Africa BNPL Industry in India Revenue (billion) Forecast, by Application 2020 & 2033
- Table 40: South Africa BNPL Industry in India Revenue (billion) Forecast, by Application 2020 & 2033
- Table 41: Rest of Middle East & Africa BNPL Industry in India Revenue (billion) Forecast, by Application 2020 & 2033
- Table 42: Global BNPL Industry in India Revenue billion Forecast, by Channel 2020 & 2033
- Table 43: Global BNPL Industry in India Revenue billion Forecast, by Enterprise 2020 & 2033
- Table 44: Global BNPL Industry in India Revenue billion Forecast, by End-user 2020 & 2033
- Table 45: Global BNPL Industry in India Revenue billion Forecast, by Country 2020 & 2033
- Table 46: China BNPL Industry in India Revenue (billion) Forecast, by Application 2020 & 2033
- Table 47: India BNPL Industry in India Revenue (billion) Forecast, by Application 2020 & 2033
- Table 48: Japan BNPL Industry in India Revenue (billion) Forecast, by Application 2020 & 2033
- Table 49: South Korea BNPL Industry in India Revenue (billion) Forecast, by Application 2020 & 2033
- Table 50: ASEAN BNPL Industry in India Revenue (billion) Forecast, by Application 2020 & 2033
- Table 51: Oceania BNPL Industry in India Revenue (billion) Forecast, by Application 2020 & 2033
- Table 52: Rest of Asia Pacific BNPL Industry in India Revenue (billion) Forecast, by Application 2020 & 2033
Frequently Asked Questions
1. What is the projected Compound Annual Growth Rate (CAGR) of the BNPL Industry in India?
The projected CAGR is approximately 13.4%.
2. Which companies are prominent players in the BNPL Industry in India?
Key companies in the market include Zest Money BNPL, Free charge, Paytm postpaid, epayLater, Mobikwik ZIP, Flipkart pay later, Olamoney Postpaid, Money Tap, Simpl, Lazy Pay, Flexmoney, Amazon Pay later, Capital float, Slice, Kreditbee, Postpe**List Not Exhaustive.
3. What are the main segments of the BNPL Industry in India?
The market segments include Channel, Enterprise, End-user.
4. Can you provide details about the market size?
The market size is estimated to be USD 21.95 billion as of 2022.
5. What are some drivers contributing to market growth?
Increasing e-commerce adoption; Rising middle class and disposable income; Access to credit and financial inclusion.
6. What are the notable trends driving market growth?
Surging E-commerce and Digital P2M Payments Boosting the Market.
7. Are there any restraints impacting market growth?
Increasing e-commerce adoption; Rising middle class and disposable income; Access to credit and financial inclusion.
8. Can you provide examples of recent developments in the market?
May 2023: ZestMoney plans to be profitable in 6 months. The fintech firm is said to be finalizing a new investment round from its existing shareholders, including Quona Capital, Zip, Omidyar Network India, Flourish VC, and Scarlet Digital. To ensure business continuity, ZestMoney plans to operate as a lending service provider (LSP), partnering with banks and NBFCs to write out loans rather than lending directly from its balance sheet.
9. What pricing options are available for accessing the report?
Pricing options include single-user, multi-user, and enterprise licenses priced at USD 3800, USD 4500, and USD 5800 respectively.
10. Is the market size provided in terms of value or volume?
The market size is provided in terms of value, measured in billion.
11. Are there any specific market keywords associated with the report?
Yes, the market keyword associated with the report is "BNPL Industry in India," which aids in identifying and referencing the specific market segment covered.
12. How do I determine which pricing option suits my needs best?
The pricing options vary based on user requirements and access needs. Individual users may opt for single-user licenses, while businesses requiring broader access may choose multi-user or enterprise licenses for cost-effective access to the report.
13. Are there any additional resources or data provided in the BNPL Industry in India report?
While the report offers comprehensive insights, it's advisable to review the specific contents or supplementary materials provided to ascertain if additional resources or data are available.
14. How can I stay updated on further developments or reports in the BNPL Industry in India?
To stay informed about further developments, trends, and reports in the BNPL Industry in India, consider subscribing to industry newsletters, following relevant companies and organizations, or regularly checking reputable industry news sources and publications.
Methodology
Step 1 - Identification of Relevant Samples Size from Population Database


Step 2 - Approaches for Defining Global Market Size (Value, Volume* & Price*)

Note*: In applicable scenarios
Step 3 - Data Sources
Primary Research
- Web Analytics
- Survey Reports
- Research Institute
- Latest Research Reports
- Opinion Leaders
Secondary Research
- Annual Reports
- White Paper
- Latest Press Release
- Industry Association
- Paid Database
- Investor Presentations

Step 4 - Data Triangulation
Involves using different sources of information in order to increase the validity of a study
These sources are likely to be stakeholders in a program - participants, other researchers, program staff, other community members, and so on.
Then we put all data in single framework & apply various statistical tools to find out the dynamic on the market.
During the analysis stage, feedback from the stakeholder groups would be compared to determine areas of agreement as well as areas of divergence