
Key Insights
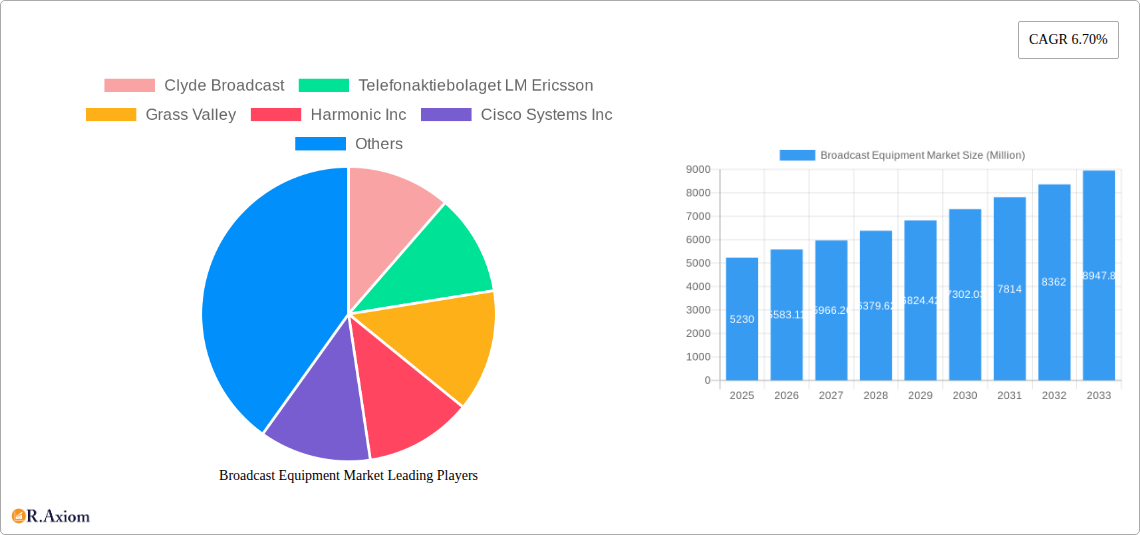
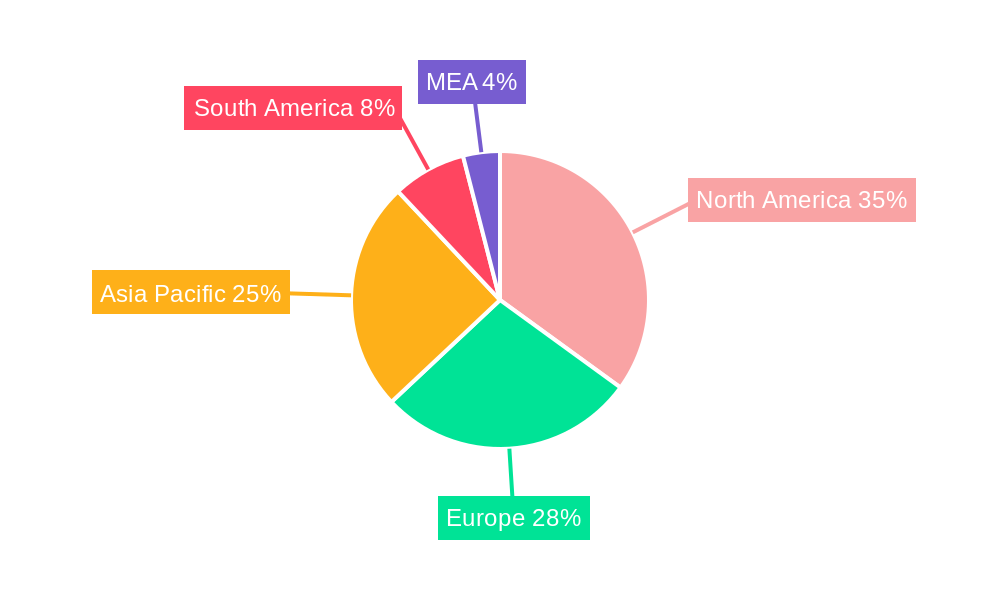
The global broadcast equipment market, valued at $5.23 billion in 2025, is projected to experience robust growth, driven by several key factors. The increasing demand for high-quality video content across multiple platforms, including over-the-top (OTT) streaming services and traditional television broadcasting, fuels the need for advanced broadcast equipment. Technological advancements, such as the transition to higher resolution formats like 4K and 8K, and the adoption of IP-based broadcasting infrastructure, are significant drivers. Furthermore, the growing popularity of live streaming events and the expansion of digital broadcasting are contributing to market expansion. Competitive pressures among broadcasters to enhance viewer experience and attract wider audiences are stimulating investments in state-of-the-art equipment. While some restraints, such as the high initial investment costs associated with upgrading infrastructure, may exist, the long-term benefits of improved efficiency and increased viewership outweigh these challenges. The market is segmented by technology (analog and digital broadcasting) and product type (dish antennas, switches, video servers, encoders, transmitters and repeaters, and other products). Geographically, North America, Europe, and Asia Pacific are expected to dominate the market, driven by high adoption rates of advanced technologies and substantial investments in media infrastructure.
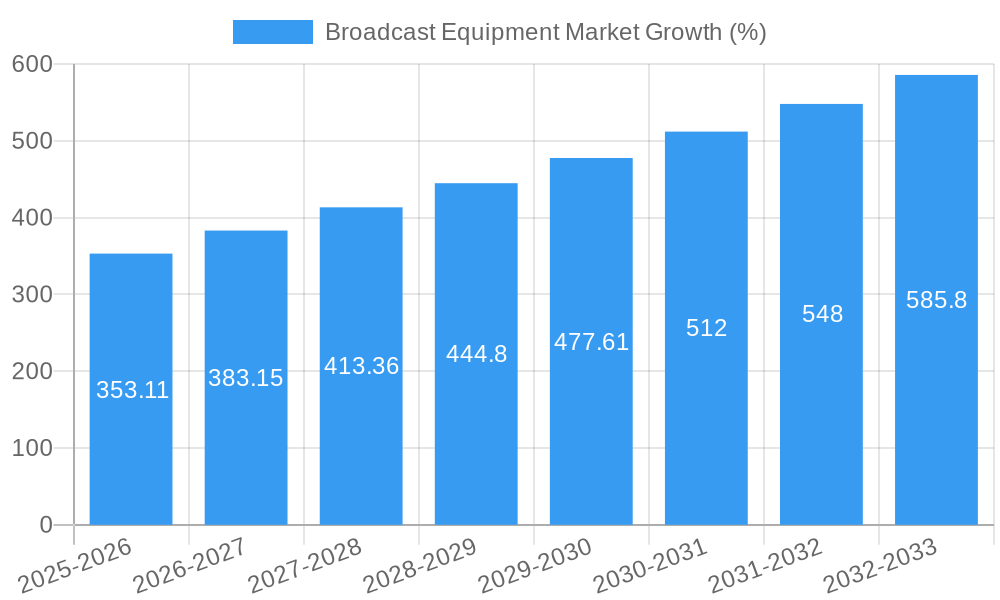
The market's Compound Annual Growth Rate (CAGR) of 6.70% from 2025 to 2033 indicates a consistently expanding market. This growth is expected to be fueled by continued technological innovations in areas like cloud-based broadcasting solutions, artificial intelligence (AI)-powered video processing, and improved cybersecurity measures within broadcast networks. The competitive landscape is characterized by a mix of established players like Ericsson, Harmonic, and Cisco, alongside specialized broadcast equipment manufacturers. Strategic partnerships and mergers & acquisitions are likely to shape the market dynamics in the coming years. Companies are focusing on developing innovative solutions that cater to the evolving needs of broadcasters, aiming to provide enhanced capabilities in terms of efficiency, scalability, and content delivery. Regional variations in growth rates will likely depend on factors like government regulations, digital infrastructure development, and the level of media consumption in different regions.
Broadcast Equipment Market: A Comprehensive Report (2019-2033)
This detailed report provides a comprehensive analysis of the Broadcast Equipment market, encompassing market size, segmentation, growth drivers, challenges, key players, and future outlook. The study period covers 2019-2033, with 2025 as the base year and a forecast period of 2025-2033. The report leverages historical data (2019-2024) to provide robust projections and actionable insights for industry stakeholders. Expect in-depth analysis across various segments including Analog and Digital Broadcasting technologies, and product categories like Dish Antennas, Switches, Video Servers, Encoders, Transmitters and Repeaters, and other products. Key players such as Clyde Broadcast, Telefonaktiebolaget LM Ericsson, Grass Valley, Harmonic Inc, Cisco Systems Inc, Sencore Inc, Evs Broadcast Equipment SA, ETL Systems Ltd, AVL Technologies Inc, and Eletec Broadcast Telecom Sarl are profiled, providing a competitive landscape analysis.
Broadcast Equipment Market Market Concentration & Innovation
The Broadcast Equipment market exhibits a moderately concentrated landscape, with a few dominant players controlling significant market share. While precise market share figures for each company require further analysis (xx%), the market is characterized by ongoing consolidation through mergers and acquisitions (M&A) activities. The value of M&A deals in the recent past has fluctuated, with some years witnessing significant deals (xx Million) and others exhibiting lower activity (xx Million). Innovation is driven primarily by the demand for higher quality video and audio transmission, increased bandwidth efficiency, and the integration of IP-based technologies. Stringent regulatory frameworks concerning spectrum allocation and broadcasting standards significantly influence market dynamics. The emergence of streaming platforms and over-the-top (OTT) services acts as a significant substitute, compelling traditional broadcasters to invest in advanced equipment to remain competitive. End-user trends, such as the rising demand for high-definition (HD) and ultra-high-definition (UHD) content, further fuel innovation.
- Market Concentration: Moderately concentrated, with several large players and smaller niche players.
- Innovation Drivers: Demand for higher quality, IP-based technologies, bandwidth efficiency.
- Regulatory Frameworks: Significant impact on spectrum allocation and broadcasting standards.
- Product Substitutes: OTT services and streaming platforms.
- End-User Trends: Growing demand for HD and UHD content.
- M&A Activity: Fluctuating deal values, reflecting consolidation trends.
Broadcast Equipment Market Industry Trends & Insights
The Broadcast Equipment market is experiencing robust growth, driven by several key factors. The global market is projected to achieve a Compound Annual Growth Rate (CAGR) of xx% during the forecast period (2025-2033), reaching a market value of xx Million by 2033. The increasing adoption of digital broadcasting technologies is a major catalyst, as is the growing demand for high-quality content across various platforms. Technological advancements, particularly in areas like 5G and cloud computing, are further disrupting the market, enabling efficient content delivery and improved workflow management. Consumer preferences are shifting toward on-demand and personalized content, necessitating upgrades in broadcasting infrastructure to cater to these needs. Competitive dynamics are characterized by continuous innovation and the development of specialized solutions, pushing market penetration into niche applications and geographical areas.
Dominant Markets & Segments in Broadcast Equipment Market
The North American region currently holds a dominant position in the Broadcast Equipment market, largely due to its well-established broadcasting infrastructure and the presence of major players. However, the Asia-Pacific region is projected to witness significant growth during the forecast period, driven by increasing investments in broadcasting infrastructure and expanding media and entertainment sectors.
By Technology:
- Digital Broadcasting: This segment dominates the market due to its superior quality, flexibility, and efficiency compared to analog broadcasting. Key drivers include government initiatives promoting digital switchover and technological advancements.
- Analog Broadcasting: This segment is gradually declining due to the global shift towards digital technologies.
By Product:
- Video Servers: High demand due to their ability to store and manage large amounts of video data for efficient broadcasting.
- Encoders and Transmitters: Essential components of broadcasting systems, witnessing stable growth.
- Switches: Vital for efficient routing of video and audio signals within broadcast networks.
- Dish Antennas: Growth influenced by the continued demand for satellite broadcasting and improvements in antenna technology.
- Other Products: This segment encompasses various smaller components and accessories, exhibiting moderate growth.
Broadcast Equipment Market Product Developments
Recent product developments are heavily focused on enhancing video quality, improving transmission efficiency, and simplifying workflow management. Technological trends such as 5G integration, AI-powered content management systems, and cloud-based solutions are driving the development of advanced broadcast equipment. New products are aimed at addressing specific market needs, such as improved latency for live broadcasting and increased mobility for outside broadcasting (OB) applications. The competitive landscape necessitates continuous innovation to maintain market share and attract new customers.
Report Scope & Segmentation Analysis
This report provides a comprehensive analysis of the Broadcast Equipment market across various segments:
- By Technology: Analog Broadcasting and Digital Broadcasting, with individual growth projections and competitive analysis for each segment. Digital Broadcasting holds a larger market share and is projected for stronger growth.
- By Product: Dish Antennas, Switches, Video Servers, Encoders, Transmitters and Repeaters, and Other Products, with detailed market size, growth projections, and competitive dynamics within each segment. Video servers and encoders are major segments.
Key Drivers of Broadcast Equipment Market Growth
Several factors fuel growth in the Broadcast Equipment market. The rising adoption of digital broadcasting is a major driver. Furthermore, the proliferation of high-definition and ultra-high-definition content demands advanced equipment. The integration of IP technologies and cloud solutions provides improved efficiency and scalability, driving demand. Government initiatives promoting digital switchovers and investments in infrastructure also contribute to market growth.
Challenges in the Broadcast Equipment Market Sector
The Broadcast Equipment market faces several challenges. High initial investment costs for advanced equipment can limit adoption, particularly in developing countries. The increasing complexity of broadcasting technologies necessitates specialized technical expertise. Competition from emerging technologies and the ongoing shift to online streaming presents substantial challenges. Supply chain disruptions due to global events may impact the availability of certain components. Regulatory hurdles and changing broadcasting standards also pose challenges for manufacturers.
Emerging Opportunities in Broadcast Equipment Market
Emerging opportunities in the Broadcast Equipment market include the increasing demand for 4K and 8K broadcasting, the integration of artificial intelligence and machine learning for automation and workflow optimization, and the rise of 5G technology for improved connectivity. The expansion into new geographical markets and the development of niche solutions for specific applications, such as live sports broadcasting and virtual production, represent significant opportunities.
Leading Players in the Broadcast Equipment Market Market
- Clyde Broadcast
- Telefonaktiebolaget LM Ericsson
- Grass Valley
- Harmonic Inc
- Cisco Systems Inc
- Sencore Inc
- Evs Broadcast Equipment SA
- ETL Systems Ltd
- AVL Technologies Inc
- Eletec Broadcast Telecom Sarl
Key Developments in Broadcast Equipment Market Industry
- May 2024: Hollyland launched the Pyro H video transmitter, featuring enhanced stability and dual-band technology, impacting film production and live event broadcasting.
- February 2024: VMware's (Broadcom Inc.) Telco Cloud Service Assurance deployment by DISH Wireless improved 5G network monitoring and user experience, influencing broadcasting infrastructure development.
- September 2023: Cloudbass' significant investment in EVS' LiveCeption Signature solution upgraded its live production capabilities, impacting high-end broadcasting services.
Strategic Outlook for Broadcast Equipment Market Market
The Broadcast Equipment market is poised for continued growth driven by technological advancements, increasing demand for high-quality content, and the expansion of broadcasting infrastructure globally. The integration of 5G and cloud technologies will further shape market dynamics, while the rising demand for personalized and immersive viewing experiences presents significant opportunities for innovation and growth. Companies focusing on efficient solutions, tailored to specific market needs, and capable of adapting to rapid technological change are best positioned for success in this dynamic market.
Broadcast Equipment Market Segmentation
-
1. Technology
- 1.1. Analog Broadcasting
- 1.2. Digital Broadcasting
-
2. Product
- 2.1. Dish Antennas
- 2.2. Switches
- 2.3. Video Servers
- 2.4. Encoders
- 2.5. Transmitters and Repeaters
- 2.6. Other Products
Broadcast Equipment Market Segmentation By Geography
- 1. North America
- 2. Europe
- 3. Asia Pacific
- 4. Latin America
- 5. Middle East and Africa
Broadcast Equipment Market REPORT HIGHLIGHTS
| Aspects | Details |
|---|---|
| Study Period | 2019-2033 |
| Base Year | 2024 |
| Estimated Year | 2025 |
| Forecast Period | 2025-2033 |
| Historical Period | 2019-2024 |
| Growth Rate | CAGR of 6.70% from 2019-2033 |
| Segmentation |
|
Table of Contents
- 1. Introduction
- 1.1. Research Scope
- 1.2. Market Segmentation
- 1.3. Research Methodology
- 1.4. Definitions and Assumptions
- 2. Executive Summary
- 2.1. Introduction
- 3. Market Dynamics
- 3.1. Introduction
- 3.2. Market Drivers
- 3.2.1. Growing Demand for Encoders due to Support for Multiple Formats; Growing D2C Offerings through OTT Services; Increased Adoption of SAAS Solutions
- 3.3. Market Restrains
- 3.3.1. High Capital Required for Deployment
- 3.4. Market Trends
- 3.4.1. Encoders are Expected to Witness Significant Growth
- 4. Market Factor Analysis
- 4.1. Porters Five Forces
- 4.2. Supply/Value Chain
- 4.3. PESTEL analysis
- 4.4. Market Entropy
- 4.5. Patent/Trademark Analysis
- 5. Global Broadcast Equipment Market Analysis, Insights and Forecast, 2019-2031
- 5.1. Market Analysis, Insights and Forecast - by Technology
- 5.1.1. Analog Broadcasting
- 5.1.2. Digital Broadcasting
- 5.2. Market Analysis, Insights and Forecast - by Product
- 5.2.1. Dish Antennas
- 5.2.2. Switches
- 5.2.3. Video Servers
- 5.2.4. Encoders
- 5.2.5. Transmitters and Repeaters
- 5.2.6. Other Products
- 5.3. Market Analysis, Insights and Forecast - by Region
- 5.3.1. North America
- 5.3.2. Europe
- 5.3.3. Asia Pacific
- 5.3.4. Latin America
- 5.3.5. Middle East and Africa
- 5.1. Market Analysis, Insights and Forecast - by Technology
- 6. North America Broadcast Equipment Market Analysis, Insights and Forecast, 2019-2031
- 6.1. Market Analysis, Insights and Forecast - by Technology
- 6.1.1. Analog Broadcasting
- 6.1.2. Digital Broadcasting
- 6.2. Market Analysis, Insights and Forecast - by Product
- 6.2.1. Dish Antennas
- 6.2.2. Switches
- 6.2.3. Video Servers
- 6.2.4. Encoders
- 6.2.5. Transmitters and Repeaters
- 6.2.6. Other Products
- 6.1. Market Analysis, Insights and Forecast - by Technology
- 7. Europe Broadcast Equipment Market Analysis, Insights and Forecast, 2019-2031
- 7.1. Market Analysis, Insights and Forecast - by Technology
- 7.1.1. Analog Broadcasting
- 7.1.2. Digital Broadcasting
- 7.2. Market Analysis, Insights and Forecast - by Product
- 7.2.1. Dish Antennas
- 7.2.2. Switches
- 7.2.3. Video Servers
- 7.2.4. Encoders
- 7.2.5. Transmitters and Repeaters
- 7.2.6. Other Products
- 7.1. Market Analysis, Insights and Forecast - by Technology
- 8. Asia Pacific Broadcast Equipment Market Analysis, Insights and Forecast, 2019-2031
- 8.1. Market Analysis, Insights and Forecast - by Technology
- 8.1.1. Analog Broadcasting
- 8.1.2. Digital Broadcasting
- 8.2. Market Analysis, Insights and Forecast - by Product
- 8.2.1. Dish Antennas
- 8.2.2. Switches
- 8.2.3. Video Servers
- 8.2.4. Encoders
- 8.2.5. Transmitters and Repeaters
- 8.2.6. Other Products
- 8.1. Market Analysis, Insights and Forecast - by Technology
- 9. Latin America Broadcast Equipment Market Analysis, Insights and Forecast, 2019-2031
- 9.1. Market Analysis, Insights and Forecast - by Technology
- 9.1.1. Analog Broadcasting
- 9.1.2. Digital Broadcasting
- 9.2. Market Analysis, Insights and Forecast - by Product
- 9.2.1. Dish Antennas
- 9.2.2. Switches
- 9.2.3. Video Servers
- 9.2.4. Encoders
- 9.2.5. Transmitters and Repeaters
- 9.2.6. Other Products
- 9.1. Market Analysis, Insights and Forecast - by Technology
- 10. Middle East and Africa Broadcast Equipment Market Analysis, Insights and Forecast, 2019-2031
- 10.1. Market Analysis, Insights and Forecast - by Technology
- 10.1.1. Analog Broadcasting
- 10.1.2. Digital Broadcasting
- 10.2. Market Analysis, Insights and Forecast - by Product
- 10.2.1. Dish Antennas
- 10.2.2. Switches
- 10.2.3. Video Servers
- 10.2.4. Encoders
- 10.2.5. Transmitters and Repeaters
- 10.2.6. Other Products
- 10.1. Market Analysis, Insights and Forecast - by Technology
- 11. North America Broadcast Equipment Market Analysis, Insights and Forecast, 2019-2031
- 11.1. Market Analysis, Insights and Forecast - By Country/Sub-region
- 11.1.1 United States
- 11.1.2 Canada
- 11.1.3 Mexico
- 12. Europe Broadcast Equipment Market Analysis, Insights and Forecast, 2019-2031
- 12.1. Market Analysis, Insights and Forecast - By Country/Sub-region
- 12.1.1 Germany
- 12.1.2 United Kingdom
- 12.1.3 France
- 12.1.4 Spain
- 12.1.5 Italy
- 12.1.6 Spain
- 12.1.7 Belgium
- 12.1.8 Netherland
- 12.1.9 Nordics
- 12.1.10 Rest of Europe
- 13. Asia Pacific Broadcast Equipment Market Analysis, Insights and Forecast, 2019-2031
- 13.1. Market Analysis, Insights and Forecast - By Country/Sub-region
- 13.1.1 China
- 13.1.2 Japan
- 13.1.3 India
- 13.1.4 South Korea
- 13.1.5 Southeast Asia
- 13.1.6 Australia
- 13.1.7 Indonesia
- 13.1.8 Phillipes
- 13.1.9 Singapore
- 13.1.10 Thailandc
- 13.1.11 Rest of Asia Pacific
- 14. South America Broadcast Equipment Market Analysis, Insights and Forecast, 2019-2031
- 14.1. Market Analysis, Insights and Forecast - By Country/Sub-region
- 14.1.1 Brazil
- 14.1.2 Argentina
- 14.1.3 Peru
- 14.1.4 Chile
- 14.1.5 Colombia
- 14.1.6 Ecuador
- 14.1.7 Venezuela
- 14.1.8 Rest of South America
- 15. North America Broadcast Equipment Market Analysis, Insights and Forecast, 2019-2031
- 15.1. Market Analysis, Insights and Forecast - By Country/Sub-region
- 15.1.1 United States
- 15.1.2 Canada
- 15.1.3 Mexico
- 16. MEA Broadcast Equipment Market Analysis, Insights and Forecast, 2019-2031
- 16.1. Market Analysis, Insights and Forecast - By Country/Sub-region
- 16.1.1 United Arab Emirates
- 16.1.2 Saudi Arabia
- 16.1.3 South Africa
- 16.1.4 Rest of Middle East and Africa
- 17. Competitive Analysis
- 17.1. Global Market Share Analysis 2024
- 17.2. Company Profiles
- 17.2.1 Clyde Broadcast
- 17.2.1.1. Overview
- 17.2.1.2. Products
- 17.2.1.3. SWOT Analysis
- 17.2.1.4. Recent Developments
- 17.2.1.5. Financials (Based on Availability)
- 17.2.2 Telefonaktiebolaget LM Ericsson
- 17.2.2.1. Overview
- 17.2.2.2. Products
- 17.2.2.3. SWOT Analysis
- 17.2.2.4. Recent Developments
- 17.2.2.5. Financials (Based on Availability)
- 17.2.3 Grass Valley
- 17.2.3.1. Overview
- 17.2.3.2. Products
- 17.2.3.3. SWOT Analysis
- 17.2.3.4. Recent Developments
- 17.2.3.5. Financials (Based on Availability)
- 17.2.4 Harmonic Inc
- 17.2.4.1. Overview
- 17.2.4.2. Products
- 17.2.4.3. SWOT Analysis
- 17.2.4.4. Recent Developments
- 17.2.4.5. Financials (Based on Availability)
- 17.2.5 Cisco Systems Inc
- 17.2.5.1. Overview
- 17.2.5.2. Products
- 17.2.5.3. SWOT Analysis
- 17.2.5.4. Recent Developments
- 17.2.5.5. Financials (Based on Availability)
- 17.2.6 Sencore Inc
- 17.2.6.1. Overview
- 17.2.6.2. Products
- 17.2.6.3. SWOT Analysis
- 17.2.6.4. Recent Developments
- 17.2.6.5. Financials (Based on Availability)
- 17.2.7 Evs Broadcast Equipment SA
- 17.2.7.1. Overview
- 17.2.7.2. Products
- 17.2.7.3. SWOT Analysis
- 17.2.7.4. Recent Developments
- 17.2.7.5. Financials (Based on Availability)
- 17.2.8 ETL Systems Ltd
- 17.2.8.1. Overview
- 17.2.8.2. Products
- 17.2.8.3. SWOT Analysis
- 17.2.8.4. Recent Developments
- 17.2.8.5. Financials (Based on Availability)
- 17.2.9 AVL Technologies Inc
- 17.2.9.1. Overview
- 17.2.9.2. Products
- 17.2.9.3. SWOT Analysis
- 17.2.9.4. Recent Developments
- 17.2.9.5. Financials (Based on Availability)
- 17.2.10 Eletec Broadcast Telecom Sarl
- 17.2.10.1. Overview
- 17.2.10.2. Products
- 17.2.10.3. SWOT Analysis
- 17.2.10.4. Recent Developments
- 17.2.10.5. Financials (Based on Availability)
- 17.2.1 Clyde Broadcast
List of Figures
- Figure 1: Global Broadcast Equipment Market Revenue Breakdown (Million, %) by Region 2024 & 2032
- Figure 2: Global Broadcast Equipment Market Volume Breakdown (K Unit, %) by Region 2024 & 2032
- Figure 3: North America Broadcast Equipment Market Revenue (Million), by Country 2024 & 2032
- Figure 4: North America Broadcast Equipment Market Volume (K Unit), by Country 2024 & 2032
- Figure 5: North America Broadcast Equipment Market Revenue Share (%), by Country 2024 & 2032
- Figure 6: North America Broadcast Equipment Market Volume Share (%), by Country 2024 & 2032
- Figure 7: Europe Broadcast Equipment Market Revenue (Million), by Country 2024 & 2032
- Figure 8: Europe Broadcast Equipment Market Volume (K Unit), by Country 2024 & 2032
- Figure 9: Europe Broadcast Equipment Market Revenue Share (%), by Country 2024 & 2032
- Figure 10: Europe Broadcast Equipment Market Volume Share (%), by Country 2024 & 2032
- Figure 11: Asia Pacific Broadcast Equipment Market Revenue (Million), by Country 2024 & 2032
- Figure 12: Asia Pacific Broadcast Equipment Market Volume (K Unit), by Country 2024 & 2032
- Figure 13: Asia Pacific Broadcast Equipment Market Revenue Share (%), by Country 2024 & 2032
- Figure 14: Asia Pacific Broadcast Equipment Market Volume Share (%), by Country 2024 & 2032
- Figure 15: South America Broadcast Equipment Market Revenue (Million), by Country 2024 & 2032
- Figure 16: South America Broadcast Equipment Market Volume (K Unit), by Country 2024 & 2032
- Figure 17: South America Broadcast Equipment Market Revenue Share (%), by Country 2024 & 2032
- Figure 18: South America Broadcast Equipment Market Volume Share (%), by Country 2024 & 2032
- Figure 19: North America Broadcast Equipment Market Revenue (Million), by Country 2024 & 2032
- Figure 20: North America Broadcast Equipment Market Volume (K Unit), by Country 2024 & 2032
- Figure 21: North America Broadcast Equipment Market Revenue Share (%), by Country 2024 & 2032
- Figure 22: North America Broadcast Equipment Market Volume Share (%), by Country 2024 & 2032
- Figure 23: MEA Broadcast Equipment Market Revenue (Million), by Country 2024 & 2032
- Figure 24: MEA Broadcast Equipment Market Volume (K Unit), by Country 2024 & 2032
- Figure 25: MEA Broadcast Equipment Market Revenue Share (%), by Country 2024 & 2032
- Figure 26: MEA Broadcast Equipment Market Volume Share (%), by Country 2024 & 2032
- Figure 27: North America Broadcast Equipment Market Revenue (Million), by Technology 2024 & 2032
- Figure 28: North America Broadcast Equipment Market Volume (K Unit), by Technology 2024 & 2032
- Figure 29: North America Broadcast Equipment Market Revenue Share (%), by Technology 2024 & 2032
- Figure 30: North America Broadcast Equipment Market Volume Share (%), by Technology 2024 & 2032
- Figure 31: North America Broadcast Equipment Market Revenue (Million), by Product 2024 & 2032
- Figure 32: North America Broadcast Equipment Market Volume (K Unit), by Product 2024 & 2032
- Figure 33: North America Broadcast Equipment Market Revenue Share (%), by Product 2024 & 2032
- Figure 34: North America Broadcast Equipment Market Volume Share (%), by Product 2024 & 2032
- Figure 35: North America Broadcast Equipment Market Revenue (Million), by Country 2024 & 2032
- Figure 36: North America Broadcast Equipment Market Volume (K Unit), by Country 2024 & 2032
- Figure 37: North America Broadcast Equipment Market Revenue Share (%), by Country 2024 & 2032
- Figure 38: North America Broadcast Equipment Market Volume Share (%), by Country 2024 & 2032
- Figure 39: Europe Broadcast Equipment Market Revenue (Million), by Technology 2024 & 2032
- Figure 40: Europe Broadcast Equipment Market Volume (K Unit), by Technology 2024 & 2032
- Figure 41: Europe Broadcast Equipment Market Revenue Share (%), by Technology 2024 & 2032
- Figure 42: Europe Broadcast Equipment Market Volume Share (%), by Technology 2024 & 2032
- Figure 43: Europe Broadcast Equipment Market Revenue (Million), by Product 2024 & 2032
- Figure 44: Europe Broadcast Equipment Market Volume (K Unit), by Product 2024 & 2032
- Figure 45: Europe Broadcast Equipment Market Revenue Share (%), by Product 2024 & 2032
- Figure 46: Europe Broadcast Equipment Market Volume Share (%), by Product 2024 & 2032
- Figure 47: Europe Broadcast Equipment Market Revenue (Million), by Country 2024 & 2032
- Figure 48: Europe Broadcast Equipment Market Volume (K Unit), by Country 2024 & 2032
- Figure 49: Europe Broadcast Equipment Market Revenue Share (%), by Country 2024 & 2032
- Figure 50: Europe Broadcast Equipment Market Volume Share (%), by Country 2024 & 2032
- Figure 51: Asia Pacific Broadcast Equipment Market Revenue (Million), by Technology 2024 & 2032
- Figure 52: Asia Pacific Broadcast Equipment Market Volume (K Unit), by Technology 2024 & 2032
- Figure 53: Asia Pacific Broadcast Equipment Market Revenue Share (%), by Technology 2024 & 2032
- Figure 54: Asia Pacific Broadcast Equipment Market Volume Share (%), by Technology 2024 & 2032
- Figure 55: Asia Pacific Broadcast Equipment Market Revenue (Million), by Product 2024 & 2032
- Figure 56: Asia Pacific Broadcast Equipment Market Volume (K Unit), by Product 2024 & 2032
- Figure 57: Asia Pacific Broadcast Equipment Market Revenue Share (%), by Product 2024 & 2032
- Figure 58: Asia Pacific Broadcast Equipment Market Volume Share (%), by Product 2024 & 2032
- Figure 59: Asia Pacific Broadcast Equipment Market Revenue (Million), by Country 2024 & 2032
- Figure 60: Asia Pacific Broadcast Equipment Market Volume (K Unit), by Country 2024 & 2032
- Figure 61: Asia Pacific Broadcast Equipment Market Revenue Share (%), by Country 2024 & 2032
- Figure 62: Asia Pacific Broadcast Equipment Market Volume Share (%), by Country 2024 & 2032
- Figure 63: Latin America Broadcast Equipment Market Revenue (Million), by Technology 2024 & 2032
- Figure 64: Latin America Broadcast Equipment Market Volume (K Unit), by Technology 2024 & 2032
- Figure 65: Latin America Broadcast Equipment Market Revenue Share (%), by Technology 2024 & 2032
- Figure 66: Latin America Broadcast Equipment Market Volume Share (%), by Technology 2024 & 2032
- Figure 67: Latin America Broadcast Equipment Market Revenue (Million), by Product 2024 & 2032
- Figure 68: Latin America Broadcast Equipment Market Volume (K Unit), by Product 2024 & 2032
- Figure 69: Latin America Broadcast Equipment Market Revenue Share (%), by Product 2024 & 2032
- Figure 70: Latin America Broadcast Equipment Market Volume Share (%), by Product 2024 & 2032
- Figure 71: Latin America Broadcast Equipment Market Revenue (Million), by Country 2024 & 2032
- Figure 72: Latin America Broadcast Equipment Market Volume (K Unit), by Country 2024 & 2032
- Figure 73: Latin America Broadcast Equipment Market Revenue Share (%), by Country 2024 & 2032
- Figure 74: Latin America Broadcast Equipment Market Volume Share (%), by Country 2024 & 2032
- Figure 75: Middle East and Africa Broadcast Equipment Market Revenue (Million), by Technology 2024 & 2032
- Figure 76: Middle East and Africa Broadcast Equipment Market Volume (K Unit), by Technology 2024 & 2032
- Figure 77: Middle East and Africa Broadcast Equipment Market Revenue Share (%), by Technology 2024 & 2032
- Figure 78: Middle East and Africa Broadcast Equipment Market Volume Share (%), by Technology 2024 & 2032
- Figure 79: Middle East and Africa Broadcast Equipment Market Revenue (Million), by Product 2024 & 2032
- Figure 80: Middle East and Africa Broadcast Equipment Market Volume (K Unit), by Product 2024 & 2032
- Figure 81: Middle East and Africa Broadcast Equipment Market Revenue Share (%), by Product 2024 & 2032
- Figure 82: Middle East and Africa Broadcast Equipment Market Volume Share (%), by Product 2024 & 2032
- Figure 83: Middle East and Africa Broadcast Equipment Market Revenue (Million), by Country 2024 & 2032
- Figure 84: Middle East and Africa Broadcast Equipment Market Volume (K Unit), by Country 2024 & 2032
- Figure 85: Middle East and Africa Broadcast Equipment Market Revenue Share (%), by Country 2024 & 2032
- Figure 86: Middle East and Africa Broadcast Equipment Market Volume Share (%), by Country 2024 & 2032
List of Tables
- Table 1: Global Broadcast Equipment Market Revenue Million Forecast, by Region 2019 & 2032
- Table 2: Global Broadcast Equipment Market Volume K Unit Forecast, by Region 2019 & 2032
- Table 3: Global Broadcast Equipment Market Revenue Million Forecast, by Technology 2019 & 2032
- Table 4: Global Broadcast Equipment Market Volume K Unit Forecast, by Technology 2019 & 2032
- Table 5: Global Broadcast Equipment Market Revenue Million Forecast, by Product 2019 & 2032
- Table 6: Global Broadcast Equipment Market Volume K Unit Forecast, by Product 2019 & 2032
- Table 7: Global Broadcast Equipment Market Revenue Million Forecast, by Region 2019 & 2032
- Table 8: Global Broadcast Equipment Market Volume K Unit Forecast, by Region 2019 & 2032
- Table 9: Global Broadcast Equipment Market Revenue Million Forecast, by Country 2019 & 2032
- Table 10: Global Broadcast Equipment Market Volume K Unit Forecast, by Country 2019 & 2032
- Table 11: United States Broadcast Equipment Market Revenue (Million) Forecast, by Application 2019 & 2032
- Table 12: United States Broadcast Equipment Market Volume (K Unit) Forecast, by Application 2019 & 2032
- Table 13: Canada Broadcast Equipment Market Revenue (Million) Forecast, by Application 2019 & 2032
- Table 14: Canada Broadcast Equipment Market Volume (K Unit) Forecast, by Application 2019 & 2032
- Table 15: Mexico Broadcast Equipment Market Revenue (Million) Forecast, by Application 2019 & 2032
- Table 16: Mexico Broadcast Equipment Market Volume (K Unit) Forecast, by Application 2019 & 2032
- Table 17: Global Broadcast Equipment Market Revenue Million Forecast, by Country 2019 & 2032
- Table 18: Global Broadcast Equipment Market Volume K Unit Forecast, by Country 2019 & 2032
- Table 19: Germany Broadcast Equipment Market Revenue (Million) Forecast, by Application 2019 & 2032
- Table 20: Germany Broadcast Equipment Market Volume (K Unit) Forecast, by Application 2019 & 2032
- Table 21: United Kingdom Broadcast Equipment Market Revenue (Million) Forecast, by Application 2019 & 2032
- Table 22: United Kingdom Broadcast Equipment Market Volume (K Unit) Forecast, by Application 2019 & 2032
- Table 23: France Broadcast Equipment Market Revenue (Million) Forecast, by Application 2019 & 2032
- Table 24: France Broadcast Equipment Market Volume (K Unit) Forecast, by Application 2019 & 2032
- Table 25: Spain Broadcast Equipment Market Revenue (Million) Forecast, by Application 2019 & 2032
- Table 26: Spain Broadcast Equipment Market Volume (K Unit) Forecast, by Application 2019 & 2032
- Table 27: Italy Broadcast Equipment Market Revenue (Million) Forecast, by Application 2019 & 2032
- Table 28: Italy Broadcast Equipment Market Volume (K Unit) Forecast, by Application 2019 & 2032
- Table 29: Spain Broadcast Equipment Market Revenue (Million) Forecast, by Application 2019 & 2032
- Table 30: Spain Broadcast Equipment Market Volume (K Unit) Forecast, by Application 2019 & 2032
- Table 31: Belgium Broadcast Equipment Market Revenue (Million) Forecast, by Application 2019 & 2032
- Table 32: Belgium Broadcast Equipment Market Volume (K Unit) Forecast, by Application 2019 & 2032
- Table 33: Netherland Broadcast Equipment Market Revenue (Million) Forecast, by Application 2019 & 2032
- Table 34: Netherland Broadcast Equipment Market Volume (K Unit) Forecast, by Application 2019 & 2032
- Table 35: Nordics Broadcast Equipment Market Revenue (Million) Forecast, by Application 2019 & 2032
- Table 36: Nordics Broadcast Equipment Market Volume (K Unit) Forecast, by Application 2019 & 2032
- Table 37: Rest of Europe Broadcast Equipment Market Revenue (Million) Forecast, by Application 2019 & 2032
- Table 38: Rest of Europe Broadcast Equipment Market Volume (K Unit) Forecast, by Application 2019 & 2032
- Table 39: Global Broadcast Equipment Market Revenue Million Forecast, by Country 2019 & 2032
- Table 40: Global Broadcast Equipment Market Volume K Unit Forecast, by Country 2019 & 2032
- Table 41: China Broadcast Equipment Market Revenue (Million) Forecast, by Application 2019 & 2032
- Table 42: China Broadcast Equipment Market Volume (K Unit) Forecast, by Application 2019 & 2032
- Table 43: Japan Broadcast Equipment Market Revenue (Million) Forecast, by Application 2019 & 2032
- Table 44: Japan Broadcast Equipment Market Volume (K Unit) Forecast, by Application 2019 & 2032
- Table 45: India Broadcast Equipment Market Revenue (Million) Forecast, by Application 2019 & 2032
- Table 46: India Broadcast Equipment Market Volume (K Unit) Forecast, by Application 2019 & 2032
- Table 47: South Korea Broadcast Equipment Market Revenue (Million) Forecast, by Application 2019 & 2032
- Table 48: South Korea Broadcast Equipment Market Volume (K Unit) Forecast, by Application 2019 & 2032
- Table 49: Southeast Asia Broadcast Equipment Market Revenue (Million) Forecast, by Application 2019 & 2032
- Table 50: Southeast Asia Broadcast Equipment Market Volume (K Unit) Forecast, by Application 2019 & 2032
- Table 51: Australia Broadcast Equipment Market Revenue (Million) Forecast, by Application 2019 & 2032
- Table 52: Australia Broadcast Equipment Market Volume (K Unit) Forecast, by Application 2019 & 2032
- Table 53: Indonesia Broadcast Equipment Market Revenue (Million) Forecast, by Application 2019 & 2032
- Table 54: Indonesia Broadcast Equipment Market Volume (K Unit) Forecast, by Application 2019 & 2032
- Table 55: Phillipes Broadcast Equipment Market Revenue (Million) Forecast, by Application 2019 & 2032
- Table 56: Phillipes Broadcast Equipment Market Volume (K Unit) Forecast, by Application 2019 & 2032
- Table 57: Singapore Broadcast Equipment Market Revenue (Million) Forecast, by Application 2019 & 2032
- Table 58: Singapore Broadcast Equipment Market Volume (K Unit) Forecast, by Application 2019 & 2032
- Table 59: Thailandc Broadcast Equipment Market Revenue (Million) Forecast, by Application 2019 & 2032
- Table 60: Thailandc Broadcast Equipment Market Volume (K Unit) Forecast, by Application 2019 & 2032
- Table 61: Rest of Asia Pacific Broadcast Equipment Market Revenue (Million) Forecast, by Application 2019 & 2032
- Table 62: Rest of Asia Pacific Broadcast Equipment Market Volume (K Unit) Forecast, by Application 2019 & 2032
- Table 63: Global Broadcast Equipment Market Revenue Million Forecast, by Country 2019 & 2032
- Table 64: Global Broadcast Equipment Market Volume K Unit Forecast, by Country 2019 & 2032
- Table 65: Brazil Broadcast Equipment Market Revenue (Million) Forecast, by Application 2019 & 2032
- Table 66: Brazil Broadcast Equipment Market Volume (K Unit) Forecast, by Application 2019 & 2032
- Table 67: Argentina Broadcast Equipment Market Revenue (Million) Forecast, by Application 2019 & 2032
- Table 68: Argentina Broadcast Equipment Market Volume (K Unit) Forecast, by Application 2019 & 2032
- Table 69: Peru Broadcast Equipment Market Revenue (Million) Forecast, by Application 2019 & 2032
- Table 70: Peru Broadcast Equipment Market Volume (K Unit) Forecast, by Application 2019 & 2032
- Table 71: Chile Broadcast Equipment Market Revenue (Million) Forecast, by Application 2019 & 2032
- Table 72: Chile Broadcast Equipment Market Volume (K Unit) Forecast, by Application 2019 & 2032
- Table 73: Colombia Broadcast Equipment Market Revenue (Million) Forecast, by Application 2019 & 2032
- Table 74: Colombia Broadcast Equipment Market Volume (K Unit) Forecast, by Application 2019 & 2032
- Table 75: Ecuador Broadcast Equipment Market Revenue (Million) Forecast, by Application 2019 & 2032
- Table 76: Ecuador Broadcast Equipment Market Volume (K Unit) Forecast, by Application 2019 & 2032
- Table 77: Venezuela Broadcast Equipment Market Revenue (Million) Forecast, by Application 2019 & 2032
- Table 78: Venezuela Broadcast Equipment Market Volume (K Unit) Forecast, by Application 2019 & 2032
- Table 79: Rest of South America Broadcast Equipment Market Revenue (Million) Forecast, by Application 2019 & 2032
- Table 80: Rest of South America Broadcast Equipment Market Volume (K Unit) Forecast, by Application 2019 & 2032
- Table 81: Global Broadcast Equipment Market Revenue Million Forecast, by Country 2019 & 2032
- Table 82: Global Broadcast Equipment Market Volume K Unit Forecast, by Country 2019 & 2032
- Table 83: United States Broadcast Equipment Market Revenue (Million) Forecast, by Application 2019 & 2032
- Table 84: United States Broadcast Equipment Market Volume (K Unit) Forecast, by Application 2019 & 2032
- Table 85: Canada Broadcast Equipment Market Revenue (Million) Forecast, by Application 2019 & 2032
- Table 86: Canada Broadcast Equipment Market Volume (K Unit) Forecast, by Application 2019 & 2032
- Table 87: Mexico Broadcast Equipment Market Revenue (Million) Forecast, by Application 2019 & 2032
- Table 88: Mexico Broadcast Equipment Market Volume (K Unit) Forecast, by Application 2019 & 2032
- Table 89: Global Broadcast Equipment Market Revenue Million Forecast, by Country 2019 & 2032
- Table 90: Global Broadcast Equipment Market Volume K Unit Forecast, by Country 2019 & 2032
- Table 91: United Arab Emirates Broadcast Equipment Market Revenue (Million) Forecast, by Application 2019 & 2032
- Table 92: United Arab Emirates Broadcast Equipment Market Volume (K Unit) Forecast, by Application 2019 & 2032
- Table 93: Saudi Arabia Broadcast Equipment Market Revenue (Million) Forecast, by Application 2019 & 2032
- Table 94: Saudi Arabia Broadcast Equipment Market Volume (K Unit) Forecast, by Application 2019 & 2032
- Table 95: South Africa Broadcast Equipment Market Revenue (Million) Forecast, by Application 2019 & 2032
- Table 96: South Africa Broadcast Equipment Market Volume (K Unit) Forecast, by Application 2019 & 2032
- Table 97: Rest of Middle East and Africa Broadcast Equipment Market Revenue (Million) Forecast, by Application 2019 & 2032
- Table 98: Rest of Middle East and Africa Broadcast Equipment Market Volume (K Unit) Forecast, by Application 2019 & 2032
- Table 99: Global Broadcast Equipment Market Revenue Million Forecast, by Technology 2019 & 2032
- Table 100: Global Broadcast Equipment Market Volume K Unit Forecast, by Technology 2019 & 2032
- Table 101: Global Broadcast Equipment Market Revenue Million Forecast, by Product 2019 & 2032
- Table 102: Global Broadcast Equipment Market Volume K Unit Forecast, by Product 2019 & 2032
- Table 103: Global Broadcast Equipment Market Revenue Million Forecast, by Country 2019 & 2032
- Table 104: Global Broadcast Equipment Market Volume K Unit Forecast, by Country 2019 & 2032
- Table 105: Global Broadcast Equipment Market Revenue Million Forecast, by Technology 2019 & 2032
- Table 106: Global Broadcast Equipment Market Volume K Unit Forecast, by Technology 2019 & 2032
- Table 107: Global Broadcast Equipment Market Revenue Million Forecast, by Product 2019 & 2032
- Table 108: Global Broadcast Equipment Market Volume K Unit Forecast, by Product 2019 & 2032
- Table 109: Global Broadcast Equipment Market Revenue Million Forecast, by Country 2019 & 2032
- Table 110: Global Broadcast Equipment Market Volume K Unit Forecast, by Country 2019 & 2032
- Table 111: Global Broadcast Equipment Market Revenue Million Forecast, by Technology 2019 & 2032
- Table 112: Global Broadcast Equipment Market Volume K Unit Forecast, by Technology 2019 & 2032
- Table 113: Global Broadcast Equipment Market Revenue Million Forecast, by Product 2019 & 2032
- Table 114: Global Broadcast Equipment Market Volume K Unit Forecast, by Product 2019 & 2032
- Table 115: Global Broadcast Equipment Market Revenue Million Forecast, by Country 2019 & 2032
- Table 116: Global Broadcast Equipment Market Volume K Unit Forecast, by Country 2019 & 2032
- Table 117: Global Broadcast Equipment Market Revenue Million Forecast, by Technology 2019 & 2032
- Table 118: Global Broadcast Equipment Market Volume K Unit Forecast, by Technology 2019 & 2032
- Table 119: Global Broadcast Equipment Market Revenue Million Forecast, by Product 2019 & 2032
- Table 120: Global Broadcast Equipment Market Volume K Unit Forecast, by Product 2019 & 2032
- Table 121: Global Broadcast Equipment Market Revenue Million Forecast, by Country 2019 & 2032
- Table 122: Global Broadcast Equipment Market Volume K Unit Forecast, by Country 2019 & 2032
- Table 123: Global Broadcast Equipment Market Revenue Million Forecast, by Technology 2019 & 2032
- Table 124: Global Broadcast Equipment Market Volume K Unit Forecast, by Technology 2019 & 2032
- Table 125: Global Broadcast Equipment Market Revenue Million Forecast, by Product 2019 & 2032
- Table 126: Global Broadcast Equipment Market Volume K Unit Forecast, by Product 2019 & 2032
- Table 127: Global Broadcast Equipment Market Revenue Million Forecast, by Country 2019 & 2032
- Table 128: Global Broadcast Equipment Market Volume K Unit Forecast, by Country 2019 & 2032
Frequently Asked Questions
1. What is the projected Compound Annual Growth Rate (CAGR) of the Broadcast Equipment Market?
The projected CAGR is approximately 6.70%.
2. Which companies are prominent players in the Broadcast Equipment Market?
Key companies in the market include Clyde Broadcast, Telefonaktiebolaget LM Ericsson, Grass Valley, Harmonic Inc, Cisco Systems Inc, Sencore Inc, Evs Broadcast Equipment SA, ETL Systems Ltd, AVL Technologies Inc, Eletec Broadcast Telecom Sarl.
3. What are the main segments of the Broadcast Equipment Market?
The market segments include Technology, Product.
4. Can you provide details about the market size?
The market size is estimated to be USD 5.23 Million as of 2022.
5. What are some drivers contributing to market growth?
Growing Demand for Encoders due to Support for Multiple Formats; Growing D2C Offerings through OTT Services; Increased Adoption of SAAS Solutions.
6. What are the notable trends driving market growth?
Encoders are Expected to Witness Significant Growth.
7. Are there any restraints impacting market growth?
High Capital Required for Deployment.
8. Can you provide examples of recent developments in the market?
May 2024: Hollyland launched its newest series of video transmitters, the Pyro series. The first product of the line is the Pyro H. The Pyro H offers enhanced monitoring stability and collaboration on set. It is significant for diverse applications, such as film production, commercial filming, live event filming, and ENG/EFP applications. With self-developed 2.4 GHz and 5 GHz dual-band technology, the Pyro H features a stable transmission range of up to 1,300 ft (400 m). It achieves a minimal transmission latency of 60 ms thanks to upgraded chips and optimized video encoding/decoding algorithms.
9. What pricing options are available for accessing the report?
Pricing options include single-user, multi-user, and enterprise licenses priced at USD 4750, USD 5250, and USD 8750 respectively.
10. Is the market size provided in terms of value or volume?
The market size is provided in terms of value, measured in Million and volume, measured in K Unit.
11. Are there any specific market keywords associated with the report?
Yes, the market keyword associated with the report is "Broadcast Equipment Market," which aids in identifying and referencing the specific market segment covered.
12. How do I determine which pricing option suits my needs best?
The pricing options vary based on user requirements and access needs. Individual users may opt for single-user licenses, while businesses requiring broader access may choose multi-user or enterprise licenses for cost-effective access to the report.
13. Are there any additional resources or data provided in the Broadcast Equipment Market report?
While the report offers comprehensive insights, it's advisable to review the specific contents or supplementary materials provided to ascertain if additional resources or data are available.
14. How can I stay updated on further developments or reports in the Broadcast Equipment Market?
To stay informed about further developments, trends, and reports in the Broadcast Equipment Market, consider subscribing to industry newsletters, following relevant companies and organizations, or regularly checking reputable industry news sources and publications.
Methodology
Step 1 - Identification of Relevant Samples Size from Population Database


Step 2 - Approaches for Defining Global Market Size (Value, Volume* & Price*)

Note*: In applicable scenarios
Step 3 - Data Sources
Primary Research
- Web Analytics
- Survey Reports
- Research Institute
- Latest Research Reports
- Opinion Leaders
Secondary Research
- Annual Reports
- White Paper
- Latest Press Release
- Industry Association
- Paid Database
- Investor Presentations

Step 4 - Data Triangulation
Involves using different sources of information in order to increase the validity of a study
These sources are likely to be stakeholders in a program - participants, other researchers, program staff, other community members, and so on.
Then we put all data in single framework & apply various statistical tools to find out the dynamic on the market.
During the analysis stage, feedback from the stakeholder groups would be compared to determine areas of agreement as well as areas of divergence


