
Key Insights
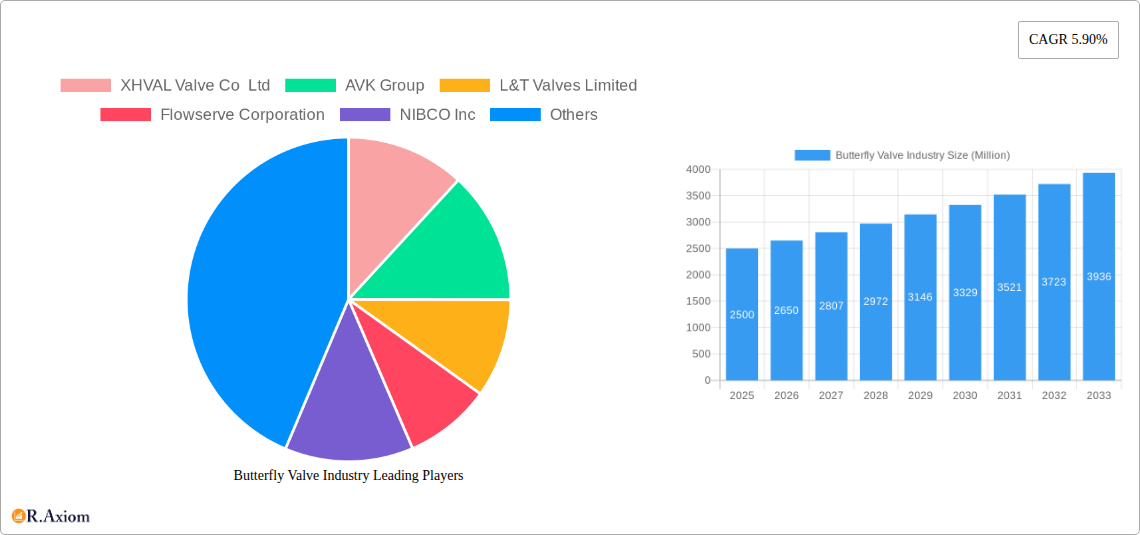
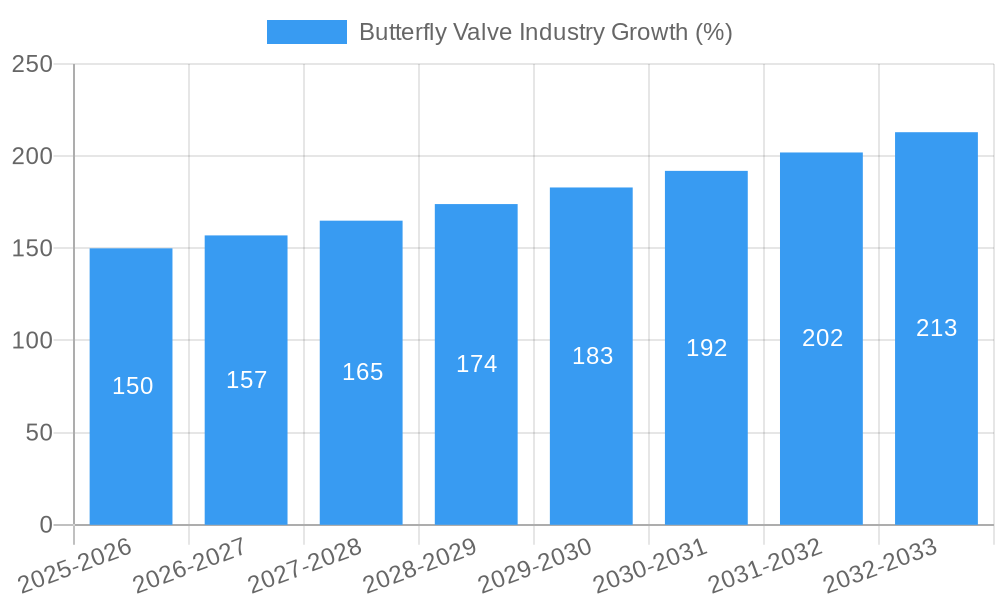
The global butterfly valve market, valued at approximately $XX million in 2025, is projected to experience robust growth, driven by a Compound Annual Growth Rate (CAGR) of 5.90% from 2025 to 2033. This expansion is fueled by several key factors. Increased investments in infrastructure development, particularly in water and wastewater treatment, oil and gas extraction, and energy production, are significantly boosting demand. Furthermore, the rising adoption of automation and smart technologies across various industries is creating opportunities for advanced butterfly valves with improved control and monitoring capabilities. The growing preference for energy-efficient and cost-effective solutions is also driving market growth, with butterfly valves offering a compelling alternative to other valve types in many applications. Specific segments like high-performance butterfly valves and those used in control functions are experiencing particularly strong growth due to their enhanced performance characteristics and suitability for demanding applications.
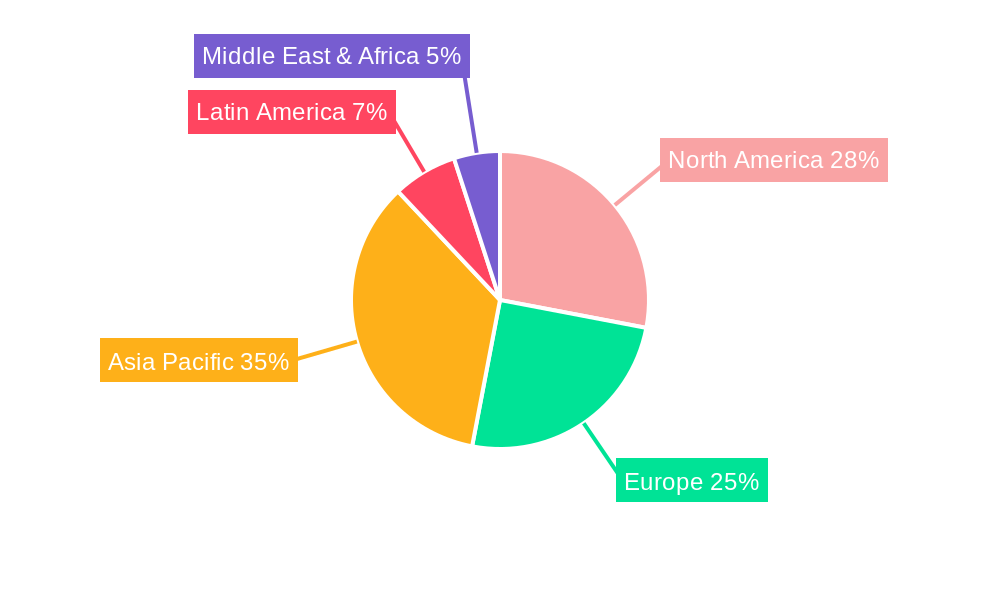
Geographically, the Asia-Pacific region is anticipated to dominate the market, driven by rapid industrialization and infrastructure development in countries like China and India. North America and Europe are also expected to contribute significantly, albeit at a potentially slower growth rate compared to the Asia-Pacific region. However, stringent environmental regulations in certain regions are presenting challenges. The increasing focus on sustainable practices within industries is creating demand for eco-friendly materials and designs, requiring manufacturers to adapt their product offerings. Competition within the butterfly valve market is intense, with several established players and emerging companies vying for market share. The market is characterized by ongoing innovation in materials, designs, and functionalities, leading to a dynamic and evolving landscape. Successful companies will likely be those that can effectively respond to the changing needs of their customers and demonstrate a commitment to sustainability.
This comprehensive report provides a detailed analysis of the global butterfly valve industry, covering market size, segmentation, key players, and future trends. The study period spans from 2019 to 2033, with 2025 as the base and estimated year. The forecast period is 2025-2033, and the historical period is 2019-2024. This report is invaluable for industry stakeholders, investors, and anyone seeking a deep understanding of this dynamic market.
Butterfly Valve Industry Market Concentration & Innovation
The global butterfly valve market exhibits a moderately consolidated structure, with several large players commanding significant market share. XHVAL Valve Co Ltd, AVK Group, L&T Valves Limited, Flowserve Corporation, and NIBCO Inc. are among the leading companies, collectively accounting for an estimated xx% of the global market in 2025. Market share fluctuates based on technological advancements, M&A activities, and regional demand shifts. The industry is characterized by continuous innovation, driven by the need for enhanced performance, efficiency, and sustainability.
- Innovation Drivers: Demand for high-performance materials, advanced automation technologies, and improved sealing mechanisms are key drivers.
- Regulatory Frameworks: Stringent environmental regulations are prompting the development of eco-friendly valve designs.
- Product Substitutes: While butterfly valves dominate many applications, competition exists from other valve types, such as ball valves and gate valves, particularly in specific niche segments.
- End-User Trends: Increasing demand from water & wastewater treatment, oil & gas, and chemical processing sectors are significantly impacting growth.
- M&A Activities: The industry has witnessed several mergers and acquisitions in recent years, valued at approximately $xx Million, primarily aimed at expanding product portfolios and market reach. These deals often involve smaller, specialized valve manufacturers being acquired by larger conglomerates.
Butterfly Valve Industry Industry Trends & Insights
The global butterfly valve market is experiencing robust growth, with a projected CAGR of xx% during the forecast period (2025-2033). This growth is fueled by several factors:
- Infrastructure Development: Large-scale infrastructure projects globally, especially in emerging economies, drive significant demand.
- Industrial Automation: The increasing adoption of automation technologies in various industries is boosting demand for advanced butterfly valves with integrated control systems.
- Rising Energy Demand: The expanding energy sector, including oil & gas exploration and renewable energy projects, requires robust and reliable flow control solutions.
- Technological Advancements: The development of new materials, such as high-performance polymers and advanced alloys, leads to improved valve durability and efficiency.
- Environmental Concerns: Growing emphasis on environmental protection is driving demand for eco-friendly valves with reduced emissions and improved energy efficiency.
- Market Penetration: Butterfly valves are increasingly preferred for their compact design, ease of maintenance, and cost-effectiveness, leading to higher market penetration across diverse sectors.
Dominant Markets & Segments in Butterfly Valve Industry
By Type: The high-performance butterfly valve segment dominates the market due to its superior performance characteristics and application in demanding industrial settings. Lined butterfly valves maintain a significant share, driven by the chemical processing and wastewater treatment industries' needs.
- High Performance Butterfly Valves: Key Drivers: Demand from high-pressure applications, rigorous operational conditions.
- Lined Butterfly Valves: Key Drivers: Corrosion resistance requirements in chemical and water treatment sectors.
By Design: Concentric butterfly valves are more widely used due to their simplicity and cost-effectiveness. Eccentric butterfly valves, however, are gaining traction due to their improved sealing capabilities and reduced wear.
- Concentric Butterfly Valves: Key Drivers: Lower cost, ease of manufacturing, suitability for simpler applications.
- Eccentric Butterfly Valves: Key Drivers: Superior sealing, reduced wear and tear, extended lifespan.
By Function: On/off valves account for the largest segment, driven by their widespread use in various industries. Control valves, while representing a smaller share, are crucial for precise fluid flow management.
- On/Off Valves: Key Drivers: Simplicity, cost-effectiveness, general-purpose applications.
- Control Valves: Key Drivers: Precise flow control, automation integration, specialized industrial requirements.
By End-User Industry: The water & wastewater segment is the largest, driven by the continuous need for efficient water management infrastructure. The oil & gas industry is also a major consumer due to its reliance on robust flow control solutions.
- Water & Wastewater: Key Drivers: Aging infrastructure upgrades, growing urban populations, stringent water quality regulations.
- Oil & Gas: Key Drivers: Upstream and downstream operations, pipeline management, and processing facilities.
- Energy & Power: Key Drivers: Power generation plants, steam systems, and associated infrastructure.
- Pharmaceutical: Key Drivers: Sterile environments, stringent safety and hygiene standards.
- Chemical: Key Drivers: Process control, chemical handling, corrosion resistance.
By Geography: Asia Pacific is the fastest-growing region due to rapid industrialization and infrastructure development. North America and Europe maintain significant market shares due to their established industrial bases.
- Asia Pacific: Key Drivers: Rapid economic growth, infrastructure investments, industrial expansion.
- North America: Key Drivers: Existing infrastructure modernization, technological advancements, strict environmental regulations.
- Europe: Key Drivers: Stringent environmental regulations, focus on energy efficiency, and technological innovation.
- Latin America: Key Drivers: Infrastructure development, industrial projects, and growing economies.
- Middle East & Africa: Key Drivers: Oil & gas industry investments and infrastructure projects.
Butterfly Valve Industry Product Developments
Recent product innovations focus on enhancing performance, durability, and sustainability. The introduction of lightweight, high-performance materials and smart valve technologies with remote monitoring capabilities is transforming the industry. These innovations are improving operational efficiency, minimizing maintenance costs, and extending the lifespan of butterfly valves, ultimately enhancing their market fit across diverse applications.
Report Scope & Segmentation Analysis
This report provides a comprehensive analysis of the butterfly valve market, segmented by type (High-Performance, Lined), design (Concentric, Eccentric), function (On/Off, Control), end-user industry (Water & Wastewater, Oil & Gas, Energy & Power, Pharmaceutical, Chemical, Others), and geography (North America, Asia Pacific, Europe, Latin America, Middle East & Africa). Each segment's growth projections, market size estimates, and competitive dynamics are meticulously analyzed, providing a granular understanding of market opportunities and challenges.
Key Drivers of Butterfly Valve Industry Growth
The butterfly valve industry's growth is primarily driven by the increasing demand for efficient flow control solutions across various sectors, technological advancements leading to improved valve designs and materials, and stringent government regulations pushing for environmental sustainability. Expansion of industrial sectors, particularly in emerging economies, is further fueling market growth.
Challenges in the Butterfly Valve Industry Sector
The butterfly valve industry faces challenges such as fluctuating raw material prices impacting production costs, intense competition from other valve types, and the need for continuous innovation to meet evolving industry standards and customer demands. Supply chain disruptions and regulatory compliance complexities further add to the challenges.
Emerging Opportunities in Butterfly Valve Industry
Emerging opportunities lie in the development of smart valves with integrated sensors and remote monitoring capabilities, the expansion into new and growing markets (e.g., renewable energy), and increasing demand for customized solutions to meet specific application requirements. The growing adoption of Industry 4.0 technologies also presents lucrative opportunities for industry players.
Leading Players in the Butterfly Valve Industry Market
- XHVAL Valve Co Ltd
- AVK Group
- L&T Valves Limited
- Flowserve Corporation
- NIBCO Inc
- Alfa Laval Corporate AB
- Emerson Electric Co
- ASE Engineered Solutions
- Huamei Machinery Limited
- Crane Co
- Curtiss-Wright Corporation
- Flexachem
- Schlumberger Limited
- Valmet Corporation
Key Developments in Butterfly Valve Industry Industry
- June 2021: Neles launched a new versatile butterfly valve product range offering superior process efficiency and a minimized environmental footprint.
- April 2021: GF Piping Systems launched its lightweight Butterfly Valve 565, offering a competitive advantage in water treatment applications.
Strategic Outlook for Butterfly Valve Industry Market
The butterfly valve industry is poised for continued growth driven by global infrastructure development, industrial expansion, and technological innovations. Strategic investments in R&D, expansion into emerging markets, and the adoption of sustainable manufacturing practices will be crucial for long-term success in this competitive market.
Butterfly Valve Industry Segmentation
-
1. Type
- 1.1. High Performance Butterfly Valve
- 1.2. Lined Butterfly Valve
-
2. Design
- 2.1. Concentric Butterfly Valve
- 2.2. Eccentric Butterfly Valve
-
3. Function
- 3.1. On/Off Valve
- 3.2. Control Valve
-
4. End-User Industry
- 4.1. Water & Wastewater
- 4.2. Oil & Gas
- 4.3. Energy & Power
- 4.4. Pharmaceutical
- 4.5. Chemical
- 4.6. Others
-
5. Geograhy
- 5.1. North America
- 5.2. Asia Pacific
- 5.3. Europe
- 5.4. Latin America
- 5.5. Middle East & Africa
Butterfly Valve Industry Segmentation By Geography
-
1. North America
- 1.1. United States
- 1.2. Canada
- 1.3. Mexico
-
2. South America
- 2.1. Brazil
- 2.2. Argentina
- 2.3. Rest of South America
-
3. Europe
- 3.1. United Kingdom
- 3.2. Germany
- 3.3. France
- 3.4. Italy
- 3.5. Spain
- 3.6. Russia
- 3.7. Benelux
- 3.8. Nordics
- 3.9. Rest of Europe
-
4. Middle East & Africa
- 4.1. Turkey
- 4.2. Israel
- 4.3. GCC
- 4.4. North Africa
- 4.5. South Africa
- 4.6. Rest of Middle East & Africa
-
5. Asia Pacific
- 5.1. China
- 5.2. India
- 5.3. Japan
- 5.4. South Korea
- 5.5. ASEAN
- 5.6. Oceania
- 5.7. Rest of Asia Pacific
Butterfly Valve Industry REPORT HIGHLIGHTS
| Aspects | Details |
|---|---|
| Study Period | 2019-2033 |
| Base Year | 2024 |
| Estimated Year | 2025 |
| Forecast Period | 2025-2033 |
| Historical Period | 2019-2024 |
| Growth Rate | CAGR of 5.90% from 2019-2033 |
| Segmentation |
|
Table of Contents
- 1. Introduction
- 1.1. Research Scope
- 1.2. Market Segmentation
- 1.3. Research Methodology
- 1.4. Definitions and Assumptions
- 2. Executive Summary
- 2.1. Introduction
- 3. Market Dynamics
- 3.1. Introduction
- 3.2. Market Drivers
- 3.2.1 Increasing Investment in Oil & Gas Refineries and Pipelines; Increasing Demand for Vales With Tight Shutoff
- 3.2.2 High-Pressure Handling Capacity
- 3.2.3 and Low Installation Cost
- 3.3. Market Restrains
- 3.3.1. Low resistance to cavitation & choke and limited throttling in case of low pressure
- 3.4. Market Trends
- 3.4.1. Oil & Gas Sector to Hold Significant Market Share
- 4. Market Factor Analysis
- 4.1. Porters Five Forces
- 4.2. Supply/Value Chain
- 4.3. PESTEL analysis
- 4.4. Market Entropy
- 4.5. Patent/Trademark Analysis
- 5. Global Butterfly Valve Industry Analysis, Insights and Forecast, 2019-2031
- 5.1. Market Analysis, Insights and Forecast - by Type
- 5.1.1. High Performance Butterfly Valve
- 5.1.2. Lined Butterfly Valve
- 5.2. Market Analysis, Insights and Forecast - by Design
- 5.2.1. Concentric Butterfly Valve
- 5.2.2. Eccentric Butterfly Valve
- 5.3. Market Analysis, Insights and Forecast - by Function
- 5.3.1. On/Off Valve
- 5.3.2. Control Valve
- 5.4. Market Analysis, Insights and Forecast - by End-User Industry
- 5.4.1. Water & Wastewater
- 5.4.2. Oil & Gas
- 5.4.3. Energy & Power
- 5.4.4. Pharmaceutical
- 5.4.5. Chemical
- 5.4.6. Others
- 5.5. Market Analysis, Insights and Forecast - by Geograhy
- 5.5.1. North America
- 5.5.2. Asia Pacific
- 5.5.3. Europe
- 5.5.4. Latin America
- 5.5.5. Middle East & Africa
- 5.6. Market Analysis, Insights and Forecast - by Region
- 5.6.1. North America
- 5.6.2. South America
- 5.6.3. Europe
- 5.6.4. Middle East & Africa
- 5.6.5. Asia Pacific
- 5.1. Market Analysis, Insights and Forecast - by Type
- 6. North America Butterfly Valve Industry Analysis, Insights and Forecast, 2019-2031
- 6.1. Market Analysis, Insights and Forecast - by Type
- 6.1.1. High Performance Butterfly Valve
- 6.1.2. Lined Butterfly Valve
- 6.2. Market Analysis, Insights and Forecast - by Design
- 6.2.1. Concentric Butterfly Valve
- 6.2.2. Eccentric Butterfly Valve
- 6.3. Market Analysis, Insights and Forecast - by Function
- 6.3.1. On/Off Valve
- 6.3.2. Control Valve
- 6.4. Market Analysis, Insights and Forecast - by End-User Industry
- 6.4.1. Water & Wastewater
- 6.4.2. Oil & Gas
- 6.4.3. Energy & Power
- 6.4.4. Pharmaceutical
- 6.4.5. Chemical
- 6.4.6. Others
- 6.5. Market Analysis, Insights and Forecast - by Geograhy
- 6.5.1. North America
- 6.5.2. Asia Pacific
- 6.5.3. Europe
- 6.5.4. Latin America
- 6.5.5. Middle East & Africa
- 6.1. Market Analysis, Insights and Forecast - by Type
- 7. South America Butterfly Valve Industry Analysis, Insights and Forecast, 2019-2031
- 7.1. Market Analysis, Insights and Forecast - by Type
- 7.1.1. High Performance Butterfly Valve
- 7.1.2. Lined Butterfly Valve
- 7.2. Market Analysis, Insights and Forecast - by Design
- 7.2.1. Concentric Butterfly Valve
- 7.2.2. Eccentric Butterfly Valve
- 7.3. Market Analysis, Insights and Forecast - by Function
- 7.3.1. On/Off Valve
- 7.3.2. Control Valve
- 7.4. Market Analysis, Insights and Forecast - by End-User Industry
- 7.4.1. Water & Wastewater
- 7.4.2. Oil & Gas
- 7.4.3. Energy & Power
- 7.4.4. Pharmaceutical
- 7.4.5. Chemical
- 7.4.6. Others
- 7.5. Market Analysis, Insights and Forecast - by Geograhy
- 7.5.1. North America
- 7.5.2. Asia Pacific
- 7.5.3. Europe
- 7.5.4. Latin America
- 7.5.5. Middle East & Africa
- 7.1. Market Analysis, Insights and Forecast - by Type
- 8. Europe Butterfly Valve Industry Analysis, Insights and Forecast, 2019-2031
- 8.1. Market Analysis, Insights and Forecast - by Type
- 8.1.1. High Performance Butterfly Valve
- 8.1.2. Lined Butterfly Valve
- 8.2. Market Analysis, Insights and Forecast - by Design
- 8.2.1. Concentric Butterfly Valve
- 8.2.2. Eccentric Butterfly Valve
- 8.3. Market Analysis, Insights and Forecast - by Function
- 8.3.1. On/Off Valve
- 8.3.2. Control Valve
- 8.4. Market Analysis, Insights and Forecast - by End-User Industry
- 8.4.1. Water & Wastewater
- 8.4.2. Oil & Gas
- 8.4.3. Energy & Power
- 8.4.4. Pharmaceutical
- 8.4.5. Chemical
- 8.4.6. Others
- 8.5. Market Analysis, Insights and Forecast - by Geograhy
- 8.5.1. North America
- 8.5.2. Asia Pacific
- 8.5.3. Europe
- 8.5.4. Latin America
- 8.5.5. Middle East & Africa
- 8.1. Market Analysis, Insights and Forecast - by Type
- 9. Middle East & Africa Butterfly Valve Industry Analysis, Insights and Forecast, 2019-2031
- 9.1. Market Analysis, Insights and Forecast - by Type
- 9.1.1. High Performance Butterfly Valve
- 9.1.2. Lined Butterfly Valve
- 9.2. Market Analysis, Insights and Forecast - by Design
- 9.2.1. Concentric Butterfly Valve
- 9.2.2. Eccentric Butterfly Valve
- 9.3. Market Analysis, Insights and Forecast - by Function
- 9.3.1. On/Off Valve
- 9.3.2. Control Valve
- 9.4. Market Analysis, Insights and Forecast - by End-User Industry
- 9.4.1. Water & Wastewater
- 9.4.2. Oil & Gas
- 9.4.3. Energy & Power
- 9.4.4. Pharmaceutical
- 9.4.5. Chemical
- 9.4.6. Others
- 9.5. Market Analysis, Insights and Forecast - by Geograhy
- 9.5.1. North America
- 9.5.2. Asia Pacific
- 9.5.3. Europe
- 9.5.4. Latin America
- 9.5.5. Middle East & Africa
- 9.1. Market Analysis, Insights and Forecast - by Type
- 10. Asia Pacific Butterfly Valve Industry Analysis, Insights and Forecast, 2019-2031
- 10.1. Market Analysis, Insights and Forecast - by Type
- 10.1.1. High Performance Butterfly Valve
- 10.1.2. Lined Butterfly Valve
- 10.2. Market Analysis, Insights and Forecast - by Design
- 10.2.1. Concentric Butterfly Valve
- 10.2.2. Eccentric Butterfly Valve
- 10.3. Market Analysis, Insights and Forecast - by Function
- 10.3.1. On/Off Valve
- 10.3.2. Control Valve
- 10.4. Market Analysis, Insights and Forecast - by End-User Industry
- 10.4.1. Water & Wastewater
- 10.4.2. Oil & Gas
- 10.4.3. Energy & Power
- 10.4.4. Pharmaceutical
- 10.4.5. Chemical
- 10.4.6. Others
- 10.5. Market Analysis, Insights and Forecast - by Geograhy
- 10.5.1. North America
- 10.5.2. Asia Pacific
- 10.5.3. Europe
- 10.5.4. Latin America
- 10.5.5. Middle East & Africa
- 10.1. Market Analysis, Insights and Forecast - by Type
- 11. North America Butterfly Valve Industry Analysis, Insights and Forecast, 2019-2031
- 11.1. Market Analysis, Insights and Forecast - By Country/Sub-region
- 11.1.1.
- 12. Asia Pacific Butterfly Valve Industry Analysis, Insights and Forecast, 2019-2031
- 12.1. Market Analysis, Insights and Forecast - By Country/Sub-region
- 12.1.1.
- 13. Europe Butterfly Valve Industry Analysis, Insights and Forecast, 2019-2031
- 13.1. Market Analysis, Insights and Forecast - By Country/Sub-region
- 13.1.1.
- 14. Latin America Butterfly Valve Industry Analysis, Insights and Forecast, 2019-2031
- 14.1. Market Analysis, Insights and Forecast - By Country/Sub-region
- 14.1.1.
- 15. Middle East Butterfly Valve Industry Analysis, Insights and Forecast, 2019-2031
- 15.1. Market Analysis, Insights and Forecast - By Country/Sub-region
- 15.1.1.
- 16. Competitive Analysis
- 16.1. Global Market Share Analysis 2024
- 16.2. Company Profiles
- 16.2.1 XHVAL Valve Co Ltd
- 16.2.1.1. Overview
- 16.2.1.2. Products
- 16.2.1.3. SWOT Analysis
- 16.2.1.4. Recent Developments
- 16.2.1.5. Financials (Based on Availability)
- 16.2.2 AVK Group
- 16.2.2.1. Overview
- 16.2.2.2. Products
- 16.2.2.3. SWOT Analysis
- 16.2.2.4. Recent Developments
- 16.2.2.5. Financials (Based on Availability)
- 16.2.3 L&T Valves Limited
- 16.2.3.1. Overview
- 16.2.3.2. Products
- 16.2.3.3. SWOT Analysis
- 16.2.3.4. Recent Developments
- 16.2.3.5. Financials (Based on Availability)
- 16.2.4 Flowserve Corporation
- 16.2.4.1. Overview
- 16.2.4.2. Products
- 16.2.4.3. SWOT Analysis
- 16.2.4.4. Recent Developments
- 16.2.4.5. Financials (Based on Availability)
- 16.2.5 NIBCO Inc
- 16.2.5.1. Overview
- 16.2.5.2. Products
- 16.2.5.3. SWOT Analysis
- 16.2.5.4. Recent Developments
- 16.2.5.5. Financials (Based on Availability)
- 16.2.6 Alfa Laval Corporate AB
- 16.2.6.1. Overview
- 16.2.6.2. Products
- 16.2.6.3. SWOT Analysis
- 16.2.6.4. Recent Developments
- 16.2.6.5. Financials (Based on Availability)
- 16.2.7 Emerson Electric Co
- 16.2.7.1. Overview
- 16.2.7.2. Products
- 16.2.7.3. SWOT Analysis
- 16.2.7.4. Recent Developments
- 16.2.7.5. Financials (Based on Availability)
- 16.2.8 ASE Engineered Solutions
- 16.2.8.1. Overview
- 16.2.8.2. Products
- 16.2.8.3. SWOT Analysis
- 16.2.8.4. Recent Developments
- 16.2.8.5. Financials (Based on Availability)
- 16.2.9 Huamei Machinery Limited
- 16.2.9.1. Overview
- 16.2.9.2. Products
- 16.2.9.3. SWOT Analysis
- 16.2.9.4. Recent Developments
- 16.2.9.5. Financials (Based on Availability)
- 16.2.10 Crane Co
- 16.2.10.1. Overview
- 16.2.10.2. Products
- 16.2.10.3. SWOT Analysis
- 16.2.10.4. Recent Developments
- 16.2.10.5. Financials (Based on Availability)
- 16.2.11 Curtiss-Wright Corporation
- 16.2.11.1. Overview
- 16.2.11.2. Products
- 16.2.11.3. SWOT Analysis
- 16.2.11.4. Recent Developments
- 16.2.11.5. Financials (Based on Availability)
- 16.2.12 Flexachem
- 16.2.12.1. Overview
- 16.2.12.2. Products
- 16.2.12.3. SWOT Analysis
- 16.2.12.4. Recent Developments
- 16.2.12.5. Financials (Based on Availability)
- 16.2.13 Schlumberger Limited
- 16.2.13.1. Overview
- 16.2.13.2. Products
- 16.2.13.3. SWOT Analysis
- 16.2.13.4. Recent Developments
- 16.2.13.5. Financials (Based on Availability)
- 16.2.14 Valmet Corporation
- 16.2.14.1. Overview
- 16.2.14.2. Products
- 16.2.14.3. SWOT Analysis
- 16.2.14.4. Recent Developments
- 16.2.14.5. Financials (Based on Availability)
- 16.2.1 XHVAL Valve Co Ltd
List of Figures
- Figure 1: Global Butterfly Valve Industry Revenue Breakdown (Million, %) by Region 2024 & 2032
- Figure 2: North America Butterfly Valve Industry Revenue (Million), by Country 2024 & 2032
- Figure 3: North America Butterfly Valve Industry Revenue Share (%), by Country 2024 & 2032
- Figure 4: Asia Pacific Butterfly Valve Industry Revenue (Million), by Country 2024 & 2032
- Figure 5: Asia Pacific Butterfly Valve Industry Revenue Share (%), by Country 2024 & 2032
- Figure 6: Europe Butterfly Valve Industry Revenue (Million), by Country 2024 & 2032
- Figure 7: Europe Butterfly Valve Industry Revenue Share (%), by Country 2024 & 2032
- Figure 8: Latin America Butterfly Valve Industry Revenue (Million), by Country 2024 & 2032
- Figure 9: Latin America Butterfly Valve Industry Revenue Share (%), by Country 2024 & 2032
- Figure 10: Middle East Butterfly Valve Industry Revenue (Million), by Country 2024 & 2032
- Figure 11: Middle East Butterfly Valve Industry Revenue Share (%), by Country 2024 & 2032
- Figure 12: North America Butterfly Valve Industry Revenue (Million), by Type 2024 & 2032
- Figure 13: North America Butterfly Valve Industry Revenue Share (%), by Type 2024 & 2032
- Figure 14: North America Butterfly Valve Industry Revenue (Million), by Design 2024 & 2032
- Figure 15: North America Butterfly Valve Industry Revenue Share (%), by Design 2024 & 2032
- Figure 16: North America Butterfly Valve Industry Revenue (Million), by Function 2024 & 2032
- Figure 17: North America Butterfly Valve Industry Revenue Share (%), by Function 2024 & 2032
- Figure 18: North America Butterfly Valve Industry Revenue (Million), by End-User Industry 2024 & 2032
- Figure 19: North America Butterfly Valve Industry Revenue Share (%), by End-User Industry 2024 & 2032
- Figure 20: North America Butterfly Valve Industry Revenue (Million), by Geograhy 2024 & 2032
- Figure 21: North America Butterfly Valve Industry Revenue Share (%), by Geograhy 2024 & 2032
- Figure 22: North America Butterfly Valve Industry Revenue (Million), by Country 2024 & 2032
- Figure 23: North America Butterfly Valve Industry Revenue Share (%), by Country 2024 & 2032
- Figure 24: South America Butterfly Valve Industry Revenue (Million), by Type 2024 & 2032
- Figure 25: South America Butterfly Valve Industry Revenue Share (%), by Type 2024 & 2032
- Figure 26: South America Butterfly Valve Industry Revenue (Million), by Design 2024 & 2032
- Figure 27: South America Butterfly Valve Industry Revenue Share (%), by Design 2024 & 2032
- Figure 28: South America Butterfly Valve Industry Revenue (Million), by Function 2024 & 2032
- Figure 29: South America Butterfly Valve Industry Revenue Share (%), by Function 2024 & 2032
- Figure 30: South America Butterfly Valve Industry Revenue (Million), by End-User Industry 2024 & 2032
- Figure 31: South America Butterfly Valve Industry Revenue Share (%), by End-User Industry 2024 & 2032
- Figure 32: South America Butterfly Valve Industry Revenue (Million), by Geograhy 2024 & 2032
- Figure 33: South America Butterfly Valve Industry Revenue Share (%), by Geograhy 2024 & 2032
- Figure 34: South America Butterfly Valve Industry Revenue (Million), by Country 2024 & 2032
- Figure 35: South America Butterfly Valve Industry Revenue Share (%), by Country 2024 & 2032
- Figure 36: Europe Butterfly Valve Industry Revenue (Million), by Type 2024 & 2032
- Figure 37: Europe Butterfly Valve Industry Revenue Share (%), by Type 2024 & 2032
- Figure 38: Europe Butterfly Valve Industry Revenue (Million), by Design 2024 & 2032
- Figure 39: Europe Butterfly Valve Industry Revenue Share (%), by Design 2024 & 2032
- Figure 40: Europe Butterfly Valve Industry Revenue (Million), by Function 2024 & 2032
- Figure 41: Europe Butterfly Valve Industry Revenue Share (%), by Function 2024 & 2032
- Figure 42: Europe Butterfly Valve Industry Revenue (Million), by End-User Industry 2024 & 2032
- Figure 43: Europe Butterfly Valve Industry Revenue Share (%), by End-User Industry 2024 & 2032
- Figure 44: Europe Butterfly Valve Industry Revenue (Million), by Geograhy 2024 & 2032
- Figure 45: Europe Butterfly Valve Industry Revenue Share (%), by Geograhy 2024 & 2032
- Figure 46: Europe Butterfly Valve Industry Revenue (Million), by Country 2024 & 2032
- Figure 47: Europe Butterfly Valve Industry Revenue Share (%), by Country 2024 & 2032
- Figure 48: Middle East & Africa Butterfly Valve Industry Revenue (Million), by Type 2024 & 2032
- Figure 49: Middle East & Africa Butterfly Valve Industry Revenue Share (%), by Type 2024 & 2032
- Figure 50: Middle East & Africa Butterfly Valve Industry Revenue (Million), by Design 2024 & 2032
- Figure 51: Middle East & Africa Butterfly Valve Industry Revenue Share (%), by Design 2024 & 2032
- Figure 52: Middle East & Africa Butterfly Valve Industry Revenue (Million), by Function 2024 & 2032
- Figure 53: Middle East & Africa Butterfly Valve Industry Revenue Share (%), by Function 2024 & 2032
- Figure 54: Middle East & Africa Butterfly Valve Industry Revenue (Million), by End-User Industry 2024 & 2032
- Figure 55: Middle East & Africa Butterfly Valve Industry Revenue Share (%), by End-User Industry 2024 & 2032
- Figure 56: Middle East & Africa Butterfly Valve Industry Revenue (Million), by Geograhy 2024 & 2032
- Figure 57: Middle East & Africa Butterfly Valve Industry Revenue Share (%), by Geograhy 2024 & 2032
- Figure 58: Middle East & Africa Butterfly Valve Industry Revenue (Million), by Country 2024 & 2032
- Figure 59: Middle East & Africa Butterfly Valve Industry Revenue Share (%), by Country 2024 & 2032
- Figure 60: Asia Pacific Butterfly Valve Industry Revenue (Million), by Type 2024 & 2032
- Figure 61: Asia Pacific Butterfly Valve Industry Revenue Share (%), by Type 2024 & 2032
- Figure 62: Asia Pacific Butterfly Valve Industry Revenue (Million), by Design 2024 & 2032
- Figure 63: Asia Pacific Butterfly Valve Industry Revenue Share (%), by Design 2024 & 2032
- Figure 64: Asia Pacific Butterfly Valve Industry Revenue (Million), by Function 2024 & 2032
- Figure 65: Asia Pacific Butterfly Valve Industry Revenue Share (%), by Function 2024 & 2032
- Figure 66: Asia Pacific Butterfly Valve Industry Revenue (Million), by End-User Industry 2024 & 2032
- Figure 67: Asia Pacific Butterfly Valve Industry Revenue Share (%), by End-User Industry 2024 & 2032
- Figure 68: Asia Pacific Butterfly Valve Industry Revenue (Million), by Geograhy 2024 & 2032
- Figure 69: Asia Pacific Butterfly Valve Industry Revenue Share (%), by Geograhy 2024 & 2032
- Figure 70: Asia Pacific Butterfly Valve Industry Revenue (Million), by Country 2024 & 2032
- Figure 71: Asia Pacific Butterfly Valve Industry Revenue Share (%), by Country 2024 & 2032
List of Tables
- Table 1: Global Butterfly Valve Industry Revenue Million Forecast, by Region 2019 & 2032
- Table 2: Global Butterfly Valve Industry Revenue Million Forecast, by Type 2019 & 2032
- Table 3: Global Butterfly Valve Industry Revenue Million Forecast, by Design 2019 & 2032
- Table 4: Global Butterfly Valve Industry Revenue Million Forecast, by Function 2019 & 2032
- Table 5: Global Butterfly Valve Industry Revenue Million Forecast, by End-User Industry 2019 & 2032
- Table 6: Global Butterfly Valve Industry Revenue Million Forecast, by Geograhy 2019 & 2032
- Table 7: Global Butterfly Valve Industry Revenue Million Forecast, by Region 2019 & 2032
- Table 8: Global Butterfly Valve Industry Revenue Million Forecast, by Country 2019 & 2032
- Table 9: Butterfly Valve Industry Revenue (Million) Forecast, by Application 2019 & 2032
- Table 10: Global Butterfly Valve Industry Revenue Million Forecast, by Country 2019 & 2032
- Table 11: Butterfly Valve Industry Revenue (Million) Forecast, by Application 2019 & 2032
- Table 12: Global Butterfly Valve Industry Revenue Million Forecast, by Country 2019 & 2032
- Table 13: Butterfly Valve Industry Revenue (Million) Forecast, by Application 2019 & 2032
- Table 14: Global Butterfly Valve Industry Revenue Million Forecast, by Country 2019 & 2032
- Table 15: Butterfly Valve Industry Revenue (Million) Forecast, by Application 2019 & 2032
- Table 16: Global Butterfly Valve Industry Revenue Million Forecast, by Country 2019 & 2032
- Table 17: Butterfly Valve Industry Revenue (Million) Forecast, by Application 2019 & 2032
- Table 18: Global Butterfly Valve Industry Revenue Million Forecast, by Type 2019 & 2032
- Table 19: Global Butterfly Valve Industry Revenue Million Forecast, by Design 2019 & 2032
- Table 20: Global Butterfly Valve Industry Revenue Million Forecast, by Function 2019 & 2032
- Table 21: Global Butterfly Valve Industry Revenue Million Forecast, by End-User Industry 2019 & 2032
- Table 22: Global Butterfly Valve Industry Revenue Million Forecast, by Geograhy 2019 & 2032
- Table 23: Global Butterfly Valve Industry Revenue Million Forecast, by Country 2019 & 2032
- Table 24: United States Butterfly Valve Industry Revenue (Million) Forecast, by Application 2019 & 2032
- Table 25: Canada Butterfly Valve Industry Revenue (Million) Forecast, by Application 2019 & 2032
- Table 26: Mexico Butterfly Valve Industry Revenue (Million) Forecast, by Application 2019 & 2032
- Table 27: Global Butterfly Valve Industry Revenue Million Forecast, by Type 2019 & 2032
- Table 28: Global Butterfly Valve Industry Revenue Million Forecast, by Design 2019 & 2032
- Table 29: Global Butterfly Valve Industry Revenue Million Forecast, by Function 2019 & 2032
- Table 30: Global Butterfly Valve Industry Revenue Million Forecast, by End-User Industry 2019 & 2032
- Table 31: Global Butterfly Valve Industry Revenue Million Forecast, by Geograhy 2019 & 2032
- Table 32: Global Butterfly Valve Industry Revenue Million Forecast, by Country 2019 & 2032
- Table 33: Brazil Butterfly Valve Industry Revenue (Million) Forecast, by Application 2019 & 2032
- Table 34: Argentina Butterfly Valve Industry Revenue (Million) Forecast, by Application 2019 & 2032
- Table 35: Rest of South America Butterfly Valve Industry Revenue (Million) Forecast, by Application 2019 & 2032
- Table 36: Global Butterfly Valve Industry Revenue Million Forecast, by Type 2019 & 2032
- Table 37: Global Butterfly Valve Industry Revenue Million Forecast, by Design 2019 & 2032
- Table 38: Global Butterfly Valve Industry Revenue Million Forecast, by Function 2019 & 2032
- Table 39: Global Butterfly Valve Industry Revenue Million Forecast, by End-User Industry 2019 & 2032
- Table 40: Global Butterfly Valve Industry Revenue Million Forecast, by Geograhy 2019 & 2032
- Table 41: Global Butterfly Valve Industry Revenue Million Forecast, by Country 2019 & 2032
- Table 42: United Kingdom Butterfly Valve Industry Revenue (Million) Forecast, by Application 2019 & 2032
- Table 43: Germany Butterfly Valve Industry Revenue (Million) Forecast, by Application 2019 & 2032
- Table 44: France Butterfly Valve Industry Revenue (Million) Forecast, by Application 2019 & 2032
- Table 45: Italy Butterfly Valve Industry Revenue (Million) Forecast, by Application 2019 & 2032
- Table 46: Spain Butterfly Valve Industry Revenue (Million) Forecast, by Application 2019 & 2032
- Table 47: Russia Butterfly Valve Industry Revenue (Million) Forecast, by Application 2019 & 2032
- Table 48: Benelux Butterfly Valve Industry Revenue (Million) Forecast, by Application 2019 & 2032
- Table 49: Nordics Butterfly Valve Industry Revenue (Million) Forecast, by Application 2019 & 2032
- Table 50: Rest of Europe Butterfly Valve Industry Revenue (Million) Forecast, by Application 2019 & 2032
- Table 51: Global Butterfly Valve Industry Revenue Million Forecast, by Type 2019 & 2032
- Table 52: Global Butterfly Valve Industry Revenue Million Forecast, by Design 2019 & 2032
- Table 53: Global Butterfly Valve Industry Revenue Million Forecast, by Function 2019 & 2032
- Table 54: Global Butterfly Valve Industry Revenue Million Forecast, by End-User Industry 2019 & 2032
- Table 55: Global Butterfly Valve Industry Revenue Million Forecast, by Geograhy 2019 & 2032
- Table 56: Global Butterfly Valve Industry Revenue Million Forecast, by Country 2019 & 2032
- Table 57: Turkey Butterfly Valve Industry Revenue (Million) Forecast, by Application 2019 & 2032
- Table 58: Israel Butterfly Valve Industry Revenue (Million) Forecast, by Application 2019 & 2032
- Table 59: GCC Butterfly Valve Industry Revenue (Million) Forecast, by Application 2019 & 2032
- Table 60: North Africa Butterfly Valve Industry Revenue (Million) Forecast, by Application 2019 & 2032
- Table 61: South Africa Butterfly Valve Industry Revenue (Million) Forecast, by Application 2019 & 2032
- Table 62: Rest of Middle East & Africa Butterfly Valve Industry Revenue (Million) Forecast, by Application 2019 & 2032
- Table 63: Global Butterfly Valve Industry Revenue Million Forecast, by Type 2019 & 2032
- Table 64: Global Butterfly Valve Industry Revenue Million Forecast, by Design 2019 & 2032
- Table 65: Global Butterfly Valve Industry Revenue Million Forecast, by Function 2019 & 2032
- Table 66: Global Butterfly Valve Industry Revenue Million Forecast, by End-User Industry 2019 & 2032
- Table 67: Global Butterfly Valve Industry Revenue Million Forecast, by Geograhy 2019 & 2032
- Table 68: Global Butterfly Valve Industry Revenue Million Forecast, by Country 2019 & 2032
- Table 69: China Butterfly Valve Industry Revenue (Million) Forecast, by Application 2019 & 2032
- Table 70: India Butterfly Valve Industry Revenue (Million) Forecast, by Application 2019 & 2032
- Table 71: Japan Butterfly Valve Industry Revenue (Million) Forecast, by Application 2019 & 2032
- Table 72: South Korea Butterfly Valve Industry Revenue (Million) Forecast, by Application 2019 & 2032
- Table 73: ASEAN Butterfly Valve Industry Revenue (Million) Forecast, by Application 2019 & 2032
- Table 74: Oceania Butterfly Valve Industry Revenue (Million) Forecast, by Application 2019 & 2032
- Table 75: Rest of Asia Pacific Butterfly Valve Industry Revenue (Million) Forecast, by Application 2019 & 2032
Frequently Asked Questions
1. What is the projected Compound Annual Growth Rate (CAGR) of the Butterfly Valve Industry?
The projected CAGR is approximately 5.90%.
2. Which companies are prominent players in the Butterfly Valve Industry?
Key companies in the market include XHVAL Valve Co Ltd, AVK Group, L&T Valves Limited, Flowserve Corporation, NIBCO Inc, Alfa Laval Corporate AB, Emerson Electric Co, ASE Engineered Solutions, Huamei Machinery Limited, Crane Co, Curtiss-Wright Corporation, Flexachem, Schlumberger Limited, Valmet Corporation.
3. What are the main segments of the Butterfly Valve Industry?
The market segments include Type, Design, Function, End-User Industry, Geograhy.
4. Can you provide details about the market size?
The market size is estimated to be USD XX Million as of 2022.
5. What are some drivers contributing to market growth?
Increasing Investment in Oil & Gas Refineries and Pipelines; Increasing Demand for Vales With Tight Shutoff. High-Pressure Handling Capacity. and Low Installation Cost.
6. What are the notable trends driving market growth?
Oil & Gas Sector to Hold Significant Market Share.
7. Are there any restraints impacting market growth?
Low resistance to cavitation & choke and limited throttling in case of low pressure.
8. Can you provide examples of recent developments in the market?
June 2021 - Neles launched a new versatile butterfly valve product range that enables easy valve configuration for many applications in all process industries. According to the company, the product range offers superior process efficiency with a minimized environmental footprint. Furthermore, the versatile butterfly valve range enables many configurations from Neles' product families, including the Neles Neldisc metal seat and Jamesbury Wafer-Sphere soft seat.
9. What pricing options are available for accessing the report?
Pricing options include single-user, multi-user, and enterprise licenses priced at USD 4750, USD 5250, and USD 8750 respectively.
10. Is the market size provided in terms of value or volume?
The market size is provided in terms of value, measured in Million.
11. Are there any specific market keywords associated with the report?
Yes, the market keyword associated with the report is "Butterfly Valve Industry," which aids in identifying and referencing the specific market segment covered.
12. How do I determine which pricing option suits my needs best?
The pricing options vary based on user requirements and access needs. Individual users may opt for single-user licenses, while businesses requiring broader access may choose multi-user or enterprise licenses for cost-effective access to the report.
13. Are there any additional resources or data provided in the Butterfly Valve Industry report?
While the report offers comprehensive insights, it's advisable to review the specific contents or supplementary materials provided to ascertain if additional resources or data are available.
14. How can I stay updated on further developments or reports in the Butterfly Valve Industry?
To stay informed about further developments, trends, and reports in the Butterfly Valve Industry, consider subscribing to industry newsletters, following relevant companies and organizations, or regularly checking reputable industry news sources and publications.
Methodology
Step 1 - Identification of Relevant Samples Size from Population Database


Step 2 - Approaches for Defining Global Market Size (Value, Volume* & Price*)

Note*: In applicable scenarios
Step 3 - Data Sources
Primary Research
- Web Analytics
- Survey Reports
- Research Institute
- Latest Research Reports
- Opinion Leaders
Secondary Research
- Annual Reports
- White Paper
- Latest Press Release
- Industry Association
- Paid Database
- Investor Presentations

Step 4 - Data Triangulation
Involves using different sources of information in order to increase the validity of a study
These sources are likely to be stakeholders in a program - participants, other researchers, program staff, other community members, and so on.
Then we put all data in single framework & apply various statistical tools to find out the dynamic on the market.
During the analysis stage, feedback from the stakeholder groups would be compared to determine areas of agreement as well as areas of divergence


