
Key Insights
The global cancer sequencing market is experiencing robust growth, driven by the increasing prevalence of cancer, advancements in sequencing technologies, and a rising demand for personalized medicine. The market's Compound Annual Growth Rate (CAGR) of 12.50% from 2019 to 2024 suggests a significant expansion, and this momentum is expected to continue throughout the forecast period (2025-2033). Key technological advancements, such as next-generation sequencing (NGS), are significantly reducing costs and increasing throughput, making cancer sequencing more accessible for broader patient populations. This, coupled with the growing adoption of liquid biopsies, which offer less invasive methods for cancer detection and monitoring, is fueling market expansion. Furthermore, the increasing focus on early cancer detection and proactive screening programs contributes to higher demand for cancer sequencing services. The market is segmented by technology (PCR, microarrays, genome sequencing), product type (instruments, consumables, services), and geography, providing diverse opportunities for market players. The North American region, particularly the United States, currently holds a substantial market share due to well-established healthcare infrastructure, high adoption rates of advanced technologies, and increased research and development activities. However, the Asia-Pacific region is anticipated to witness significant growth in the coming years due to increasing healthcare expenditure and a growing awareness of cancer prevention and treatment.
Competitive intensity within the cancer sequencing market is high, with numerous major players, including Illumina, Thermo Fisher Scientific, Roche, and Qiagen, dominating the landscape. These companies are continuously innovating and investing in research and development to maintain their market positions. The increasing availability of affordable sequencing technologies and the development of comprehensive cancer panels tailored to specific cancer types are poised to further transform the cancer diagnostics and treatment landscape. Strategic alliances, mergers, acquisitions, and collaborations among key players are expected to become increasingly common as companies compete for market share and strive to offer comprehensive solutions. The restraints on market growth primarily include the high cost of sequencing, regulatory hurdles in certain regions, and data interpretation challenges. However, ongoing technological advancements, coupled with government initiatives promoting cancer research and personalized medicine, are expected to mitigate these limitations.
This in-depth report provides a comprehensive analysis of the Cancer Sequencing industry, covering market size, segmentation, leading players, technological advancements, and future growth prospects. The study period spans from 2019 to 2033, with 2025 as the base and estimated year. The report offers actionable insights for industry stakeholders, investors, and researchers seeking to understand and navigate this rapidly evolving market.
Cancer Sequencing Industry Market Concentration & Innovation
The cancer sequencing market exhibits a moderately concentrated landscape, dominated by a few key players like Illumina Inc, ThermoFisher Scientific Inc, and Roche, holding a combined xx% market share in 2025. However, the presence of numerous smaller companies, particularly in specialized niches, fosters innovation and competition. Significant M&A activity has shaped the market, with deal values totaling an estimated $xx Million in the period 2019-2024. These acquisitions have primarily focused on strengthening technology portfolios, expanding geographic reach, and accessing new patient populations.
- Market Concentration: High, with top 5 players holding xx% market share in 2025.
- Innovation Drivers: Advancements in sequencing technologies (e.g., long-read sequencing), increasing demand for personalized medicine, and falling sequencing costs.
- Regulatory Frameworks: Stringent regulatory approvals for diagnostic assays drive market growth.
- Product Substitutes: Limited direct substitutes, but alternative diagnostic methods exert indirect competitive pressure.
- End-User Trends: Growing preference for non-invasive liquid biopsies and increasing demand for comprehensive genomic profiling.
- M&A Activities: Significant consolidation through acquisitions, with a focus on technology integration and market expansion. Average deal value: $xx Million.
Cancer Sequencing Industry Industry Trends & Insights
The global cancer sequencing market is experiencing robust growth, driven by the rising prevalence of cancer, increasing demand for early and accurate diagnosis, and advancements in next-generation sequencing (NGS) technologies. The market is projected to reach $xx Million by 2033, exhibiting a CAGR of xx% during the forecast period (2025-2033). Technological disruptions, such as the development of more accurate and cost-effective sequencing platforms, are significantly impacting market dynamics. Consumer preferences are shifting towards personalized cancer therapies guided by genomic information, fueling the demand for comprehensive cancer sequencing services. Intense competition among established players and emerging companies further drives innovation and market expansion. Market penetration of NGS technologies is expected to reach xx% by 2033.
Dominant Markets & Segments in Cancer Sequencing Industry
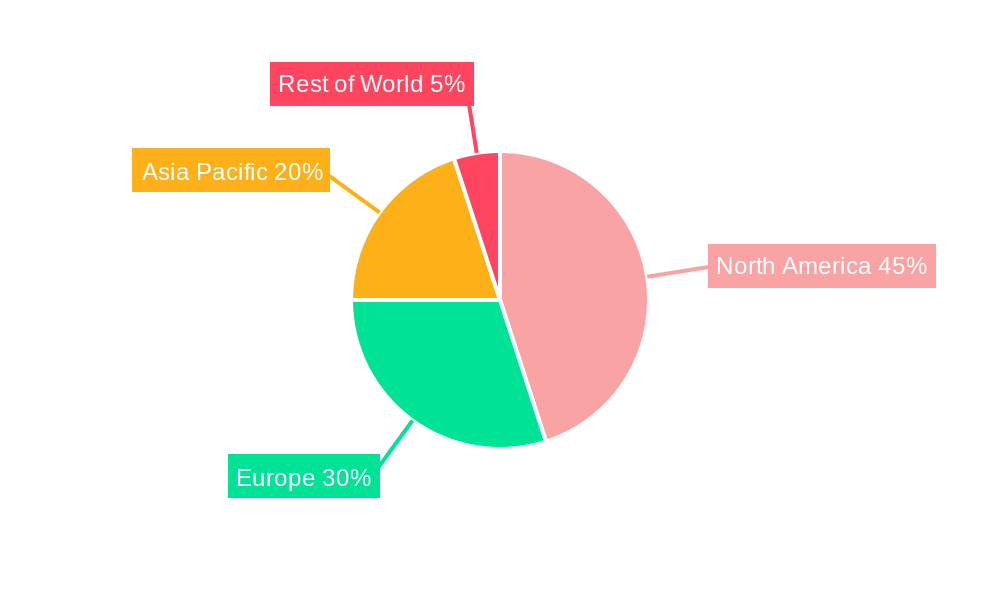
The North American region is currently the dominant market for cancer sequencing, driven by high healthcare expenditure, strong regulatory support, and the presence of major players. Within the technology segments, Genome Sequencing dominates, accounting for approximately xx% of the market share in 2025. The Instruments segment leads in product type, with a market share of xx% in 2025, due to high initial investments required for advanced sequencing facilities.
- Key Drivers in North America:
- High healthcare spending.
- Robust regulatory framework supporting advanced diagnostics.
- Early adoption of new technologies.
- Presence of major market players.
- Genome Sequencing Dominance: Driven by its comprehensive nature and capacity for early cancer detection.
- Instruments Segment Leadership: High initial capital investment drives demand for advanced instruments.
Cancer Sequencing Industry Product Developments
Recent product innovations include advancements in long-read sequencing technologies, portable sequencing devices, and improved bioinformatics tools for data analysis. These developments offer improved accuracy, faster turnaround times, and enhanced accessibility of genomic information, contributing to more effective cancer diagnosis and treatment strategies. The market is witnessing a growing trend toward integrating sequencing data with other omics data, offering a more holistic view of cancer biology.
Report Scope & Segmentation Analysis
The report segments the cancer sequencing market by technology (PCR, Microarrays, Genome Sequencing), product type (Instruments, Consumables, Services), and geography. Growth projections for each segment are presented for the period 2025-2033, along with market size estimations and competitive analysis. Genome Sequencing is projected to experience the highest growth, driven by its superior capabilities in identifying a wider range of genetic variations. The Instruments segment is expected to maintain a significant market share due to the need for advanced equipment. Consumables will experience moderate growth in line with increased sequencing volume.
Key Drivers of Cancer Sequencing Industry Growth
The primary growth drivers include the rising incidence of cancer globally, advancements in sequencing technologies leading to higher accuracy and lower costs, growing demand for personalized medicine, increased government funding for cancer research, and favorable regulatory environments promoting the adoption of advanced diagnostic tools. The development of liquid biopsies and non-invasive testing methods also contributes to market growth.
Challenges in the Cancer Sequencing Industry Sector
Challenges include the high cost of sequencing and data analysis, the complexity of interpreting genomic data, ethical concerns surrounding data privacy and security, and the need for skilled professionals to operate and interpret results. Supply chain disruptions can also impact availability and cost of consumables and instruments. Finally, competition from alternative diagnostic technologies and the need for regulatory approval processes create barriers to entry and market growth.
Emerging Opportunities in Cancer Sequencing Industry
Emerging opportunities include the expansion of cancer screening programs, the development of new diagnostic and prognostic biomarkers, the integration of artificial intelligence (AI) and machine learning in genomic data analysis, and the growing adoption of liquid biopsies. Expanding into developing markets, particularly in Asia and Africa, presents significant growth potential.
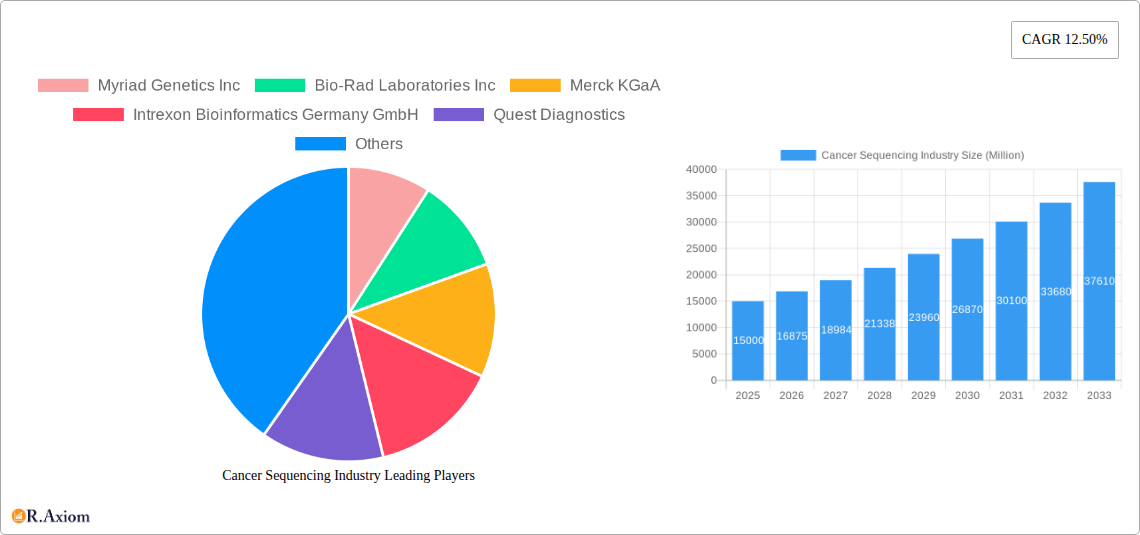
Leading Players in the Cancer Sequencing Industry Market
- Myriad Genetics Inc
- Bio-Rad Laboratories Inc
- Merck KGaA
- Intrexon Bioinformatics Germany GmbH
- Quest Diagnostics
- F Hoffmann-La Roche AG
- Agilent Technologies Inc
- Cancer Genetics Inc
- Luminex Corporation
- Qiagen NV
- Illumina Inc
- Pacific Biosciences of California Inc
- GE Healthcare (GE Company)
- Perkin Elmer
- ThermoFisher Scientific Inc
Key Developments in Cancer Sequencing Industry Industry
- February 2023: Oxford Nanopore Technologies announced the extension of its collaboration with UPS Healthcare to accelerate the delivery of Oxford Nanopore DNA/RNA sequencing products and consumables across the Asia Pacific region. This significantly improves accessibility of its technology in a rapidly growing market.
- August 2022: A research team from ACTREC developed the TMC-SNPdb2.0 genome toolkit, providing a valuable resource for analyzing cancer-specific gene mutations in the Indian population. This addresses a significant data gap and facilitates more targeted cancer research in India.
Strategic Outlook for Cancer Sequencing Industry Market
The cancer sequencing market is poised for continued strong growth, fueled by technological advancements, increasing healthcare spending, and a growing awareness of the importance of personalized medicine. The development of more affordable and accessible sequencing technologies, coupled with the integration of AI and big data analytics, will further accelerate market expansion. New diagnostic applications and expansion into emerging markets will present significant opportunities for growth in the coming years.
Cancer Sequencing Industry Segmentation
-
1. Product Type
- 1.1. Instruments
- 1.2. Consumables
- 1.3. Services
-
2. Technology
- 2.1. PCR
- 2.2. MicroArrays
- 2.3. Genome Sequencing
Cancer Sequencing Industry Segmentation By Geography
-
1. North America
- 1.1. United States
- 1.2. Canada
- 1.3. Mexico
-
2. Europe
- 2.1. Germany
- 2.2. United Kingdom
- 2.3. France
- 2.4. Italy
- 2.5. Spain
- 2.6. Rest of Europe
-
3. Asia Pacific
- 3.1. China
- 3.2. Japan
- 3.3. India
- 3.4. Australia
- 3.5. South Korea
- 3.6. Rest of Asia Pacific
-
4. Middle East and Africa
- 4.1. GCC
- 4.2. South Africa
- 4.3. Rest of Middle East and Africa
-
5. South America
- 5.1. Brazil
- 5.2. Argentina
- 5.3. Rest of South America
Cancer Sequencing Industry REPORT HIGHLIGHTS
| Aspects | Details |
|---|---|
| Study Period | 2019-2033 |
| Base Year | 2024 |
| Estimated Year | 2025 |
| Forecast Period | 2025-2033 |
| Historical Period | 2019-2024 |
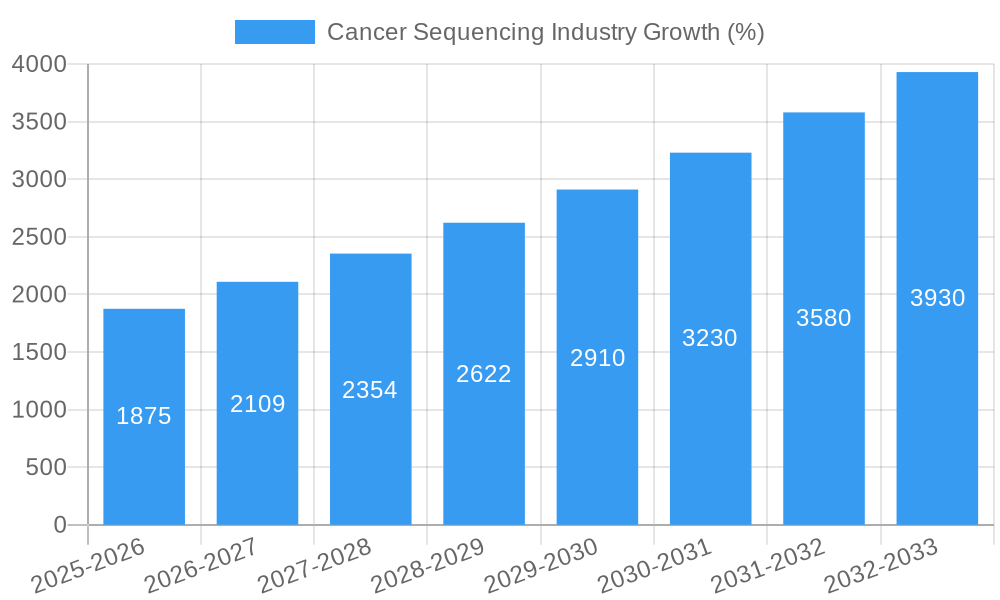
| Growth Rate | CAGR of 12.50% from 2019-2033 |
| Segmentation |
|
Table of Contents
- 1. Introduction
- 1.1. Research Scope
- 1.2. Market Segmentation
- 1.3. Research Methodology
- 1.4. Definitions and Assumptions
- 2. Executive Summary
- 2.1. Introduction
- 3. Market Dynamics
- 3.1. Introduction
- 3.2. Market Drivers
- 3.2.1 Growing Burden of Cancer; Initiatives taken by Companies in Product Development; Speed
- 3.2.2 Accuracy and Potential Replacement for Traditional Technologies to Spur Market Growth
- 3.3. Market Restrains
- 3.3.1. Interpretation of Complex Data and Lack of Skilled Professionals; High Cost of Instruments and Procedures
- 3.4. Market Trends
- 3.4.1. Genome Sequencing Segment is Expected to Hold a Major Market Share
- 4. Market Factor Analysis
- 4.1. Porters Five Forces
- 4.2. Supply/Value Chain
- 4.3. PESTEL analysis
- 4.4. Market Entropy
- 4.5. Patent/Trademark Analysis
- 5. Global Cancer Sequencing Industry Analysis, Insights and Forecast, 2019-2031
- 5.1. Market Analysis, Insights and Forecast - by Product Type
- 5.1.1. Instruments
- 5.1.2. Consumables
- 5.1.3. Services
- 5.2. Market Analysis, Insights and Forecast - by Technology
- 5.2.1. PCR
- 5.2.2. MicroArrays
- 5.2.3. Genome Sequencing
- 5.3. Market Analysis, Insights and Forecast - by Region
- 5.3.1. North America
- 5.3.2. Europe
- 5.3.3. Asia Pacific
- 5.3.4. Middle East and Africa
- 5.3.5. South America
- 5.1. Market Analysis, Insights and Forecast - by Product Type
- 6. North America Cancer Sequencing Industry Analysis, Insights and Forecast, 2019-2031
- 6.1. Market Analysis, Insights and Forecast - by Product Type
- 6.1.1. Instruments
- 6.1.2. Consumables
- 6.1.3. Services
- 6.2. Market Analysis, Insights and Forecast - by Technology
- 6.2.1. PCR
- 6.2.2. MicroArrays
- 6.2.3. Genome Sequencing
- 6.1. Market Analysis, Insights and Forecast - by Product Type
- 7. Europe Cancer Sequencing Industry Analysis, Insights and Forecast, 2019-2031
- 7.1. Market Analysis, Insights and Forecast - by Product Type
- 7.1.1. Instruments
- 7.1.2. Consumables
- 7.1.3. Services
- 7.2. Market Analysis, Insights and Forecast - by Technology
- 7.2.1. PCR
- 7.2.2. MicroArrays
- 7.2.3. Genome Sequencing
- 7.1. Market Analysis, Insights and Forecast - by Product Type
- 8. Asia Pacific Cancer Sequencing Industry Analysis, Insights and Forecast, 2019-2031
- 8.1. Market Analysis, Insights and Forecast - by Product Type
- 8.1.1. Instruments
- 8.1.2. Consumables
- 8.1.3. Services
- 8.2. Market Analysis, Insights and Forecast - by Technology
- 8.2.1. PCR
- 8.2.2. MicroArrays
- 8.2.3. Genome Sequencing
- 8.1. Market Analysis, Insights and Forecast - by Product Type
- 9. Middle East and Africa Cancer Sequencing Industry Analysis, Insights and Forecast, 2019-2031
- 9.1. Market Analysis, Insights and Forecast - by Product Type
- 9.1.1. Instruments
- 9.1.2. Consumables
- 9.1.3. Services
- 9.2. Market Analysis, Insights and Forecast - by Technology
- 9.2.1. PCR
- 9.2.2. MicroArrays
- 9.2.3. Genome Sequencing
- 9.1. Market Analysis, Insights and Forecast - by Product Type
- 10. South America Cancer Sequencing Industry Analysis, Insights and Forecast, 2019-2031
- 10.1. Market Analysis, Insights and Forecast - by Product Type
- 10.1.1. Instruments
- 10.1.2. Consumables
- 10.1.3. Services
- 10.2. Market Analysis, Insights and Forecast - by Technology
- 10.2.1. PCR
- 10.2.2. MicroArrays
- 10.2.3. Genome Sequencing
- 10.1. Market Analysis, Insights and Forecast - by Product Type
- 11. North America Cancer Sequencing Industry Analysis, Insights and Forecast, 2019-2031
- 11.1. Market Analysis, Insights and Forecast - By Country/Sub-region
- 11.1.1 United States
- 11.1.2 Canada
- 11.1.3 Mexico
- 12. Europe Cancer Sequencing Industry Analysis, Insights and Forecast, 2019-2031
- 12.1. Market Analysis, Insights and Forecast - By Country/Sub-region
- 12.1.1 Germany
- 12.1.2 United Kingdom
- 12.1.3 France
- 12.1.4 Italy
- 12.1.5 Spain
- 12.1.6 Rest of Europe
- 13. Asia Pacific Cancer Sequencing Industry Analysis, Insights and Forecast, 2019-2031
- 13.1. Market Analysis, Insights and Forecast - By Country/Sub-region
- 13.1.1 China
- 13.1.2 Japan
- 13.1.3 India
- 13.1.4 Australia
- 13.1.5 South Korea
- 13.1.6 Rest of Asia Pacific
- 14. Middle East and Africa Cancer Sequencing Industry Analysis, Insights and Forecast, 2019-2031
- 14.1. Market Analysis, Insights and Forecast - By Country/Sub-region
- 14.1.1 GCC
- 14.1.2 South Africa
- 14.1.3 Rest of Middle East and Africa
- 15. South America Cancer Sequencing Industry Analysis, Insights and Forecast, 2019-2031
- 15.1. Market Analysis, Insights and Forecast - By Country/Sub-region
- 15.1.1 Brazil
- 15.1.2 Argentina
- 15.1.3 Rest of South America
- 16. Competitive Analysis
- 16.1. Global Market Share Analysis 2024
- 16.2. Company Profiles
- 16.2.1 Myriad Genetics Inc
- 16.2.1.1. Overview
- 16.2.1.2. Products
- 16.2.1.3. SWOT Analysis
- 16.2.1.4. Recent Developments
- 16.2.1.5. Financials (Based on Availability)
- 16.2.2 Bio-Rad Laboratories Inc
- 16.2.2.1. Overview
- 16.2.2.2. Products
- 16.2.2.3. SWOT Analysis
- 16.2.2.4. Recent Developments
- 16.2.2.5. Financials (Based on Availability)
- 16.2.3 Merck KGaA
- 16.2.3.1. Overview
- 16.2.3.2. Products
- 16.2.3.3. SWOT Analysis
- 16.2.3.4. Recent Developments
- 16.2.3.5. Financials (Based on Availability)
- 16.2.4 Intrexon Bioinformatics Germany GmbH
- 16.2.4.1. Overview
- 16.2.4.2. Products
- 16.2.4.3. SWOT Analysis
- 16.2.4.4. Recent Developments
- 16.2.4.5. Financials (Based on Availability)
- 16.2.5 Quest Diagnostics
- 16.2.5.1. Overview
- 16.2.5.2. Products
- 16.2.5.3. SWOT Analysis
- 16.2.5.4. Recent Developments
- 16.2.5.5. Financials (Based on Availability)
- 16.2.6 F Hoffmann-La Roche AG
- 16.2.6.1. Overview
- 16.2.6.2. Products
- 16.2.6.3. SWOT Analysis
- 16.2.6.4. Recent Developments
- 16.2.6.5. Financials (Based on Availability)
- 16.2.7 Agilent Technologies Inc
- 16.2.7.1. Overview
- 16.2.7.2. Products
- 16.2.7.3. SWOT Analysis
- 16.2.7.4. Recent Developments
- 16.2.7.5. Financials (Based on Availability)
- 16.2.8 Cancer Genetics Inc
- 16.2.8.1. Overview
- 16.2.8.2. Products
- 16.2.8.3. SWOT Analysis
- 16.2.8.4. Recent Developments
- 16.2.8.5. Financials (Based on Availability)
- 16.2.9 Luminex Corporation
- 16.2.9.1. Overview
- 16.2.9.2. Products
- 16.2.9.3. SWOT Analysis
- 16.2.9.4. Recent Developments
- 16.2.9.5. Financials (Based on Availability)
- 16.2.10 Qiagen NV
- 16.2.10.1. Overview
- 16.2.10.2. Products
- 16.2.10.3. SWOT Analysis
- 16.2.10.4. Recent Developments
- 16.2.10.5. Financials (Based on Availability)
- 16.2.11 Illumina Inc
- 16.2.11.1. Overview
- 16.2.11.2. Products
- 16.2.11.3. SWOT Analysis
- 16.2.11.4. Recent Developments
- 16.2.11.5. Financials (Based on Availability)
- 16.2.12 Pacific Biosciences of California Inc
- 16.2.12.1. Overview
- 16.2.12.2. Products
- 16.2.12.3. SWOT Analysis
- 16.2.12.4. Recent Developments
- 16.2.12.5. Financials (Based on Availability)
- 16.2.13 GE Healthcare (GE Company)
- 16.2.13.1. Overview
- 16.2.13.2. Products
- 16.2.13.3. SWOT Analysis
- 16.2.13.4. Recent Developments
- 16.2.13.5. Financials (Based on Availability)
- 16.2.14 Perkin Elmer
- 16.2.14.1. Overview
- 16.2.14.2. Products
- 16.2.14.3. SWOT Analysis
- 16.2.14.4. Recent Developments
- 16.2.14.5. Financials (Based on Availability)
- 16.2.15 ThermoFisher Scientific Inc
- 16.2.15.1. Overview
- 16.2.15.2. Products
- 16.2.15.3. SWOT Analysis
- 16.2.15.4. Recent Developments
- 16.2.15.5. Financials (Based on Availability)
- 16.2.1 Myriad Genetics Inc
List of Figures
- Figure 1: Global Cancer Sequencing Industry Revenue Breakdown (Million, %) by Region 2024 & 2032
- Figure 2: Global Cancer Sequencing Industry Volume Breakdown (K Unit, %) by Region 2024 & 2032
- Figure 3: North America Cancer Sequencing Industry Revenue (Million), by Country 2024 & 2032
- Figure 4: North America Cancer Sequencing Industry Volume (K Unit), by Country 2024 & 2032
- Figure 5: North America Cancer Sequencing Industry Revenue Share (%), by Country 2024 & 2032
- Figure 6: North America Cancer Sequencing Industry Volume Share (%), by Country 2024 & 2032
- Figure 7: Europe Cancer Sequencing Industry Revenue (Million), by Country 2024 & 2032
- Figure 8: Europe Cancer Sequencing Industry Volume (K Unit), by Country 2024 & 2032
- Figure 9: Europe Cancer Sequencing Industry Revenue Share (%), by Country 2024 & 2032
- Figure 10: Europe Cancer Sequencing Industry Volume Share (%), by Country 2024 & 2032
- Figure 11: Asia Pacific Cancer Sequencing Industry Revenue (Million), by Country 2024 & 2032
- Figure 12: Asia Pacific Cancer Sequencing Industry Volume (K Unit), by Country 2024 & 2032
- Figure 13: Asia Pacific Cancer Sequencing Industry Revenue Share (%), by Country 2024 & 2032
- Figure 14: Asia Pacific Cancer Sequencing Industry Volume Share (%), by Country 2024 & 2032
- Figure 15: Middle East and Africa Cancer Sequencing Industry Revenue (Million), by Country 2024 & 2032
- Figure 16: Middle East and Africa Cancer Sequencing Industry Volume (K Unit), by Country 2024 & 2032
- Figure 17: Middle East and Africa Cancer Sequencing Industry Revenue Share (%), by Country 2024 & 2032
- Figure 18: Middle East and Africa Cancer Sequencing Industry Volume Share (%), by Country 2024 & 2032
- Figure 19: South America Cancer Sequencing Industry Revenue (Million), by Country 2024 & 2032
- Figure 20: South America Cancer Sequencing Industry Volume (K Unit), by Country 2024 & 2032
- Figure 21: South America Cancer Sequencing Industry Revenue Share (%), by Country 2024 & 2032
- Figure 22: South America Cancer Sequencing Industry Volume Share (%), by Country 2024 & 2032
- Figure 23: North America Cancer Sequencing Industry Revenue (Million), by Product Type 2024 & 2032
- Figure 24: North America Cancer Sequencing Industry Volume (K Unit), by Product Type 2024 & 2032
- Figure 25: North America Cancer Sequencing Industry Revenue Share (%), by Product Type 2024 & 2032
- Figure 26: North America Cancer Sequencing Industry Volume Share (%), by Product Type 2024 & 2032
- Figure 27: North America Cancer Sequencing Industry Revenue (Million), by Technology 2024 & 2032
- Figure 28: North America Cancer Sequencing Industry Volume (K Unit), by Technology 2024 & 2032
- Figure 29: North America Cancer Sequencing Industry Revenue Share (%), by Technology 2024 & 2032
- Figure 30: North America Cancer Sequencing Industry Volume Share (%), by Technology 2024 & 2032
- Figure 31: North America Cancer Sequencing Industry Revenue (Million), by Country 2024 & 2032
- Figure 32: North America Cancer Sequencing Industry Volume (K Unit), by Country 2024 & 2032
- Figure 33: North America Cancer Sequencing Industry Revenue Share (%), by Country 2024 & 2032
- Figure 34: North America Cancer Sequencing Industry Volume Share (%), by Country 2024 & 2032
- Figure 35: Europe Cancer Sequencing Industry Revenue (Million), by Product Type 2024 & 2032
- Figure 36: Europe Cancer Sequencing Industry Volume (K Unit), by Product Type 2024 & 2032
- Figure 37: Europe Cancer Sequencing Industry Revenue Share (%), by Product Type 2024 & 2032
- Figure 38: Europe Cancer Sequencing Industry Volume Share (%), by Product Type 2024 & 2032
- Figure 39: Europe Cancer Sequencing Industry Revenue (Million), by Technology 2024 & 2032
- Figure 40: Europe Cancer Sequencing Industry Volume (K Unit), by Technology 2024 & 2032
- Figure 41: Europe Cancer Sequencing Industry Revenue Share (%), by Technology 2024 & 2032
- Figure 42: Europe Cancer Sequencing Industry Volume Share (%), by Technology 2024 & 2032
- Figure 43: Europe Cancer Sequencing Industry Revenue (Million), by Country 2024 & 2032
- Figure 44: Europe Cancer Sequencing Industry Volume (K Unit), by Country 2024 & 2032
- Figure 45: Europe Cancer Sequencing Industry Revenue Share (%), by Country 2024 & 2032
- Figure 46: Europe Cancer Sequencing Industry Volume Share (%), by Country 2024 & 2032
- Figure 47: Asia Pacific Cancer Sequencing Industry Revenue (Million), by Product Type 2024 & 2032
- Figure 48: Asia Pacific Cancer Sequencing Industry Volume (K Unit), by Product Type 2024 & 2032
- Figure 49: Asia Pacific Cancer Sequencing Industry Revenue Share (%), by Product Type 2024 & 2032
- Figure 50: Asia Pacific Cancer Sequencing Industry Volume Share (%), by Product Type 2024 & 2032
- Figure 51: Asia Pacific Cancer Sequencing Industry Revenue (Million), by Technology 2024 & 2032
- Figure 52: Asia Pacific Cancer Sequencing Industry Volume (K Unit), by Technology 2024 & 2032
- Figure 53: Asia Pacific Cancer Sequencing Industry Revenue Share (%), by Technology 2024 & 2032
- Figure 54: Asia Pacific Cancer Sequencing Industry Volume Share (%), by Technology 2024 & 2032
- Figure 55: Asia Pacific Cancer Sequencing Industry Revenue (Million), by Country 2024 & 2032
- Figure 56: Asia Pacific Cancer Sequencing Industry Volume (K Unit), by Country 2024 & 2032
- Figure 57: Asia Pacific Cancer Sequencing Industry Revenue Share (%), by Country 2024 & 2032
- Figure 58: Asia Pacific Cancer Sequencing Industry Volume Share (%), by Country 2024 & 2032
- Figure 59: Middle East and Africa Cancer Sequencing Industry Revenue (Million), by Product Type 2024 & 2032
- Figure 60: Middle East and Africa Cancer Sequencing Industry Volume (K Unit), by Product Type 2024 & 2032
- Figure 61: Middle East and Africa Cancer Sequencing Industry Revenue Share (%), by Product Type 2024 & 2032
- Figure 62: Middle East and Africa Cancer Sequencing Industry Volume Share (%), by Product Type 2024 & 2032
- Figure 63: Middle East and Africa Cancer Sequencing Industry Revenue (Million), by Technology 2024 & 2032
- Figure 64: Middle East and Africa Cancer Sequencing Industry Volume (K Unit), by Technology 2024 & 2032
- Figure 65: Middle East and Africa Cancer Sequencing Industry Revenue Share (%), by Technology 2024 & 2032
- Figure 66: Middle East and Africa Cancer Sequencing Industry Volume Share (%), by Technology 2024 & 2032
- Figure 67: Middle East and Africa Cancer Sequencing Industry Revenue (Million), by Country 2024 & 2032
- Figure 68: Middle East and Africa Cancer Sequencing Industry Volume (K Unit), by Country 2024 & 2032
- Figure 69: Middle East and Africa Cancer Sequencing Industry Revenue Share (%), by Country 2024 & 2032
- Figure 70: Middle East and Africa Cancer Sequencing Industry Volume Share (%), by Country 2024 & 2032
- Figure 71: South America Cancer Sequencing Industry Revenue (Million), by Product Type 2024 & 2032
- Figure 72: South America Cancer Sequencing Industry Volume (K Unit), by Product Type 2024 & 2032
- Figure 73: South America Cancer Sequencing Industry Revenue Share (%), by Product Type 2024 & 2032
- Figure 74: South America Cancer Sequencing Industry Volume Share (%), by Product Type 2024 & 2032
- Figure 75: South America Cancer Sequencing Industry Revenue (Million), by Technology 2024 & 2032
- Figure 76: South America Cancer Sequencing Industry Volume (K Unit), by Technology 2024 & 2032
- Figure 77: South America Cancer Sequencing Industry Revenue Share (%), by Technology 2024 & 2032
- Figure 78: South America Cancer Sequencing Industry Volume Share (%), by Technology 2024 & 2032
- Figure 79: South America Cancer Sequencing Industry Revenue (Million), by Country 2024 & 2032
- Figure 80: South America Cancer Sequencing Industry Volume (K Unit), by Country 2024 & 2032
- Figure 81: South America Cancer Sequencing Industry Revenue Share (%), by Country 2024 & 2032
- Figure 82: South America Cancer Sequencing Industry Volume Share (%), by Country 2024 & 2032
List of Tables
- Table 1: Global Cancer Sequencing Industry Revenue Million Forecast, by Region 2019 & 2032
- Table 2: Global Cancer Sequencing Industry Volume K Unit Forecast, by Region 2019 & 2032
- Table 3: Global Cancer Sequencing Industry Revenue Million Forecast, by Product Type 2019 & 2032
- Table 4: Global Cancer Sequencing Industry Volume K Unit Forecast, by Product Type 2019 & 2032
- Table 5: Global Cancer Sequencing Industry Revenue Million Forecast, by Technology 2019 & 2032
- Table 6: Global Cancer Sequencing Industry Volume K Unit Forecast, by Technology 2019 & 2032
- Table 7: Global Cancer Sequencing Industry Revenue Million Forecast, by Region 2019 & 2032
- Table 8: Global Cancer Sequencing Industry Volume K Unit Forecast, by Region 2019 & 2032
- Table 9: Global Cancer Sequencing Industry Revenue Million Forecast, by Country 2019 & 2032
- Table 10: Global Cancer Sequencing Industry Volume K Unit Forecast, by Country 2019 & 2032
- Table 11: United States Cancer Sequencing Industry Revenue (Million) Forecast, by Application 2019 & 2032
- Table 12: United States Cancer Sequencing Industry Volume (K Unit) Forecast, by Application 2019 & 2032
- Table 13: Canada Cancer Sequencing Industry Revenue (Million) Forecast, by Application 2019 & 2032
- Table 14: Canada Cancer Sequencing Industry Volume (K Unit) Forecast, by Application 2019 & 2032
- Table 15: Mexico Cancer Sequencing Industry Revenue (Million) Forecast, by Application 2019 & 2032
- Table 16: Mexico Cancer Sequencing Industry Volume (K Unit) Forecast, by Application 2019 & 2032
- Table 17: Global Cancer Sequencing Industry Revenue Million Forecast, by Country 2019 & 2032
- Table 18: Global Cancer Sequencing Industry Volume K Unit Forecast, by Country 2019 & 2032
- Table 19: Germany Cancer Sequencing Industry Revenue (Million) Forecast, by Application 2019 & 2032
- Table 20: Germany Cancer Sequencing Industry Volume (K Unit) Forecast, by Application 2019 & 2032
- Table 21: United Kingdom Cancer Sequencing Industry Revenue (Million) Forecast, by Application 2019 & 2032
- Table 22: United Kingdom Cancer Sequencing Industry Volume (K Unit) Forecast, by Application 2019 & 2032
- Table 23: France Cancer Sequencing Industry Revenue (Million) Forecast, by Application 2019 & 2032
- Table 24: France Cancer Sequencing Industry Volume (K Unit) Forecast, by Application 2019 & 2032
- Table 25: Italy Cancer Sequencing Industry Revenue (Million) Forecast, by Application 2019 & 2032
- Table 26: Italy Cancer Sequencing Industry Volume (K Unit) Forecast, by Application 2019 & 2032
- Table 27: Spain Cancer Sequencing Industry Revenue (Million) Forecast, by Application 2019 & 2032
- Table 28: Spain Cancer Sequencing Industry Volume (K Unit) Forecast, by Application 2019 & 2032
- Table 29: Rest of Europe Cancer Sequencing Industry Revenue (Million) Forecast, by Application 2019 & 2032
- Table 30: Rest of Europe Cancer Sequencing Industry Volume (K Unit) Forecast, by Application 2019 & 2032
- Table 31: Global Cancer Sequencing Industry Revenue Million Forecast, by Country 2019 & 2032
- Table 32: Global Cancer Sequencing Industry Volume K Unit Forecast, by Country 2019 & 2032
- Table 33: China Cancer Sequencing Industry Revenue (Million) Forecast, by Application 2019 & 2032
- Table 34: China Cancer Sequencing Industry Volume (K Unit) Forecast, by Application 2019 & 2032
- Table 35: Japan Cancer Sequencing Industry Revenue (Million) Forecast, by Application 2019 & 2032
- Table 36: Japan Cancer Sequencing Industry Volume (K Unit) Forecast, by Application 2019 & 2032
- Table 37: India Cancer Sequencing Industry Revenue (Million) Forecast, by Application 2019 & 2032
- Table 38: India Cancer Sequencing Industry Volume (K Unit) Forecast, by Application 2019 & 2032
- Table 39: Australia Cancer Sequencing Industry Revenue (Million) Forecast, by Application 2019 & 2032
- Table 40: Australia Cancer Sequencing Industry Volume (K Unit) Forecast, by Application 2019 & 2032
- Table 41: South Korea Cancer Sequencing Industry Revenue (Million) Forecast, by Application 2019 & 2032
- Table 42: South Korea Cancer Sequencing Industry Volume (K Unit) Forecast, by Application 2019 & 2032
- Table 43: Rest of Asia Pacific Cancer Sequencing Industry Revenue (Million) Forecast, by Application 2019 & 2032
- Table 44: Rest of Asia Pacific Cancer Sequencing Industry Volume (K Unit) Forecast, by Application 2019 & 2032
- Table 45: Global Cancer Sequencing Industry Revenue Million Forecast, by Country 2019 & 2032
- Table 46: Global Cancer Sequencing Industry Volume K Unit Forecast, by Country 2019 & 2032
- Table 47: GCC Cancer Sequencing Industry Revenue (Million) Forecast, by Application 2019 & 2032
- Table 48: GCC Cancer Sequencing Industry Volume (K Unit) Forecast, by Application 2019 & 2032
- Table 49: South Africa Cancer Sequencing Industry Revenue (Million) Forecast, by Application 2019 & 2032
- Table 50: South Africa Cancer Sequencing Industry Volume (K Unit) Forecast, by Application 2019 & 2032
- Table 51: Rest of Middle East and Africa Cancer Sequencing Industry Revenue (Million) Forecast, by Application 2019 & 2032
- Table 52: Rest of Middle East and Africa Cancer Sequencing Industry Volume (K Unit) Forecast, by Application 2019 & 2032
- Table 53: Global Cancer Sequencing Industry Revenue Million Forecast, by Country 2019 & 2032
- Table 54: Global Cancer Sequencing Industry Volume K Unit Forecast, by Country 2019 & 2032
- Table 55: Brazil Cancer Sequencing Industry Revenue (Million) Forecast, by Application 2019 & 2032
- Table 56: Brazil Cancer Sequencing Industry Volume (K Unit) Forecast, by Application 2019 & 2032
- Table 57: Argentina Cancer Sequencing Industry Revenue (Million) Forecast, by Application 2019 & 2032
- Table 58: Argentina Cancer Sequencing Industry Volume (K Unit) Forecast, by Application 2019 & 2032
- Table 59: Rest of South America Cancer Sequencing Industry Revenue (Million) Forecast, by Application 2019 & 2032
- Table 60: Rest of South America Cancer Sequencing Industry Volume (K Unit) Forecast, by Application 2019 & 2032
- Table 61: Global Cancer Sequencing Industry Revenue Million Forecast, by Product Type 2019 & 2032
- Table 62: Global Cancer Sequencing Industry Volume K Unit Forecast, by Product Type 2019 & 2032
- Table 63: Global Cancer Sequencing Industry Revenue Million Forecast, by Technology 2019 & 2032
- Table 64: Global Cancer Sequencing Industry Volume K Unit Forecast, by Technology 2019 & 2032
- Table 65: Global Cancer Sequencing Industry Revenue Million Forecast, by Country 2019 & 2032
- Table 66: Global Cancer Sequencing Industry Volume K Unit Forecast, by Country 2019 & 2032
- Table 67: United States Cancer Sequencing Industry Revenue (Million) Forecast, by Application 2019 & 2032
- Table 68: United States Cancer Sequencing Industry Volume (K Unit) Forecast, by Application 2019 & 2032
- Table 69: Canada Cancer Sequencing Industry Revenue (Million) Forecast, by Application 2019 & 2032
- Table 70: Canada Cancer Sequencing Industry Volume (K Unit) Forecast, by Application 2019 & 2032
- Table 71: Mexico Cancer Sequencing Industry Revenue (Million) Forecast, by Application 2019 & 2032
- Table 72: Mexico Cancer Sequencing Industry Volume (K Unit) Forecast, by Application 2019 & 2032
- Table 73: Global Cancer Sequencing Industry Revenue Million Forecast, by Product Type 2019 & 2032
- Table 74: Global Cancer Sequencing Industry Volume K Unit Forecast, by Product Type 2019 & 2032
- Table 75: Global Cancer Sequencing Industry Revenue Million Forecast, by Technology 2019 & 2032
- Table 76: Global Cancer Sequencing Industry Volume K Unit Forecast, by Technology 2019 & 2032
- Table 77: Global Cancer Sequencing Industry Revenue Million Forecast, by Country 2019 & 2032
- Table 78: Global Cancer Sequencing Industry Volume K Unit Forecast, by Country 2019 & 2032
- Table 79: Germany Cancer Sequencing Industry Revenue (Million) Forecast, by Application 2019 & 2032
- Table 80: Germany Cancer Sequencing Industry Volume (K Unit) Forecast, by Application 2019 & 2032
- Table 81: United Kingdom Cancer Sequencing Industry Revenue (Million) Forecast, by Application 2019 & 2032
- Table 82: United Kingdom Cancer Sequencing Industry Volume (K Unit) Forecast, by Application 2019 & 2032
- Table 83: France Cancer Sequencing Industry Revenue (Million) Forecast, by Application 2019 & 2032
- Table 84: France Cancer Sequencing Industry Volume (K Unit) Forecast, by Application 2019 & 2032
- Table 85: Italy Cancer Sequencing Industry Revenue (Million) Forecast, by Application 2019 & 2032
- Table 86: Italy Cancer Sequencing Industry Volume (K Unit) Forecast, by Application 2019 & 2032
- Table 87: Spain Cancer Sequencing Industry Revenue (Million) Forecast, by Application 2019 & 2032
- Table 88: Spain Cancer Sequencing Industry Volume (K Unit) Forecast, by Application 2019 & 2032
- Table 89: Rest of Europe Cancer Sequencing Industry Revenue (Million) Forecast, by Application 2019 & 2032
- Table 90: Rest of Europe Cancer Sequencing Industry Volume (K Unit) Forecast, by Application 2019 & 2032
- Table 91: Global Cancer Sequencing Industry Revenue Million Forecast, by Product Type 2019 & 2032
- Table 92: Global Cancer Sequencing Industry Volume K Unit Forecast, by Product Type 2019 & 2032
- Table 93: Global Cancer Sequencing Industry Revenue Million Forecast, by Technology 2019 & 2032
- Table 94: Global Cancer Sequencing Industry Volume K Unit Forecast, by Technology 2019 & 2032
- Table 95: Global Cancer Sequencing Industry Revenue Million Forecast, by Country 2019 & 2032
- Table 96: Global Cancer Sequencing Industry Volume K Unit Forecast, by Country 2019 & 2032
- Table 97: China Cancer Sequencing Industry Revenue (Million) Forecast, by Application 2019 & 2032
- Table 98: China Cancer Sequencing Industry Volume (K Unit) Forecast, by Application 2019 & 2032
- Table 99: Japan Cancer Sequencing Industry Revenue (Million) Forecast, by Application 2019 & 2032
- Table 100: Japan Cancer Sequencing Industry Volume (K Unit) Forecast, by Application 2019 & 2032
- Table 101: India Cancer Sequencing Industry Revenue (Million) Forecast, by Application 2019 & 2032
- Table 102: India Cancer Sequencing Industry Volume (K Unit) Forecast, by Application 2019 & 2032
- Table 103: Australia Cancer Sequencing Industry Revenue (Million) Forecast, by Application 2019 & 2032
- Table 104: Australia Cancer Sequencing Industry Volume (K Unit) Forecast, by Application 2019 & 2032
- Table 105: South Korea Cancer Sequencing Industry Revenue (Million) Forecast, by Application 2019 & 2032
- Table 106: South Korea Cancer Sequencing Industry Volume (K Unit) Forecast, by Application 2019 & 2032
- Table 107: Rest of Asia Pacific Cancer Sequencing Industry Revenue (Million) Forecast, by Application 2019 & 2032
- Table 108: Rest of Asia Pacific Cancer Sequencing Industry Volume (K Unit) Forecast, by Application 2019 & 2032
- Table 109: Global Cancer Sequencing Industry Revenue Million Forecast, by Product Type 2019 & 2032
- Table 110: Global Cancer Sequencing Industry Volume K Unit Forecast, by Product Type 2019 & 2032
- Table 111: Global Cancer Sequencing Industry Revenue Million Forecast, by Technology 2019 & 2032
- Table 112: Global Cancer Sequencing Industry Volume K Unit Forecast, by Technology 2019 & 2032
- Table 113: Global Cancer Sequencing Industry Revenue Million Forecast, by Country 2019 & 2032
- Table 114: Global Cancer Sequencing Industry Volume K Unit Forecast, by Country 2019 & 2032
- Table 115: GCC Cancer Sequencing Industry Revenue (Million) Forecast, by Application 2019 & 2032
- Table 116: GCC Cancer Sequencing Industry Volume (K Unit) Forecast, by Application 2019 & 2032
- Table 117: South Africa Cancer Sequencing Industry Revenue (Million) Forecast, by Application 2019 & 2032
- Table 118: South Africa Cancer Sequencing Industry Volume (K Unit) Forecast, by Application 2019 & 2032
- Table 119: Rest of Middle East and Africa Cancer Sequencing Industry Revenue (Million) Forecast, by Application 2019 & 2032
- Table 120: Rest of Middle East and Africa Cancer Sequencing Industry Volume (K Unit) Forecast, by Application 2019 & 2032
- Table 121: Global Cancer Sequencing Industry Revenue Million Forecast, by Product Type 2019 & 2032
- Table 122: Global Cancer Sequencing Industry Volume K Unit Forecast, by Product Type 2019 & 2032
- Table 123: Global Cancer Sequencing Industry Revenue Million Forecast, by Technology 2019 & 2032
- Table 124: Global Cancer Sequencing Industry Volume K Unit Forecast, by Technology 2019 & 2032
- Table 125: Global Cancer Sequencing Industry Revenue Million Forecast, by Country 2019 & 2032
- Table 126: Global Cancer Sequencing Industry Volume K Unit Forecast, by Country 2019 & 2032
- Table 127: Brazil Cancer Sequencing Industry Revenue (Million) Forecast, by Application 2019 & 2032
- Table 128: Brazil Cancer Sequencing Industry Volume (K Unit) Forecast, by Application 2019 & 2032
- Table 129: Argentina Cancer Sequencing Industry Revenue (Million) Forecast, by Application 2019 & 2032
- Table 130: Argentina Cancer Sequencing Industry Volume (K Unit) Forecast, by Application 2019 & 2032
- Table 131: Rest of South America Cancer Sequencing Industry Revenue (Million) Forecast, by Application 2019 & 2032
- Table 132: Rest of South America Cancer Sequencing Industry Volume (K Unit) Forecast, by Application 2019 & 2032
Frequently Asked Questions
1. What is the projected Compound Annual Growth Rate (CAGR) of the Cancer Sequencing Industry?
The projected CAGR is approximately 12.50%.
2. Which companies are prominent players in the Cancer Sequencing Industry?
Key companies in the market include Myriad Genetics Inc, Bio-Rad Laboratories Inc, Merck KGaA, Intrexon Bioinformatics Germany GmbH, Quest Diagnostics, F Hoffmann-La Roche AG, Agilent Technologies Inc, Cancer Genetics Inc, Luminex Corporation, Qiagen NV, Illumina Inc, Pacific Biosciences of California Inc, GE Healthcare (GE Company), Perkin Elmer, ThermoFisher Scientific Inc.
3. What are the main segments of the Cancer Sequencing Industry?
The market segments include Product Type, Technology.
4. Can you provide details about the market size?
The market size is estimated to be USD XX Million as of 2022.
5. What are some drivers contributing to market growth?
Growing Burden of Cancer; Initiatives taken by Companies in Product Development; Speed. Accuracy and Potential Replacement for Traditional Technologies to Spur Market Growth.
6. What are the notable trends driving market growth?
Genome Sequencing Segment is Expected to Hold a Major Market Share.
7. Are there any restraints impacting market growth?
Interpretation of Complex Data and Lack of Skilled Professionals; High Cost of Instruments and Procedures.
8. Can you provide examples of recent developments in the market?
February 2023: Oxford Nanopore Technologies announced the extension of its collaboration with UPS Healthcare to accelerate the delivery of Oxford Nanopore DNA/RNA sequencing products and consumables across the Asia Pacific region.
9. What pricing options are available for accessing the report?
Pricing options include single-user, multi-user, and enterprise licenses priced at USD 4750, USD 5250, and USD 8750 respectively.
10. Is the market size provided in terms of value or volume?
The market size is provided in terms of value, measured in Million and volume, measured in K Unit.
11. Are there any specific market keywords associated with the report?
Yes, the market keyword associated with the report is "Cancer Sequencing Industry," which aids in identifying and referencing the specific market segment covered.
12. How do I determine which pricing option suits my needs best?
The pricing options vary based on user requirements and access needs. Individual users may opt for single-user licenses, while businesses requiring broader access may choose multi-user or enterprise licenses for cost-effective access to the report.
13. Are there any additional resources or data provided in the Cancer Sequencing Industry report?
While the report offers comprehensive insights, it's advisable to review the specific contents or supplementary materials provided to ascertain if additional resources or data are available.
14. How can I stay updated on further developments or reports in the Cancer Sequencing Industry?
To stay informed about further developments, trends, and reports in the Cancer Sequencing Industry, consider subscribing to industry newsletters, following relevant companies and organizations, or regularly checking reputable industry news sources and publications.
Methodology
Step 1 - Identification of Relevant Samples Size from Population Database


Step 2 - Approaches for Defining Global Market Size (Value, Volume* & Price*)

Note*: In applicable scenarios
Step 3 - Data Sources
Primary Research
- Web Analytics
- Survey Reports
- Research Institute
- Latest Research Reports
- Opinion Leaders
Secondary Research
- Annual Reports
- White Paper
- Latest Press Release
- Industry Association
- Paid Database
- Investor Presentations

Step 4 - Data Triangulation
Involves using different sources of information in order to increase the validity of a study
These sources are likely to be stakeholders in a program - participants, other researchers, program staff, other community members, and so on.
Then we put all data in single framework & apply various statistical tools to find out the dynamic on the market.
During the analysis stage, feedback from the stakeholder groups would be compared to determine areas of agreement as well as areas of divergence


