
Key Insights
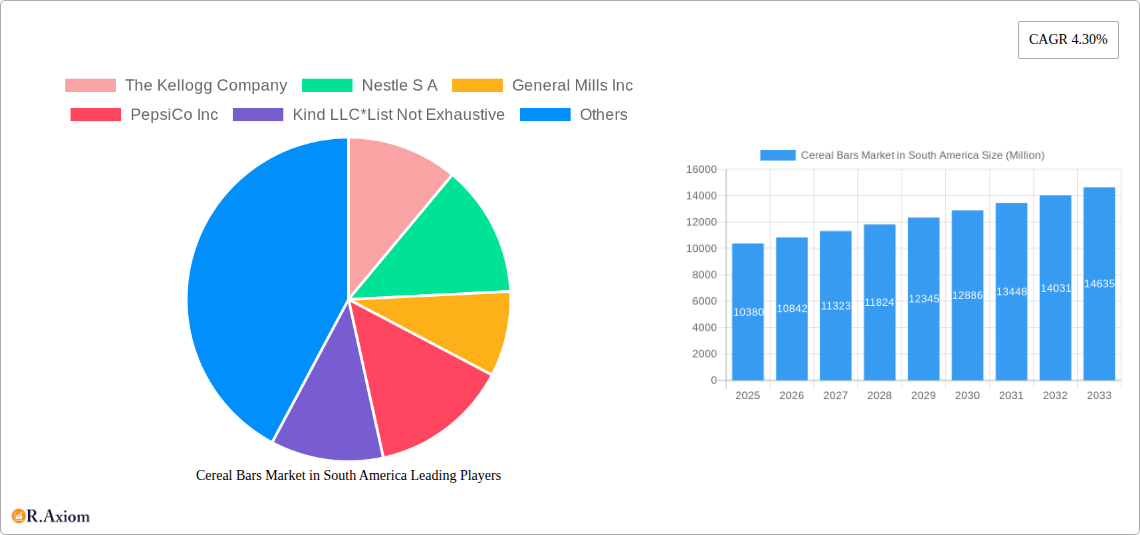
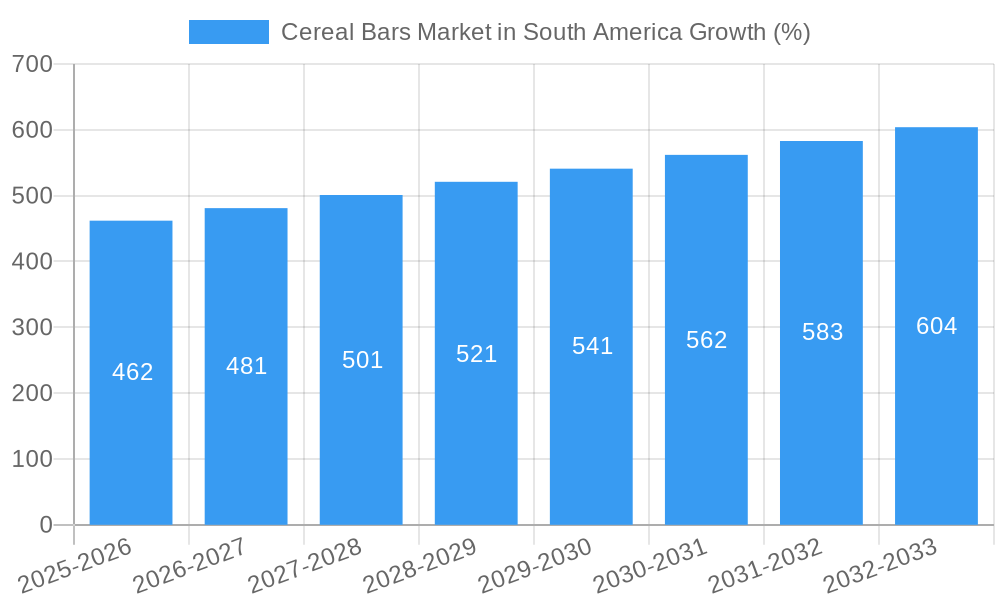
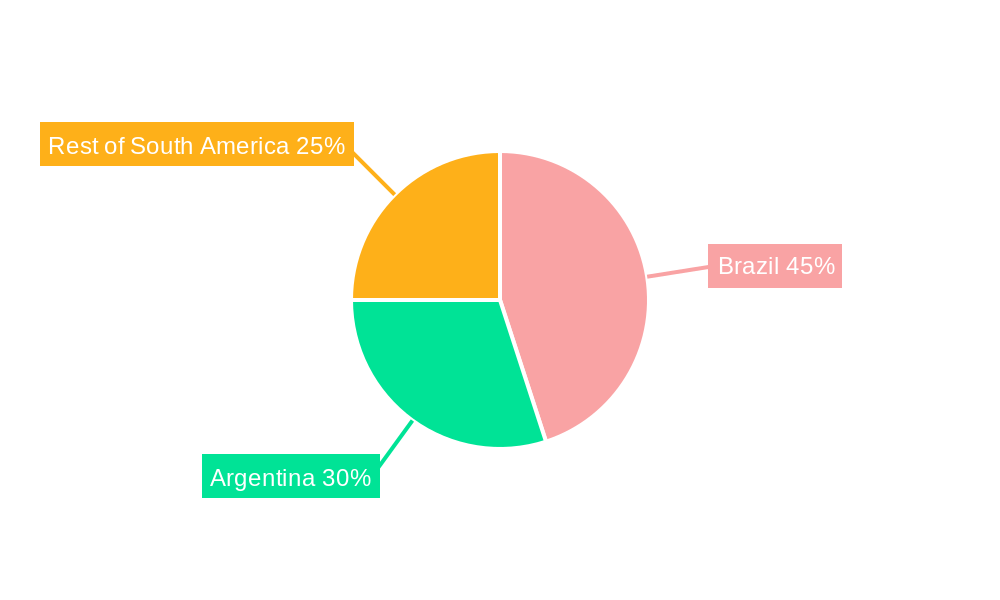
The South American cereal bars market, valued at $10,380 million in 2025, is projected to experience robust growth, driven by increasing health consciousness among consumers and the rising popularity of convenient, on-the-go snacks. The market's Compound Annual Growth Rate (CAGR) of 4.30% from 2025 to 2033 indicates a steady expansion, with significant contributions expected from key segments. Granola/Muesli bars are likely to dominate the product type segment, fueled by their perceived nutritional benefits and versatility. The distribution channel analysis suggests supermarkets/hypermarkets will maintain a significant market share due to their established reach and consumer preference for organized retail. However, the online retail segment is poised for considerable growth, driven by increasing internet penetration and e-commerce adoption across South America. Leading players like Kellogg's, Nestlé, General Mills, and PepsiCo are strategically expanding their product portfolios and distribution networks to capitalize on this market potential. Brazil and Argentina, as the largest economies in South America, are expected to be the key growth drivers, although other South American nations are also witnessing rising demand, fueled by changing lifestyles and increased disposable incomes. Potential restraints could include fluctuating raw material prices and intense competition, requiring companies to focus on innovation, brand building, and strategic pricing to maintain market share.
The market segmentation offers lucrative opportunities for targeted marketing and product development. For example, focusing on specific dietary needs (e.g., gluten-free, vegan) within the product type segment can attract a wider customer base. Similarly, focusing on targeted advertising campaigns through different distribution channels is crucial for maximizing reach and impact. The forecast period (2025-2033) presents a promising outlook, with the market's trajectory expected to be influenced by macroeconomic factors, consumer preferences, and the strategic initiatives of key market players. This necessitates a continuous monitoring of market trends to adapt strategies effectively. Understanding the regional variations in consumption patterns will also be critical for optimizing distribution and marketing efforts.
Cereal Bars Market in South America: A Comprehensive Market Report (2019-2033)
This detailed report provides a comprehensive analysis of the Cereal Bars Market in South America, offering invaluable insights for industry stakeholders, investors, and businesses seeking to navigate this dynamic market. The study covers the period from 2019 to 2033, with 2025 serving as the base year and estimated year. The report leverages extensive market research and data analysis to deliver actionable intelligence, facilitating strategic decision-making and maximizing market opportunities.
The report’s value lies in its granular examination of various segments, key players, and industry trends, providing a 360° view of the South American Cereal Bars market. It incorporates crucial data points such as market size, CAGR, market share, and M&A activity, all presented in a clear, concise, and easily digestible format.
This report is indispensable for anyone involved in, or looking to enter, the vibrant South American Cereal Bars market.
Cereal Bars Market in South America Market Concentration & Innovation
This section analyzes the competitive landscape of the South American cereal bars market, evaluating market concentration, innovation drivers, regulatory frameworks, and industry dynamics. The analysis includes an assessment of market share held by key players such as The Kellogg Company, Nestlé S.A., General Mills Inc., PepsiCo Inc., Kind LLC, Clif Bar & Company, and Mondelez International Inc., amongst others. The market is moderately concentrated, with the top five players accounting for approximately xx% of the total market share in 2025. Innovation is driven by consumer demand for healthier and more convenient snack options, leading to the development of new product lines featuring organic ingredients, added protein, and functional benefits.
- Market Concentration: The Herfindahl-Hirschman Index (HHI) for the South American cereal bars market in 2025 is estimated at xx.
- Innovation Drivers: Increasing consumer awareness of health and wellness, coupled with the growing popularity of on-the-go snacking, fuels innovation in product formulations, packaging, and distribution channels.
- Regulatory Framework: Regulations concerning food labeling, ingredient standards, and health claims significantly impact market dynamics. Specific regulations vary across South American countries.
- Product Substitutes: Other convenient snack options, such as energy bars, protein bars, and fruit snacks, present competitive pressure.
- End-User Trends: The growing demand for healthier snacks with added functional benefits, like high protein or fiber content, is a key trend shaping market growth.
- M&A Activity: The past five years have seen xx M&A deals in the South American cereal bars market, with a total deal value of approximately $xx Million. These deals primarily involve smaller brands being acquired by larger multinational companies aiming to expand their market reach.
Cereal Bars Market in South America Industry Trends & Insights
The South American cereal bars market is experiencing robust growth, fueled by several key factors. Rising disposable incomes, particularly in urban areas, are driving increased consumer spending on convenient and nutritious snack options. The increasing preference for healthy and functional foods is also boosting demand. The market exhibits a strong preference for granola/muesli bars, which currently hold a xx% market share. Technological advancements in food processing and packaging are enhancing product quality, shelf life, and convenience. However, the market also faces challenges, including fluctuating raw material prices and intense competition amongst established and emerging players. The market is expected to witness a Compound Annual Growth Rate (CAGR) of xx% during the forecast period (2025-2033). Market penetration in major urban areas is high, with xx% of households consuming cereal bars regularly, while penetration in rural areas remains relatively lower at xx%.
The competitive landscape is characterized by a mix of multinational corporations and local players. Multinational companies leverage their strong brand recognition and distribution networks to maintain market leadership, while local players focus on offering customized products catering to local tastes and preferences. Consumer preferences are evolving towards healthier options, with a growing focus on organic ingredients, reduced sugar content, and enhanced nutritional profiles.
Dominant Markets & Segments in Cereal Bars Market in South America
Brazil and Argentina represent the dominant markets within South America, accounting for approximately xx% and xx% of the total market value respectively in 2025. This dominance is driven by factors including larger populations, higher disposable incomes, and well-established retail infrastructure. Granola/Muesli bars constitute the largest product segment, capturing xx% of the market share, owing to their perceived health benefits and versatility. Supermarkets/Hypermarkets remain the most prevalent distribution channel, controlling xx% of sales due to their wide reach and established customer base.
- Key Drivers for Brazil:
- Strong economic growth in certain sectors
- Expanding middle class with increased disposable income
- Extensive retail infrastructure
- Key Drivers for Argentina:
- Growing urbanization
- Increased consumer awareness of health and nutrition
- Rising demand for convenient snacking options
- Dominant Product Segment (Granola/Muesli Bars):
- Perceived health benefits
- Versatility in consumption (breakfast, snack, on-the-go)
- Increasing availability of organic and gluten-free variants
- Dominant Distribution Channel (Supermarkets/Hypermarkets):
- Extensive reach and established customer base
- Ability to offer a wider variety of products
- Strong promotional capabilities
Further analysis reveals a growing market share for online retail stores, driven by increasing internet penetration and consumer preference for home delivery. Convenience stores, while holding a smaller market share, demonstrate significant growth potential, especially in urban areas with high foot traffic.
Cereal Bars Market in South America Product Developments
Recent years have witnessed significant innovation in the South American cereal bars market. Product developers are focusing on incorporating healthier ingredients, such as superfoods, whole grains, and nuts, to cater to the increasing health-consciousness among consumers. There is a growing trend towards offering bars with added protein, fiber, and functional benefits, including improved gut health or enhanced energy levels. Companies are also experimenting with novel flavors and textures to enhance product appeal and differentiate their offerings from competitors. This focus on product differentiation and innovation will likely drive further growth in the market.
Report Scope & Segmentation Analysis
This report segments the South American cereal bars market across two key dimensions: product type and distribution channel.
By Product Type:
Granola/Muesli Bars: This segment is projected to exhibit a CAGR of xx% during the forecast period, driven by strong consumer demand for healthy and nutritious snack options. The market is characterized by intense competition, with both established and emerging players vying for market share.
Other Cereal Bars: This segment encompasses a diverse range of products, including fruit and nut bars, chocolate-covered cereal bars, and other variations. This segment is expected to witness a CAGR of xx% over the forecast period, propelled by increasing consumer demand for diverse flavors and textures.
By Distribution Channel:
Supermarkets/Hypermarkets: This channel remains dominant, projected to grow at a CAGR of xx% during the forecast period. The presence of established brands and well-developed distribution networks contributes to the dominance of this channel.
Convenience Stores: This segment is expected to witness significant growth, with a projected CAGR of xx%, driven by increasing urbanization and the growing demand for convenient and readily available snack options.
Online Retail Stores: The online segment is rapidly expanding, with a projected CAGR of xx%, driven by increasing internet penetration and the rising preference for home delivery.
Other Distribution Channels: This includes smaller retailers, specialty stores, and direct-to-consumer sales, showing moderate growth of xx% CAGR.
Key Drivers of Cereal Bars Market in South America Growth
The growth of the South American cereal bars market is propelled by several key factors. Firstly, a rising middle class with increased disposable income is driving consumer demand for convenient and nutritious snacks. Secondly, increasing health consciousness and a preference for healthier lifestyle choices are fueling the demand for cereal bars enriched with vitamins, minerals, and fiber. Thirdly, technological advancements in food processing and packaging are enhancing product quality, shelf life, and convenience, while also expanding product diversity. Finally, improved retail infrastructure and growing online sales channels contribute to the expansion of the market.
Challenges in the Cereal Bars Market in South America Sector
Despite the significant growth potential, the South American cereal bars market faces several challenges. Fluctuations in the prices of key raw materials, such as grains, nuts, and fruits, impact production costs and profitability. Intense competition from established multinational players and smaller local brands creates pressure on pricing and margins. Moreover, stringent regulations concerning food labeling, ingredient standards, and health claims add complexity to product development and market entry. These factors could potentially restrain market growth if not effectively managed. Furthermore, supply chain disruptions, particularly in remote regions, can pose a challenge for manufacturers.
Emerging Opportunities in Cereal Bars Market in South America
The South American cereal bars market presents several exciting emerging opportunities. The rising demand for specialized bars catering to specific dietary needs, such as gluten-free, vegan, and keto-friendly options, creates a significant growth opportunity. The integration of technological advancements in personalized nutrition and functional food products will open new avenues for product innovation and differentiation. Expansion into rural markets with improved distribution networks will tap into a significant untapped consumer base. Finally, leveraging digital marketing and e-commerce platforms to reach a broader customer base offers strong potential for sales growth.
Leading Players in the Cereal Bars Market in South America Market
- The Kellogg Company
- Nestle S.A.
- General Mills Inc.
- PepsiCo Inc.
- Kind LLC
- Clif Bar & Company
- Mondelez International Inc.
Key Developments in Cereal Bars Market in South America Industry
- 2022 Q3: Nestlé S.A. launched a new line of organic cereal bars in Brazil.
- 2023 Q1: General Mills Inc. partnered with a local distributor to expand its reach in Argentina.
- 2024 Q2: PepsiCo Inc. acquired a smaller local cereal bar brand in Colombia.
- 2024 Q4: Kind LLC introduced a new range of protein bars targeting fitness-conscious consumers in Chile.
Strategic Outlook for Cereal Bars Market in South America Market
The South American cereal bars market is poised for sustained growth over the next decade. Continued innovation in product formulations, improved distribution networks, and increased consumer awareness of health and wellness will drive market expansion. Opportunities lie in the development of healthier and more convenient products catering to specific dietary needs, coupled with targeted marketing strategies tailored to local consumer preferences. Embracing technological advancements in product development, packaging, and distribution will be critical for success in this dynamic market. The market is anticipated to demonstrate significant growth, propelled by these factors and evolving consumer trends, making it an attractive investment destination for both existing and new market players.
Cereal Bars Market in South America Segmentation
- 1. Production Analysis
- 2. Consumption Analysis
- 3. Import Market Analysis (Value & Volume)
- 4. Export Market Analysis (Value & Volume)
- 5. Price Trend Analysis
Cereal Bars Market in South America Segmentation By Geography
-
1. North America
- 1.1. United States
- 1.2. Canada
- 1.3. Mexico
-
2. South America
- 2.1. Brazil
- 2.2. Argentina
- 2.3. Rest of South America
-
3. Europe
- 3.1. United Kingdom
- 3.2. Germany
- 3.3. France
- 3.4. Italy
- 3.5. Spain
- 3.6. Russia
- 3.7. Benelux
- 3.8. Nordics
- 3.9. Rest of Europe
-
4. Middle East & Africa
- 4.1. Turkey
- 4.2. Israel
- 4.3. GCC
- 4.4. North Africa
- 4.5. South Africa
- 4.6. Rest of Middle East & Africa
-
5. Asia Pacific
- 5.1. China
- 5.2. India
- 5.3. Japan
- 5.4. South Korea
- 5.5. ASEAN
- 5.6. Oceania
- 5.7. Rest of Asia Pacific
Cereal Bars Market in South America REPORT HIGHLIGHTS
| Aspects | Details |
|---|---|
| Study Period | 2019-2033 |
| Base Year | 2024 |
| Estimated Year | 2025 |
| Forecast Period | 2025-2033 |
| Historical Period | 2019-2024 |
| Growth Rate | CAGR of 4.30% from 2019-2033 |
| Segmentation |
|
Table of Contents
- 1. Introduction
- 1.1. Research Scope
- 1.2. Market Segmentation
- 1.3. Research Methodology
- 1.4. Definitions and Assumptions
- 2. Executive Summary
- 2.1. Introduction
- 3. Market Dynamics
- 3.1. Introduction
- 3.2. Market Drivers
- 3.2.1. Popularity of Convenient Food Products; Expansion of Cold Chain Logistics
- 3.3. Market Restrains
- 3.3.1. Concerns Over Food Safety and Quality
- 3.4. Market Trends
- 3.4.1. Surge In The Consumption Of Healthy Food
- 4. Market Factor Analysis
- 4.1. Porters Five Forces
- 4.2. Supply/Value Chain
- 4.3. PESTEL analysis
- 4.4. Market Entropy
- 4.5. Patent/Trademark Analysis
- 5. Global Cereal Bars Market in South America Analysis, Insights and Forecast, 2019-2031
- 5.1. Market Analysis, Insights and Forecast - by Production Analysis
- 5.2. Market Analysis, Insights and Forecast - by Consumption Analysis
- 5.3. Market Analysis, Insights and Forecast - by Import Market Analysis (Value & Volume)
- 5.4. Market Analysis, Insights and Forecast - by Export Market Analysis (Value & Volume)
- 5.5. Market Analysis, Insights and Forecast - by Price Trend Analysis
- 5.6. Market Analysis, Insights and Forecast - by Region
- 5.6.1. North America
- 5.6.2. South America
- 5.6.3. Europe
- 5.6.4. Middle East & Africa
- 5.6.5. Asia Pacific
- 5.1. Market Analysis, Insights and Forecast - by Production Analysis
- 6. North America Cereal Bars Market in South America Analysis, Insights and Forecast, 2019-2031
- 6.1. Market Analysis, Insights and Forecast - by Production Analysis
- 6.2. Market Analysis, Insights and Forecast - by Consumption Analysis
- 6.3. Market Analysis, Insights and Forecast - by Import Market Analysis (Value & Volume)
- 6.4. Market Analysis, Insights and Forecast - by Export Market Analysis (Value & Volume)
- 6.5. Market Analysis, Insights and Forecast - by Price Trend Analysis
- 6.1. Market Analysis, Insights and Forecast - by Production Analysis
- 7. South America Cereal Bars Market in South America Analysis, Insights and Forecast, 2019-2031
- 7.1. Market Analysis, Insights and Forecast - by Production Analysis
- 7.2. Market Analysis, Insights and Forecast - by Consumption Analysis
- 7.3. Market Analysis, Insights and Forecast - by Import Market Analysis (Value & Volume)
- 7.4. Market Analysis, Insights and Forecast - by Export Market Analysis (Value & Volume)
- 7.5. Market Analysis, Insights and Forecast - by Price Trend Analysis
- 7.1. Market Analysis, Insights and Forecast - by Production Analysis
- 8. Europe Cereal Bars Market in South America Analysis, Insights and Forecast, 2019-2031
- 8.1. Market Analysis, Insights and Forecast - by Production Analysis
- 8.2. Market Analysis, Insights and Forecast - by Consumption Analysis
- 8.3. Market Analysis, Insights and Forecast - by Import Market Analysis (Value & Volume)
- 8.4. Market Analysis, Insights and Forecast - by Export Market Analysis (Value & Volume)
- 8.5. Market Analysis, Insights and Forecast - by Price Trend Analysis
- 8.1. Market Analysis, Insights and Forecast - by Production Analysis
- 9. Middle East & Africa Cereal Bars Market in South America Analysis, Insights and Forecast, 2019-2031
- 9.1. Market Analysis, Insights and Forecast - by Production Analysis
- 9.2. Market Analysis, Insights and Forecast - by Consumption Analysis
- 9.3. Market Analysis, Insights and Forecast - by Import Market Analysis (Value & Volume)
- 9.4. Market Analysis, Insights and Forecast - by Export Market Analysis (Value & Volume)
- 9.5. Market Analysis, Insights and Forecast - by Price Trend Analysis
- 9.1. Market Analysis, Insights and Forecast - by Production Analysis
- 10. Asia Pacific Cereal Bars Market in South America Analysis, Insights and Forecast, 2019-2031
- 10.1. Market Analysis, Insights and Forecast - by Production Analysis
- 10.2. Market Analysis, Insights and Forecast - by Consumption Analysis
- 10.3. Market Analysis, Insights and Forecast - by Import Market Analysis (Value & Volume)
- 10.4. Market Analysis, Insights and Forecast - by Export Market Analysis (Value & Volume)
- 10.5. Market Analysis, Insights and Forecast - by Price Trend Analysis
- 10.1. Market Analysis, Insights and Forecast - by Production Analysis
- 11. Brazil Cereal Bars Market in South America Analysis, Insights and Forecast, 2019-2031
- 12. Argentina Cereal Bars Market in South America Analysis, Insights and Forecast, 2019-2031
- 13. Rest of South America Cereal Bars Market in South America Analysis, Insights and Forecast, 2019-2031
- 14. Competitive Analysis
- 14.1. Global Market Share Analysis 2024
- 14.2. Company Profiles
- 14.2.1 The Kellogg Company
- 14.2.1.1. Overview
- 14.2.1.2. Products
- 14.2.1.3. SWOT Analysis
- 14.2.1.4. Recent Developments
- 14.2.1.5. Financials (Based on Availability)
- 14.2.2 Nestle S A
- 14.2.2.1. Overview
- 14.2.2.2. Products
- 14.2.2.3. SWOT Analysis
- 14.2.2.4. Recent Developments
- 14.2.2.5. Financials (Based on Availability)
- 14.2.3 General Mills Inc
- 14.2.3.1. Overview
- 14.2.3.2. Products
- 14.2.3.3. SWOT Analysis
- 14.2.3.4. Recent Developments
- 14.2.3.5. Financials (Based on Availability)
- 14.2.4 PepsiCo Inc
- 14.2.4.1. Overview
- 14.2.4.2. Products
- 14.2.4.3. SWOT Analysis
- 14.2.4.4. Recent Developments
- 14.2.4.5. Financials (Based on Availability)
- 14.2.5 Kind LLC*List Not Exhaustive
- 14.2.5.1. Overview
- 14.2.5.2. Products
- 14.2.5.3. SWOT Analysis
- 14.2.5.4. Recent Developments
- 14.2.5.5. Financials (Based on Availability)
- 14.2.6 Clif Bar & Company
- 14.2.6.1. Overview
- 14.2.6.2. Products
- 14.2.6.3. SWOT Analysis
- 14.2.6.4. Recent Developments
- 14.2.6.5. Financials (Based on Availability)
- 14.2.7 Mondelez International Inc
- 14.2.7.1. Overview
- 14.2.7.2. Products
- 14.2.7.3. SWOT Analysis
- 14.2.7.4. Recent Developments
- 14.2.7.5. Financials (Based on Availability)
- 14.2.1 The Kellogg Company
List of Figures
- Figure 1: Global Cereal Bars Market in South America Revenue Breakdown (Million, %) by Region 2024 & 2032
- Figure 2: Global Cereal Bars Market in South America Volume Breakdown (K Units, %) by Region 2024 & 2032
- Figure 3: South America Cereal Bars Market in South America Revenue (Million), by Country 2024 & 2032
- Figure 4: South America Cereal Bars Market in South America Volume (K Units), by Country 2024 & 2032
- Figure 5: South America Cereal Bars Market in South America Revenue Share (%), by Country 2024 & 2032
- Figure 6: South America Cereal Bars Market in South America Volume Share (%), by Country 2024 & 2032
- Figure 7: North America Cereal Bars Market in South America Revenue (Million), by Production Analysis 2024 & 2032
- Figure 8: North America Cereal Bars Market in South America Volume (K Units), by Production Analysis 2024 & 2032
- Figure 9: North America Cereal Bars Market in South America Revenue Share (%), by Production Analysis 2024 & 2032
- Figure 10: North America Cereal Bars Market in South America Volume Share (%), by Production Analysis 2024 & 2032
- Figure 11: North America Cereal Bars Market in South America Revenue (Million), by Consumption Analysis 2024 & 2032
- Figure 12: North America Cereal Bars Market in South America Volume (K Units), by Consumption Analysis 2024 & 2032
- Figure 13: North America Cereal Bars Market in South America Revenue Share (%), by Consumption Analysis 2024 & 2032
- Figure 14: North America Cereal Bars Market in South America Volume Share (%), by Consumption Analysis 2024 & 2032
- Figure 15: North America Cereal Bars Market in South America Revenue (Million), by Import Market Analysis (Value & Volume) 2024 & 2032
- Figure 16: North America Cereal Bars Market in South America Volume (K Units), by Import Market Analysis (Value & Volume) 2024 & 2032
- Figure 17: North America Cereal Bars Market in South America Revenue Share (%), by Import Market Analysis (Value & Volume) 2024 & 2032
- Figure 18: North America Cereal Bars Market in South America Volume Share (%), by Import Market Analysis (Value & Volume) 2024 & 2032
- Figure 19: North America Cereal Bars Market in South America Revenue (Million), by Export Market Analysis (Value & Volume) 2024 & 2032
- Figure 20: North America Cereal Bars Market in South America Volume (K Units), by Export Market Analysis (Value & Volume) 2024 & 2032
- Figure 21: North America Cereal Bars Market in South America Revenue Share (%), by Export Market Analysis (Value & Volume) 2024 & 2032
- Figure 22: North America Cereal Bars Market in South America Volume Share (%), by Export Market Analysis (Value & Volume) 2024 & 2032
- Figure 23: North America Cereal Bars Market in South America Revenue (Million), by Price Trend Analysis 2024 & 2032
- Figure 24: North America Cereal Bars Market in South America Volume (K Units), by Price Trend Analysis 2024 & 2032
- Figure 25: North America Cereal Bars Market in South America Revenue Share (%), by Price Trend Analysis 2024 & 2032
- Figure 26: North America Cereal Bars Market in South America Volume Share (%), by Price Trend Analysis 2024 & 2032
- Figure 27: North America Cereal Bars Market in South America Revenue (Million), by Country 2024 & 2032
- Figure 28: North America Cereal Bars Market in South America Volume (K Units), by Country 2024 & 2032
- Figure 29: North America Cereal Bars Market in South America Revenue Share (%), by Country 2024 & 2032
- Figure 30: North America Cereal Bars Market in South America Volume Share (%), by Country 2024 & 2032
- Figure 31: South America Cereal Bars Market in South America Revenue (Million), by Production Analysis 2024 & 2032
- Figure 32: South America Cereal Bars Market in South America Volume (K Units), by Production Analysis 2024 & 2032
- Figure 33: South America Cereal Bars Market in South America Revenue Share (%), by Production Analysis 2024 & 2032
- Figure 34: South America Cereal Bars Market in South America Volume Share (%), by Production Analysis 2024 & 2032
- Figure 35: South America Cereal Bars Market in South America Revenue (Million), by Consumption Analysis 2024 & 2032
- Figure 36: South America Cereal Bars Market in South America Volume (K Units), by Consumption Analysis 2024 & 2032
- Figure 37: South America Cereal Bars Market in South America Revenue Share (%), by Consumption Analysis 2024 & 2032
- Figure 38: South America Cereal Bars Market in South America Volume Share (%), by Consumption Analysis 2024 & 2032
- Figure 39: South America Cereal Bars Market in South America Revenue (Million), by Import Market Analysis (Value & Volume) 2024 & 2032
- Figure 40: South America Cereal Bars Market in South America Volume (K Units), by Import Market Analysis (Value & Volume) 2024 & 2032
- Figure 41: South America Cereal Bars Market in South America Revenue Share (%), by Import Market Analysis (Value & Volume) 2024 & 2032
- Figure 42: South America Cereal Bars Market in South America Volume Share (%), by Import Market Analysis (Value & Volume) 2024 & 2032
- Figure 43: South America Cereal Bars Market in South America Revenue (Million), by Export Market Analysis (Value & Volume) 2024 & 2032
- Figure 44: South America Cereal Bars Market in South America Volume (K Units), by Export Market Analysis (Value & Volume) 2024 & 2032
- Figure 45: South America Cereal Bars Market in South America Revenue Share (%), by Export Market Analysis (Value & Volume) 2024 & 2032
- Figure 46: South America Cereal Bars Market in South America Volume Share (%), by Export Market Analysis (Value & Volume) 2024 & 2032
- Figure 47: South America Cereal Bars Market in South America Revenue (Million), by Price Trend Analysis 2024 & 2032
- Figure 48: South America Cereal Bars Market in South America Volume (K Units), by Price Trend Analysis 2024 & 2032
- Figure 49: South America Cereal Bars Market in South America Revenue Share (%), by Price Trend Analysis 2024 & 2032
- Figure 50: South America Cereal Bars Market in South America Volume Share (%), by Price Trend Analysis 2024 & 2032
- Figure 51: South America Cereal Bars Market in South America Revenue (Million), by Country 2024 & 2032
- Figure 52: South America Cereal Bars Market in South America Volume (K Units), by Country 2024 & 2032
- Figure 53: South America Cereal Bars Market in South America Revenue Share (%), by Country 2024 & 2032
- Figure 54: South America Cereal Bars Market in South America Volume Share (%), by Country 2024 & 2032
- Figure 55: Europe Cereal Bars Market in South America Revenue (Million), by Production Analysis 2024 & 2032
- Figure 56: Europe Cereal Bars Market in South America Volume (K Units), by Production Analysis 2024 & 2032
- Figure 57: Europe Cereal Bars Market in South America Revenue Share (%), by Production Analysis 2024 & 2032
- Figure 58: Europe Cereal Bars Market in South America Volume Share (%), by Production Analysis 2024 & 2032
- Figure 59: Europe Cereal Bars Market in South America Revenue (Million), by Consumption Analysis 2024 & 2032
- Figure 60: Europe Cereal Bars Market in South America Volume (K Units), by Consumption Analysis 2024 & 2032
- Figure 61: Europe Cereal Bars Market in South America Revenue Share (%), by Consumption Analysis 2024 & 2032
- Figure 62: Europe Cereal Bars Market in South America Volume Share (%), by Consumption Analysis 2024 & 2032
- Figure 63: Europe Cereal Bars Market in South America Revenue (Million), by Import Market Analysis (Value & Volume) 2024 & 2032
- Figure 64: Europe Cereal Bars Market in South America Volume (K Units), by Import Market Analysis (Value & Volume) 2024 & 2032
- Figure 65: Europe Cereal Bars Market in South America Revenue Share (%), by Import Market Analysis (Value & Volume) 2024 & 2032
- Figure 66: Europe Cereal Bars Market in South America Volume Share (%), by Import Market Analysis (Value & Volume) 2024 & 2032
- Figure 67: Europe Cereal Bars Market in South America Revenue (Million), by Export Market Analysis (Value & Volume) 2024 & 2032
- Figure 68: Europe Cereal Bars Market in South America Volume (K Units), by Export Market Analysis (Value & Volume) 2024 & 2032
- Figure 69: Europe Cereal Bars Market in South America Revenue Share (%), by Export Market Analysis (Value & Volume) 2024 & 2032
- Figure 70: Europe Cereal Bars Market in South America Volume Share (%), by Export Market Analysis (Value & Volume) 2024 & 2032
- Figure 71: Europe Cereal Bars Market in South America Revenue (Million), by Price Trend Analysis 2024 & 2032
- Figure 72: Europe Cereal Bars Market in South America Volume (K Units), by Price Trend Analysis 2024 & 2032
- Figure 73: Europe Cereal Bars Market in South America Revenue Share (%), by Price Trend Analysis 2024 & 2032
- Figure 74: Europe Cereal Bars Market in South America Volume Share (%), by Price Trend Analysis 2024 & 2032
- Figure 75: Europe Cereal Bars Market in South America Revenue (Million), by Country 2024 & 2032
- Figure 76: Europe Cereal Bars Market in South America Volume (K Units), by Country 2024 & 2032
- Figure 77: Europe Cereal Bars Market in South America Revenue Share (%), by Country 2024 & 2032
- Figure 78: Europe Cereal Bars Market in South America Volume Share (%), by Country 2024 & 2032
- Figure 79: Middle East & Africa Cereal Bars Market in South America Revenue (Million), by Production Analysis 2024 & 2032
- Figure 80: Middle East & Africa Cereal Bars Market in South America Volume (K Units), by Production Analysis 2024 & 2032
- Figure 81: Middle East & Africa Cereal Bars Market in South America Revenue Share (%), by Production Analysis 2024 & 2032
- Figure 82: Middle East & Africa Cereal Bars Market in South America Volume Share (%), by Production Analysis 2024 & 2032
- Figure 83: Middle East & Africa Cereal Bars Market in South America Revenue (Million), by Consumption Analysis 2024 & 2032
- Figure 84: Middle East & Africa Cereal Bars Market in South America Volume (K Units), by Consumption Analysis 2024 & 2032
- Figure 85: Middle East & Africa Cereal Bars Market in South America Revenue Share (%), by Consumption Analysis 2024 & 2032
- Figure 86: Middle East & Africa Cereal Bars Market in South America Volume Share (%), by Consumption Analysis 2024 & 2032
- Figure 87: Middle East & Africa Cereal Bars Market in South America Revenue (Million), by Import Market Analysis (Value & Volume) 2024 & 2032
- Figure 88: Middle East & Africa Cereal Bars Market in South America Volume (K Units), by Import Market Analysis (Value & Volume) 2024 & 2032
- Figure 89: Middle East & Africa Cereal Bars Market in South America Revenue Share (%), by Import Market Analysis (Value & Volume) 2024 & 2032
- Figure 90: Middle East & Africa Cereal Bars Market in South America Volume Share (%), by Import Market Analysis (Value & Volume) 2024 & 2032
- Figure 91: Middle East & Africa Cereal Bars Market in South America Revenue (Million), by Export Market Analysis (Value & Volume) 2024 & 2032
- Figure 92: Middle East & Africa Cereal Bars Market in South America Volume (K Units), by Export Market Analysis (Value & Volume) 2024 & 2032
- Figure 93: Middle East & Africa Cereal Bars Market in South America Revenue Share (%), by Export Market Analysis (Value & Volume) 2024 & 2032
- Figure 94: Middle East & Africa Cereal Bars Market in South America Volume Share (%), by Export Market Analysis (Value & Volume) 2024 & 2032
- Figure 95: Middle East & Africa Cereal Bars Market in South America Revenue (Million), by Price Trend Analysis 2024 & 2032
- Figure 96: Middle East & Africa Cereal Bars Market in South America Volume (K Units), by Price Trend Analysis 2024 & 2032
- Figure 97: Middle East & Africa Cereal Bars Market in South America Revenue Share (%), by Price Trend Analysis 2024 & 2032
- Figure 98: Middle East & Africa Cereal Bars Market in South America Volume Share (%), by Price Trend Analysis 2024 & 2032
- Figure 99: Middle East & Africa Cereal Bars Market in South America Revenue (Million), by Country 2024 & 2032
- Figure 100: Middle East & Africa Cereal Bars Market in South America Volume (K Units), by Country 2024 & 2032
- Figure 101: Middle East & Africa Cereal Bars Market in South America Revenue Share (%), by Country 2024 & 2032
- Figure 102: Middle East & Africa Cereal Bars Market in South America Volume Share (%), by Country 2024 & 2032
- Figure 103: Asia Pacific Cereal Bars Market in South America Revenue (Million), by Production Analysis 2024 & 2032
- Figure 104: Asia Pacific Cereal Bars Market in South America Volume (K Units), by Production Analysis 2024 & 2032
- Figure 105: Asia Pacific Cereal Bars Market in South America Revenue Share (%), by Production Analysis 2024 & 2032
- Figure 106: Asia Pacific Cereal Bars Market in South America Volume Share (%), by Production Analysis 2024 & 2032
- Figure 107: Asia Pacific Cereal Bars Market in South America Revenue (Million), by Consumption Analysis 2024 & 2032
- Figure 108: Asia Pacific Cereal Bars Market in South America Volume (K Units), by Consumption Analysis 2024 & 2032
- Figure 109: Asia Pacific Cereal Bars Market in South America Revenue Share (%), by Consumption Analysis 2024 & 2032
- Figure 110: Asia Pacific Cereal Bars Market in South America Volume Share (%), by Consumption Analysis 2024 & 2032
- Figure 111: Asia Pacific Cereal Bars Market in South America Revenue (Million), by Import Market Analysis (Value & Volume) 2024 & 2032
- Figure 112: Asia Pacific Cereal Bars Market in South America Volume (K Units), by Import Market Analysis (Value & Volume) 2024 & 2032
- Figure 113: Asia Pacific Cereal Bars Market in South America Revenue Share (%), by Import Market Analysis (Value & Volume) 2024 & 2032
- Figure 114: Asia Pacific Cereal Bars Market in South America Volume Share (%), by Import Market Analysis (Value & Volume) 2024 & 2032
- Figure 115: Asia Pacific Cereal Bars Market in South America Revenue (Million), by Export Market Analysis (Value & Volume) 2024 & 2032
- Figure 116: Asia Pacific Cereal Bars Market in South America Volume (K Units), by Export Market Analysis (Value & Volume) 2024 & 2032
- Figure 117: Asia Pacific Cereal Bars Market in South America Revenue Share (%), by Export Market Analysis (Value & Volume) 2024 & 2032
- Figure 118: Asia Pacific Cereal Bars Market in South America Volume Share (%), by Export Market Analysis (Value & Volume) 2024 & 2032
- Figure 119: Asia Pacific Cereal Bars Market in South America Revenue (Million), by Price Trend Analysis 2024 & 2032
- Figure 120: Asia Pacific Cereal Bars Market in South America Volume (K Units), by Price Trend Analysis 2024 & 2032
- Figure 121: Asia Pacific Cereal Bars Market in South America Revenue Share (%), by Price Trend Analysis 2024 & 2032
- Figure 122: Asia Pacific Cereal Bars Market in South America Volume Share (%), by Price Trend Analysis 2024 & 2032
- Figure 123: Asia Pacific Cereal Bars Market in South America Revenue (Million), by Country 2024 & 2032
- Figure 124: Asia Pacific Cereal Bars Market in South America Volume (K Units), by Country 2024 & 2032
- Figure 125: Asia Pacific Cereal Bars Market in South America Revenue Share (%), by Country 2024 & 2032
- Figure 126: Asia Pacific Cereal Bars Market in South America Volume Share (%), by Country 2024 & 2032
List of Tables
- Table 1: Global Cereal Bars Market in South America Revenue Million Forecast, by Region 2019 & 2032
- Table 2: Global Cereal Bars Market in South America Volume K Units Forecast, by Region 2019 & 2032
- Table 3: Global Cereal Bars Market in South America Revenue Million Forecast, by Production Analysis 2019 & 2032
- Table 4: Global Cereal Bars Market in South America Volume K Units Forecast, by Production Analysis 2019 & 2032
- Table 5: Global Cereal Bars Market in South America Revenue Million Forecast, by Consumption Analysis 2019 & 2032
- Table 6: Global Cereal Bars Market in South America Volume K Units Forecast, by Consumption Analysis 2019 & 2032
- Table 7: Global Cereal Bars Market in South America Revenue Million Forecast, by Import Market Analysis (Value & Volume) 2019 & 2032
- Table 8: Global Cereal Bars Market in South America Volume K Units Forecast, by Import Market Analysis (Value & Volume) 2019 & 2032
- Table 9: Global Cereal Bars Market in South America Revenue Million Forecast, by Export Market Analysis (Value & Volume) 2019 & 2032
- Table 10: Global Cereal Bars Market in South America Volume K Units Forecast, by Export Market Analysis (Value & Volume) 2019 & 2032
- Table 11: Global Cereal Bars Market in South America Revenue Million Forecast, by Price Trend Analysis 2019 & 2032
- Table 12: Global Cereal Bars Market in South America Volume K Units Forecast, by Price Trend Analysis 2019 & 2032
- Table 13: Global Cereal Bars Market in South America Revenue Million Forecast, by Region 2019 & 2032
- Table 14: Global Cereal Bars Market in South America Volume K Units Forecast, by Region 2019 & 2032
- Table 15: Global Cereal Bars Market in South America Revenue Million Forecast, by Country 2019 & 2032
- Table 16: Global Cereal Bars Market in South America Volume K Units Forecast, by Country 2019 & 2032
- Table 17: Brazil Cereal Bars Market in South America Revenue (Million) Forecast, by Application 2019 & 2032
- Table 18: Brazil Cereal Bars Market in South America Volume (K Units) Forecast, by Application 2019 & 2032
- Table 19: Argentina Cereal Bars Market in South America Revenue (Million) Forecast, by Application 2019 & 2032
- Table 20: Argentina Cereal Bars Market in South America Volume (K Units) Forecast, by Application 2019 & 2032
- Table 21: Rest of South America Cereal Bars Market in South America Revenue (Million) Forecast, by Application 2019 & 2032
- Table 22: Rest of South America Cereal Bars Market in South America Volume (K Units) Forecast, by Application 2019 & 2032
- Table 23: Global Cereal Bars Market in South America Revenue Million Forecast, by Production Analysis 2019 & 2032
- Table 24: Global Cereal Bars Market in South America Volume K Units Forecast, by Production Analysis 2019 & 2032
- Table 25: Global Cereal Bars Market in South America Revenue Million Forecast, by Consumption Analysis 2019 & 2032
- Table 26: Global Cereal Bars Market in South America Volume K Units Forecast, by Consumption Analysis 2019 & 2032
- Table 27: Global Cereal Bars Market in South America Revenue Million Forecast, by Import Market Analysis (Value & Volume) 2019 & 2032
- Table 28: Global Cereal Bars Market in South America Volume K Units Forecast, by Import Market Analysis (Value & Volume) 2019 & 2032
- Table 29: Global Cereal Bars Market in South America Revenue Million Forecast, by Export Market Analysis (Value & Volume) 2019 & 2032
- Table 30: Global Cereal Bars Market in South America Volume K Units Forecast, by Export Market Analysis (Value & Volume) 2019 & 2032
- Table 31: Global Cereal Bars Market in South America Revenue Million Forecast, by Price Trend Analysis 2019 & 2032
- Table 32: Global Cereal Bars Market in South America Volume K Units Forecast, by Price Trend Analysis 2019 & 2032
- Table 33: Global Cereal Bars Market in South America Revenue Million Forecast, by Country 2019 & 2032
- Table 34: Global Cereal Bars Market in South America Volume K Units Forecast, by Country 2019 & 2032
- Table 35: United States Cereal Bars Market in South America Revenue (Million) Forecast, by Application 2019 & 2032
- Table 36: United States Cereal Bars Market in South America Volume (K Units) Forecast, by Application 2019 & 2032
- Table 37: Canada Cereal Bars Market in South America Revenue (Million) Forecast, by Application 2019 & 2032
- Table 38: Canada Cereal Bars Market in South America Volume (K Units) Forecast, by Application 2019 & 2032
- Table 39: Mexico Cereal Bars Market in South America Revenue (Million) Forecast, by Application 2019 & 2032
- Table 40: Mexico Cereal Bars Market in South America Volume (K Units) Forecast, by Application 2019 & 2032
- Table 41: Global Cereal Bars Market in South America Revenue Million Forecast, by Production Analysis 2019 & 2032
- Table 42: Global Cereal Bars Market in South America Volume K Units Forecast, by Production Analysis 2019 & 2032
- Table 43: Global Cereal Bars Market in South America Revenue Million Forecast, by Consumption Analysis 2019 & 2032
- Table 44: Global Cereal Bars Market in South America Volume K Units Forecast, by Consumption Analysis 2019 & 2032
- Table 45: Global Cereal Bars Market in South America Revenue Million Forecast, by Import Market Analysis (Value & Volume) 2019 & 2032
- Table 46: Global Cereal Bars Market in South America Volume K Units Forecast, by Import Market Analysis (Value & Volume) 2019 & 2032
- Table 47: Global Cereal Bars Market in South America Revenue Million Forecast, by Export Market Analysis (Value & Volume) 2019 & 2032
- Table 48: Global Cereal Bars Market in South America Volume K Units Forecast, by Export Market Analysis (Value & Volume) 2019 & 2032
- Table 49: Global Cereal Bars Market in South America Revenue Million Forecast, by Price Trend Analysis 2019 & 2032
- Table 50: Global Cereal Bars Market in South America Volume K Units Forecast, by Price Trend Analysis 2019 & 2032
- Table 51: Global Cereal Bars Market in South America Revenue Million Forecast, by Country 2019 & 2032
- Table 52: Global Cereal Bars Market in South America Volume K Units Forecast, by Country 2019 & 2032
- Table 53: Brazil Cereal Bars Market in South America Revenue (Million) Forecast, by Application 2019 & 2032
- Table 54: Brazil Cereal Bars Market in South America Volume (K Units) Forecast, by Application 2019 & 2032
- Table 55: Argentina Cereal Bars Market in South America Revenue (Million) Forecast, by Application 2019 & 2032
- Table 56: Argentina Cereal Bars Market in South America Volume (K Units) Forecast, by Application 2019 & 2032
- Table 57: Rest of South America Cereal Bars Market in South America Revenue (Million) Forecast, by Application 2019 & 2032
- Table 58: Rest of South America Cereal Bars Market in South America Volume (K Units) Forecast, by Application 2019 & 2032
- Table 59: Global Cereal Bars Market in South America Revenue Million Forecast, by Production Analysis 2019 & 2032
- Table 60: Global Cereal Bars Market in South America Volume K Units Forecast, by Production Analysis 2019 & 2032
- Table 61: Global Cereal Bars Market in South America Revenue Million Forecast, by Consumption Analysis 2019 & 2032
- Table 62: Global Cereal Bars Market in South America Volume K Units Forecast, by Consumption Analysis 2019 & 2032
- Table 63: Global Cereal Bars Market in South America Revenue Million Forecast, by Import Market Analysis (Value & Volume) 2019 & 2032
- Table 64: Global Cereal Bars Market in South America Volume K Units Forecast, by Import Market Analysis (Value & Volume) 2019 & 2032
- Table 65: Global Cereal Bars Market in South America Revenue Million Forecast, by Export Market Analysis (Value & Volume) 2019 & 2032
- Table 66: Global Cereal Bars Market in South America Volume K Units Forecast, by Export Market Analysis (Value & Volume) 2019 & 2032
- Table 67: Global Cereal Bars Market in South America Revenue Million Forecast, by Price Trend Analysis 2019 & 2032
- Table 68: Global Cereal Bars Market in South America Volume K Units Forecast, by Price Trend Analysis 2019 & 2032
- Table 69: Global Cereal Bars Market in South America Revenue Million Forecast, by Country 2019 & 2032
- Table 70: Global Cereal Bars Market in South America Volume K Units Forecast, by Country 2019 & 2032
- Table 71: United Kingdom Cereal Bars Market in South America Revenue (Million) Forecast, by Application 2019 & 2032
- Table 72: United Kingdom Cereal Bars Market in South America Volume (K Units) Forecast, by Application 2019 & 2032
- Table 73: Germany Cereal Bars Market in South America Revenue (Million) Forecast, by Application 2019 & 2032
- Table 74: Germany Cereal Bars Market in South America Volume (K Units) Forecast, by Application 2019 & 2032
- Table 75: France Cereal Bars Market in South America Revenue (Million) Forecast, by Application 2019 & 2032
- Table 76: France Cereal Bars Market in South America Volume (K Units) Forecast, by Application 2019 & 2032
- Table 77: Italy Cereal Bars Market in South America Revenue (Million) Forecast, by Application 2019 & 2032
- Table 78: Italy Cereal Bars Market in South America Volume (K Units) Forecast, by Application 2019 & 2032
- Table 79: Spain Cereal Bars Market in South America Revenue (Million) Forecast, by Application 2019 & 2032
- Table 80: Spain Cereal Bars Market in South America Volume (K Units) Forecast, by Application 2019 & 2032
- Table 81: Russia Cereal Bars Market in South America Revenue (Million) Forecast, by Application 2019 & 2032
- Table 82: Russia Cereal Bars Market in South America Volume (K Units) Forecast, by Application 2019 & 2032
- Table 83: Benelux Cereal Bars Market in South America Revenue (Million) Forecast, by Application 2019 & 2032
- Table 84: Benelux Cereal Bars Market in South America Volume (K Units) Forecast, by Application 2019 & 2032
- Table 85: Nordics Cereal Bars Market in South America Revenue (Million) Forecast, by Application 2019 & 2032
- Table 86: Nordics Cereal Bars Market in South America Volume (K Units) Forecast, by Application 2019 & 2032
- Table 87: Rest of Europe Cereal Bars Market in South America Revenue (Million) Forecast, by Application 2019 & 2032
- Table 88: Rest of Europe Cereal Bars Market in South America Volume (K Units) Forecast, by Application 2019 & 2032
- Table 89: Global Cereal Bars Market in South America Revenue Million Forecast, by Production Analysis 2019 & 2032
- Table 90: Global Cereal Bars Market in South America Volume K Units Forecast, by Production Analysis 2019 & 2032
- Table 91: Global Cereal Bars Market in South America Revenue Million Forecast, by Consumption Analysis 2019 & 2032
- Table 92: Global Cereal Bars Market in South America Volume K Units Forecast, by Consumption Analysis 2019 & 2032
- Table 93: Global Cereal Bars Market in South America Revenue Million Forecast, by Import Market Analysis (Value & Volume) 2019 & 2032
- Table 94: Global Cereal Bars Market in South America Volume K Units Forecast, by Import Market Analysis (Value & Volume) 2019 & 2032
- Table 95: Global Cereal Bars Market in South America Revenue Million Forecast, by Export Market Analysis (Value & Volume) 2019 & 2032
- Table 96: Global Cereal Bars Market in South America Volume K Units Forecast, by Export Market Analysis (Value & Volume) 2019 & 2032
- Table 97: Global Cereal Bars Market in South America Revenue Million Forecast, by Price Trend Analysis 2019 & 2032
- Table 98: Global Cereal Bars Market in South America Volume K Units Forecast, by Price Trend Analysis 2019 & 2032
- Table 99: Global Cereal Bars Market in South America Revenue Million Forecast, by Country 2019 & 2032
- Table 100: Global Cereal Bars Market in South America Volume K Units Forecast, by Country 2019 & 2032
- Table 101: Turkey Cereal Bars Market in South America Revenue (Million) Forecast, by Application 2019 & 2032
- Table 102: Turkey Cereal Bars Market in South America Volume (K Units) Forecast, by Application 2019 & 2032
- Table 103: Israel Cereal Bars Market in South America Revenue (Million) Forecast, by Application 2019 & 2032
- Table 104: Israel Cereal Bars Market in South America Volume (K Units) Forecast, by Application 2019 & 2032
- Table 105: GCC Cereal Bars Market in South America Revenue (Million) Forecast, by Application 2019 & 2032
- Table 106: GCC Cereal Bars Market in South America Volume (K Units) Forecast, by Application 2019 & 2032
- Table 107: North Africa Cereal Bars Market in South America Revenue (Million) Forecast, by Application 2019 & 2032
- Table 108: North Africa Cereal Bars Market in South America Volume (K Units) Forecast, by Application 2019 & 2032
- Table 109: South Africa Cereal Bars Market in South America Revenue (Million) Forecast, by Application 2019 & 2032
- Table 110: South Africa Cereal Bars Market in South America Volume (K Units) Forecast, by Application 2019 & 2032
- Table 111: Rest of Middle East & Africa Cereal Bars Market in South America Revenue (Million) Forecast, by Application 2019 & 2032
- Table 112: Rest of Middle East & Africa Cereal Bars Market in South America Volume (K Units) Forecast, by Application 2019 & 2032
- Table 113: Global Cereal Bars Market in South America Revenue Million Forecast, by Production Analysis 2019 & 2032
- Table 114: Global Cereal Bars Market in South America Volume K Units Forecast, by Production Analysis 2019 & 2032
- Table 115: Global Cereal Bars Market in South America Revenue Million Forecast, by Consumption Analysis 2019 & 2032
- Table 116: Global Cereal Bars Market in South America Volume K Units Forecast, by Consumption Analysis 2019 & 2032
- Table 117: Global Cereal Bars Market in South America Revenue Million Forecast, by Import Market Analysis (Value & Volume) 2019 & 2032
- Table 118: Global Cereal Bars Market in South America Volume K Units Forecast, by Import Market Analysis (Value & Volume) 2019 & 2032
- Table 119: Global Cereal Bars Market in South America Revenue Million Forecast, by Export Market Analysis (Value & Volume) 2019 & 2032
- Table 120: Global Cereal Bars Market in South America Volume K Units Forecast, by Export Market Analysis (Value & Volume) 2019 & 2032
- Table 121: Global Cereal Bars Market in South America Revenue Million Forecast, by Price Trend Analysis 2019 & 2032
- Table 122: Global Cereal Bars Market in South America Volume K Units Forecast, by Price Trend Analysis 2019 & 2032
- Table 123: Global Cereal Bars Market in South America Revenue Million Forecast, by Country 2019 & 2032
- Table 124: Global Cereal Bars Market in South America Volume K Units Forecast, by Country 2019 & 2032
- Table 125: China Cereal Bars Market in South America Revenue (Million) Forecast, by Application 2019 & 2032
- Table 126: China Cereal Bars Market in South America Volume (K Units) Forecast, by Application 2019 & 2032
- Table 127: India Cereal Bars Market in South America Revenue (Million) Forecast, by Application 2019 & 2032
- Table 128: India Cereal Bars Market in South America Volume (K Units) Forecast, by Application 2019 & 2032
- Table 129: Japan Cereal Bars Market in South America Revenue (Million) Forecast, by Application 2019 & 2032
- Table 130: Japan Cereal Bars Market in South America Volume (K Units) Forecast, by Application 2019 & 2032
- Table 131: South Korea Cereal Bars Market in South America Revenue (Million) Forecast, by Application 2019 & 2032
- Table 132: South Korea Cereal Bars Market in South America Volume (K Units) Forecast, by Application 2019 & 2032
- Table 133: ASEAN Cereal Bars Market in South America Revenue (Million) Forecast, by Application 2019 & 2032
- Table 134: ASEAN Cereal Bars Market in South America Volume (K Units) Forecast, by Application 2019 & 2032
- Table 135: Oceania Cereal Bars Market in South America Revenue (Million) Forecast, by Application 2019 & 2032
- Table 136: Oceania Cereal Bars Market in South America Volume (K Units) Forecast, by Application 2019 & 2032
- Table 137: Rest of Asia Pacific Cereal Bars Market in South America Revenue (Million) Forecast, by Application 2019 & 2032
- Table 138: Rest of Asia Pacific Cereal Bars Market in South America Volume (K Units) Forecast, by Application 2019 & 2032
Frequently Asked Questions
1. What is the projected Compound Annual Growth Rate (CAGR) of the Cereal Bars Market in South America?
The projected CAGR is approximately 4.30%.
2. Which companies are prominent players in the Cereal Bars Market in South America?
Key companies in the market include The Kellogg Company, Nestle S A, General Mills Inc, PepsiCo Inc, Kind LLC*List Not Exhaustive, Clif Bar & Company, Mondelez International Inc.
3. What are the main segments of the Cereal Bars Market in South America?
The market segments include Production Analysis, Consumption Analysis, Import Market Analysis (Value & Volume), Export Market Analysis (Value & Volume), Price Trend Analysis.
4. Can you provide details about the market size?
The market size is estimated to be USD 10380 Million as of 2022.
5. What are some drivers contributing to market growth?
Popularity of Convenient Food Products; Expansion of Cold Chain Logistics.
6. What are the notable trends driving market growth?
Surge In The Consumption Of Healthy Food.
7. Are there any restraints impacting market growth?
Concerns Over Food Safety and Quality.
8. Can you provide examples of recent developments in the market?
N/A
9. What pricing options are available for accessing the report?
Pricing options include single-user, multi-user, and enterprise licenses priced at USD 4750, USD 4950, and USD 6800 respectively.
10. Is the market size provided in terms of value or volume?
The market size is provided in terms of value, measured in Million and volume, measured in K Units.
11. Are there any specific market keywords associated with the report?
Yes, the market keyword associated with the report is "Cereal Bars Market in South America," which aids in identifying and referencing the specific market segment covered.
12. How do I determine which pricing option suits my needs best?
The pricing options vary based on user requirements and access needs. Individual users may opt for single-user licenses, while businesses requiring broader access may choose multi-user or enterprise licenses for cost-effective access to the report.
13. Are there any additional resources or data provided in the Cereal Bars Market in South America report?
While the report offers comprehensive insights, it's advisable to review the specific contents or supplementary materials provided to ascertain if additional resources or data are available.
14. How can I stay updated on further developments or reports in the Cereal Bars Market in South America?
To stay informed about further developments, trends, and reports in the Cereal Bars Market in South America, consider subscribing to industry newsletters, following relevant companies and organizations, or regularly checking reputable industry news sources and publications.
Methodology
Step 1 - Identification of Relevant Samples Size from Population Database


Step 2 - Approaches for Defining Global Market Size (Value, Volume* & Price*)

Note*: In applicable scenarios
Step 3 - Data Sources
Primary Research
- Web Analytics
- Survey Reports
- Research Institute
- Latest Research Reports
- Opinion Leaders
Secondary Research
- Annual Reports
- White Paper
- Latest Press Release
- Industry Association
- Paid Database
- Investor Presentations

Step 4 - Data Triangulation
Involves using different sources of information in order to increase the validity of a study
These sources are likely to be stakeholders in a program - participants, other researchers, program staff, other community members, and so on.
Then we put all data in single framework & apply various statistical tools to find out the dynamic on the market.
During the analysis stage, feedback from the stakeholder groups would be compared to determine areas of agreement as well as areas of divergence


