
Key Insights
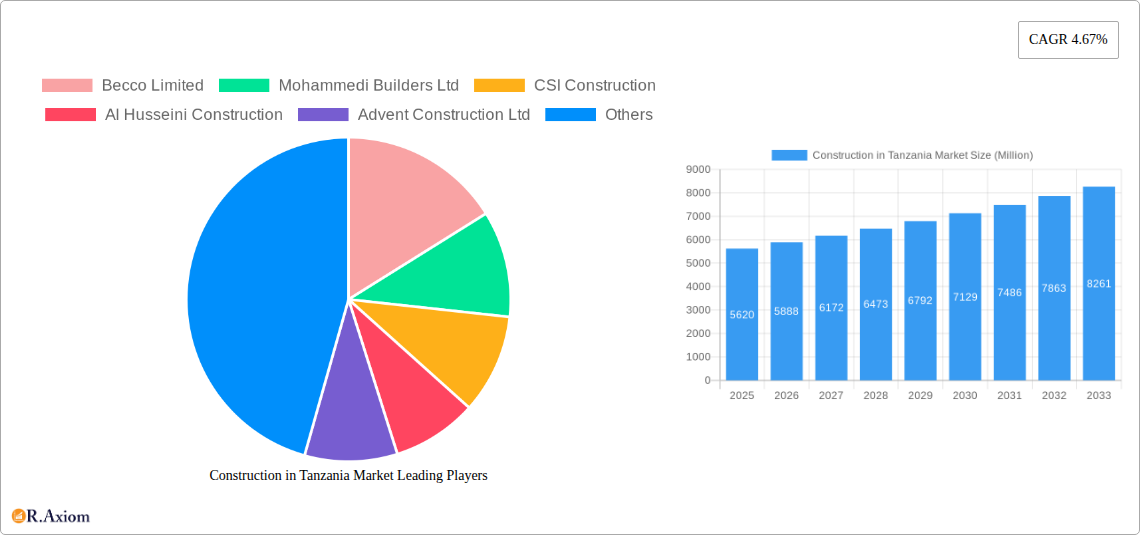
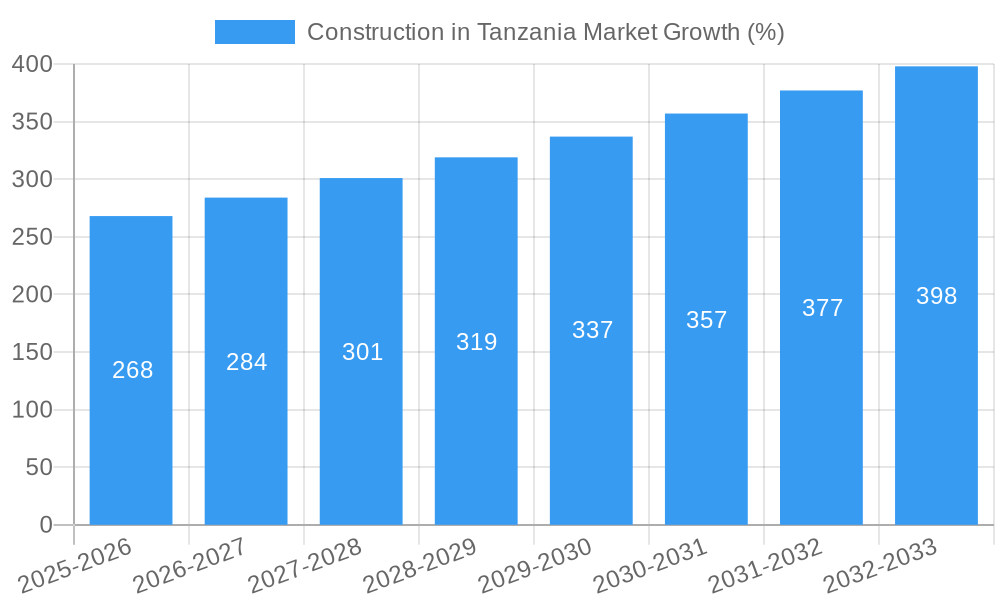
The Tanzanian construction market, valued at $5.62 billion in 2025, exhibits robust growth potential, projected to expand at a compound annual growth rate (CAGR) of 4.67% from 2025 to 2033. This growth is fueled by several key drivers. Increased government investment in infrastructure projects, particularly in transportation (roads, railways, and ports) and energy & utilities (power generation and distribution), is a significant catalyst. Rapid urbanization and a burgeoning population are driving demand for residential and commercial construction. Furthermore, tourism infrastructure development contributes to the sector's expansion. While challenges exist, such as fluctuating material costs and skilled labor shortages, the overall outlook remains positive. The market is segmented across residential, commercial, industrial, infrastructure (transportation), and energy and utilities sectors, with each contributing to the overall growth trajectory. Significant players like Becco Limited, Mohammedi Builders Ltd, and CSI Construction are shaping the competitive landscape, though smaller, regional firms also contribute substantially to the overall market activity.
The market's segmentation presents diverse opportunities. Residential construction benefits from population growth and rising middle-class incomes, while commercial construction is spurred by foreign investment and expanding businesses. The infrastructure segment is poised for significant growth due to ongoing government initiatives. The energy and utilities sector, vital for economic development, will require continuous investment in new projects and upgrades to existing infrastructure. The construction industry faces challenges in sourcing high-quality materials consistently and maintaining a skilled workforce, creating opportunities for companies addressing these supply chain and human resource needs. However, the government's commitment to infrastructure development and economic growth will likely offset these challenges, making Tanzania an attractive market for domestic and international construction firms over the forecast period.
Construction in Tanzania Market: A Comprehensive Report (2019-2033)
This detailed report provides a comprehensive analysis of the Tanzanian construction market, offering invaluable insights for investors, industry stakeholders, and businesses operating within or considering entry into this dynamic sector. With a study period spanning 2019-2033, a base year of 2025, and a forecast period from 2025-2033, this report leverages historical data (2019-2024) and projected figures to present a robust market overview. The report focuses on key market segments, competitive dynamics, and future growth prospects, incorporating recent major developments and industry trends shaping the Tanzanian construction landscape. Market values are expressed in Millions.
Construction in Tanzania Market: Market Concentration & Innovation
The Tanzanian construction market exhibits a moderately concentrated landscape, with a few large players alongside numerous smaller and medium-sized enterprises. Market share data for 2024 indicates that Becco Limited holds an estimated xx% market share, followed by Mohammedi Builders Ltd with xx%, and CSI Construction with xx%. However, the market remains fragmented, allowing for opportunities for both established players and new entrants. Innovation in the sector is driven by government initiatives promoting sustainable construction practices and advancements in building materials technology. The regulatory framework, while undergoing improvements, can sometimes pose challenges. Increased adoption of Building Information Modeling (BIM) and prefabrication methods is observed, albeit at a slower pace than in more developed markets. Limited availability of skilled labor and the prevalence of traditional construction practices are factors limiting rapid innovation adoption. The construction market also witnesses a steady stream of M&A activity, with deal values averaging approximately xx Million annually in the historical period. Notable transactions include (examples of deals with values – if available, otherwise omit): These activities contribute to market consolidation and enhance the expertise of larger players.
- Market Concentration: Moderately concentrated with several large and numerous smaller players.
- Innovation Drivers: Government initiatives, technological advancements in materials, and increasing adoption of BIM.
- Regulatory Framework: Undergoing improvements, but some hurdles remain.
- M&A Activity: Moderate level, with an average annual deal value of xx Million (2019-2024).
Construction in Tanzania Market: Industry Trends & Insights
The Tanzanian construction market demonstrates a steady growth trajectory, driven by sustained economic expansion, rising urbanization, and increasing infrastructure development. The Compound Annual Growth Rate (CAGR) is projected at xx% for the forecast period (2025-2033). Market penetration for sustainable construction practices remains low (currently estimated at xx%), but is expected to rise significantly, driven by governmental environmental regulations and growing public awareness. Technological disruptions, while gradual, are increasingly observed with the introduction of prefabricated building components and BIM technology. Consumer preferences are shifting towards higher quality, energy-efficient buildings, especially in the residential sector. Competitive dynamics are characterized by increasing competition among both local and international construction firms, leading to price pressures and a focus on project efficiency.
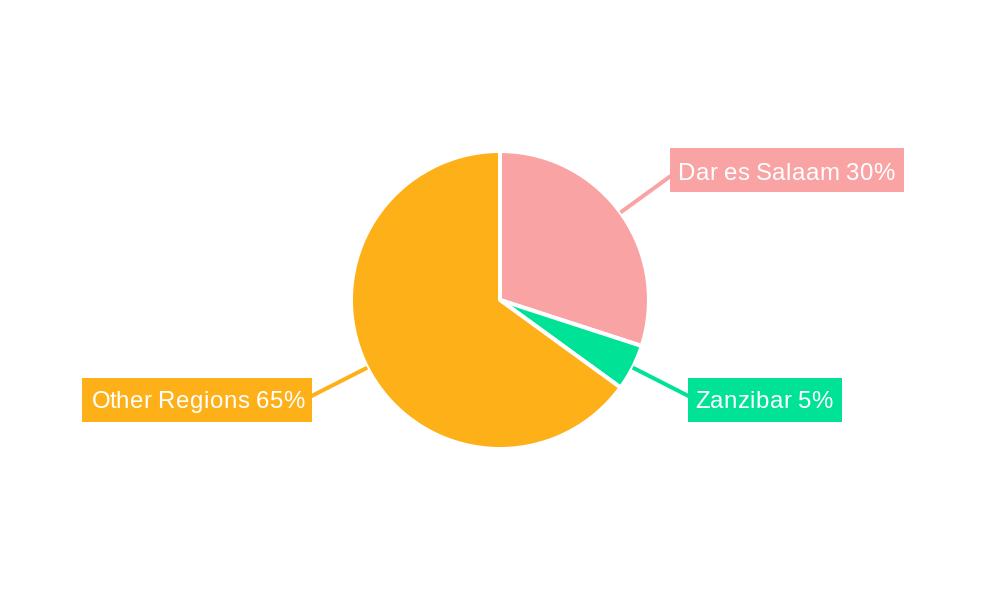
Dominant Markets & Segments in Construction in Tanzania Market
The infrastructure sector (transportation) is currently the dominant segment in the Tanzanian construction market. The large-scale projects underway and planned, such as the USD 30 Billion LNG terminal project (March 2023), significantly contribute to this dominance. The residential sector is also experiencing strong growth, driven by rising urbanization and the increasing demand for affordable housing. While other sectors such as commercial and industrial are also experiencing growth, their contributions to the overall market size remains less than infrastructure and residential.
- Key Drivers for Infrastructure Dominance: Large-scale government investments in transportation projects (roads, railways, ports), growing energy demand, and foreign direct investment in infrastructure development.
- Key Drivers for Residential Growth: Increasing urbanization, growing population, and rising demand for affordable housing.
Construction in Tanzania Market: Product Developments
Product innovations in the Tanzanian construction market largely focus on cost-effective and locally sourced materials. An increase in the use of prefabricated components and sustainable building materials is noticeable, although adoption remains relatively limited. Technological advancements like 3D printing technology for construction are still in their nascent stages. The competitive advantage lies in offering cost-effective, time-efficient, and sustainable solutions tailored to local needs.
Report Scope & Segmentation Analysis
The report segments the Tanzanian construction market by sector: Residential, Commercial, Industrial, Infrastructure (Transportation), and Energy and Utilities. Each segment is analyzed based on market size, growth projections, and competitive dynamics. The Residential segment is projected to exhibit a xx% CAGR, driven by population growth. The Commercial segment is expected to grow at a xx% CAGR due to increased private investment and urbanization. The Industrial sector, while smaller, is expected to grow at a xx% CAGR, fueled by industrialization efforts. The Infrastructure (Transportation) sector, bolstered by ongoing mega-projects, is projected to maintain a high CAGR of xx%. The Energy and Utilities sector will experience a CAGR of xx% due to the increasing need to improve power supply and create new infrastructure to support energy production, including the upcoming LNG project.
Key Drivers of Construction in Tanzania Market Growth
The Tanzanian construction market's growth is fueled by several factors:
- Government Investment: Significant government spending on infrastructure projects, particularly in transportation and energy.
- Economic Growth: Steady GDP growth driving increased private sector investment in construction.
- Urbanization: Rapid urbanization leading to increased housing demand and commercial development.
- Foreign Direct Investment: Inflows of foreign capital supporting large-scale projects.
Challenges in the Construction in Tanzania Market Sector
The sector faces several challenges:
- Regulatory Hurdles: Bureaucracy and complexities in obtaining permits and approvals.
- Infrastructure Gaps: Inadequate infrastructure in some areas hindering project implementation.
- Skilled Labor Shortage: Lack of skilled labor leading to increased project costs and delays.
- Supply Chain Issues: Challenges in procuring materials due to logistical constraints.
Emerging Opportunities in Construction in Tanzania Market
Significant opportunities exist for:
- Sustainable Construction: Growing demand for eco-friendly buildings and materials.
- Technological Adoption: Increased use of BIM and prefabrication to enhance efficiency.
- Infrastructure Development: Large-scale projects in transportation and energy sectors.
- Affordable Housing: Addressing the increasing demand for cost-effective housing solutions.
Leading Players in the Construction in Tanzania Market Market
- Becco Limited
- Mohammedi Builders Ltd
- CSI Construction
- Al Husseini Construction
- Advent Construction Ltd
- Salem Construction Limited
- Masasi Construction Co Ltd
- Imperial Construction Company
- Nordic Construction Company Limited
- Milembe Construction Co Ltd
- Estim Construction
Key Developments in Construction in Tanzania Market Industry
- August 2022: Adani Group (APSEZ) and AD Ports signed an agreement to pursue Tanzanian strategic investment possibilities, focusing on end-to-end logistics infrastructure. This signifies a substantial influx of investment in port, rail, and industrial zone development.
- March 2023: Tanzania to award contracts for a USD 30 billion LNG project. This mega-project will significantly boost the infrastructure sector and attract further investment in related industries.
Strategic Outlook for Construction in Tanzania Market Market
The Tanzanian construction market presents a promising outlook for the forecast period. Ongoing government initiatives, coupled with significant foreign investment, particularly in infrastructure, will continue to drive market growth. The increasing focus on sustainable construction practices and the adoption of new technologies will further shape market dynamics. The USD 30 billion LNG project and the Adani-AD Ports joint venture represent key catalysts for future expansion. Companies with a strong focus on innovation, sustainability, and efficient project management are well-positioned to capitalize on the numerous opportunities within this dynamic market.
Construction in Tanzania Market Segmentation
-
1. Sector
- 1.1. Residential
- 1.2. Commercial
- 1.3. Industrial
- 1.4. Infrastructure (Transportation)
- 1.5. Energy and Utilities
Construction in Tanzania Market Segmentation By Geography
-
1. North America
- 1.1. United States
- 1.2. Canada
- 1.3. Mexico
-
2. South America
- 2.1. Brazil
- 2.2. Argentina
- 2.3. Rest of South America
-
3. Europe
- 3.1. United Kingdom
- 3.2. Germany
- 3.3. France
- 3.4. Italy
- 3.5. Spain
- 3.6. Russia
- 3.7. Benelux
- 3.8. Nordics
- 3.9. Rest of Europe
-
4. Middle East & Africa
- 4.1. Turkey
- 4.2. Israel
- 4.3. GCC
- 4.4. North Africa
- 4.5. South Africa
- 4.6. Rest of Middle East & Africa
-
5. Asia Pacific
- 5.1. China
- 5.2. India
- 5.3. Japan
- 5.4. South Korea
- 5.5. ASEAN
- 5.6. Oceania
- 5.7. Rest of Asia Pacific
Construction in Tanzania Market REPORT HIGHLIGHTS
| Aspects | Details |
|---|---|
| Study Period | 2019-2033 |
| Base Year | 2024 |
| Estimated Year | 2025 |
| Forecast Period | 2025-2033 |
| Historical Period | 2019-2024 |
| Growth Rate | CAGR of 4.67% from 2019-2033 |
| Segmentation |
|
Table of Contents
- 1. Introduction
- 1.1. Research Scope
- 1.2. Market Segmentation
- 1.3. Research Methodology
- 1.4. Definitions and Assumptions
- 2. Executive Summary
- 2.1. Introduction
- 3. Market Dynamics
- 3.1. Introduction
- 3.2. Market Drivers
- 3.2.1. Increasing Investment in Infrastructure Projects; The rising popularity of sustainable architecture
- 3.3. Market Restrains
- 3.3.1. Volatility in Raw material prices
- 3.4. Market Trends
- 3.4.1. Increasing Investment in Infrastructure Projects
- 4. Market Factor Analysis
- 4.1. Porters Five Forces
- 4.2. Supply/Value Chain
- 4.3. PESTEL analysis
- 4.4. Market Entropy
- 4.5. Patent/Trademark Analysis
- 5. Global Construction in Tanzania Market Analysis, Insights and Forecast, 2019-2031
- 5.1. Market Analysis, Insights and Forecast - by Sector
- 5.1.1. Residential
- 5.1.2. Commercial
- 5.1.3. Industrial
- 5.1.4. Infrastructure (Transportation)
- 5.1.5. Energy and Utilities
- 5.2. Market Analysis, Insights and Forecast - by Region
- 5.2.1. North America
- 5.2.2. South America
- 5.2.3. Europe
- 5.2.4. Middle East & Africa
- 5.2.5. Asia Pacific
- 5.1. Market Analysis, Insights and Forecast - by Sector
- 6. North America Construction in Tanzania Market Analysis, Insights and Forecast, 2019-2031
- 6.1. Market Analysis, Insights and Forecast - by Sector
- 6.1.1. Residential
- 6.1.2. Commercial
- 6.1.3. Industrial
- 6.1.4. Infrastructure (Transportation)
- 6.1.5. Energy and Utilities
- 6.1. Market Analysis, Insights and Forecast - by Sector
- 7. South America Construction in Tanzania Market Analysis, Insights and Forecast, 2019-2031
- 7.1. Market Analysis, Insights and Forecast - by Sector
- 7.1.1. Residential
- 7.1.2. Commercial
- 7.1.3. Industrial
- 7.1.4. Infrastructure (Transportation)
- 7.1.5. Energy and Utilities
- 7.1. Market Analysis, Insights and Forecast - by Sector
- 8. Europe Construction in Tanzania Market Analysis, Insights and Forecast, 2019-2031
- 8.1. Market Analysis, Insights and Forecast - by Sector
- 8.1.1. Residential
- 8.1.2. Commercial
- 8.1.3. Industrial
- 8.1.4. Infrastructure (Transportation)
- 8.1.5. Energy and Utilities
- 8.1. Market Analysis, Insights and Forecast - by Sector
- 9. Middle East & Africa Construction in Tanzania Market Analysis, Insights and Forecast, 2019-2031
- 9.1. Market Analysis, Insights and Forecast - by Sector
- 9.1.1. Residential
- 9.1.2. Commercial
- 9.1.3. Industrial
- 9.1.4. Infrastructure (Transportation)
- 9.1.5. Energy and Utilities
- 9.1. Market Analysis, Insights and Forecast - by Sector
- 10. Asia Pacific Construction in Tanzania Market Analysis, Insights and Forecast, 2019-2031
- 10.1. Market Analysis, Insights and Forecast - by Sector
- 10.1.1. Residential
- 10.1.2. Commercial
- 10.1.3. Industrial
- 10.1.4. Infrastructure (Transportation)
- 10.1.5. Energy and Utilities
- 10.1. Market Analysis, Insights and Forecast - by Sector
- 11. Competitive Analysis
- 11.1. Global Market Share Analysis 2024
- 11.2. Company Profiles
- 11.2.1 Becco Limited
- 11.2.1.1. Overview
- 11.2.1.2. Products
- 11.2.1.3. SWOT Analysis
- 11.2.1.4. Recent Developments
- 11.2.1.5. Financials (Based on Availability)
- 11.2.2 Mohammedi Builders Ltd
- 11.2.2.1. Overview
- 11.2.2.2. Products
- 11.2.2.3. SWOT Analysis
- 11.2.2.4. Recent Developments
- 11.2.2.5. Financials (Based on Availability)
- 11.2.3 CSI Construction
- 11.2.3.1. Overview
- 11.2.3.2. Products
- 11.2.3.3. SWOT Analysis
- 11.2.3.4. Recent Developments
- 11.2.3.5. Financials (Based on Availability)
- 11.2.4 Al Husseini Construction
- 11.2.4.1. Overview
- 11.2.4.2. Products
- 11.2.4.3. SWOT Analysis
- 11.2.4.4. Recent Developments
- 11.2.4.5. Financials (Based on Availability)
- 11.2.5 Advent Construction Ltd
- 11.2.5.1. Overview
- 11.2.5.2. Products
- 11.2.5.3. SWOT Analysis
- 11.2.5.4. Recent Developments
- 11.2.5.5. Financials (Based on Availability)
- 11.2.6 Salem Construction Limited
- 11.2.6.1. Overview
- 11.2.6.2. Products
- 11.2.6.3. SWOT Analysis
- 11.2.6.4. Recent Developments
- 11.2.6.5. Financials (Based on Availability)
- 11.2.7 Masasi Construction Co Ltd
- 11.2.7.1. Overview
- 11.2.7.2. Products
- 11.2.7.3. SWOT Analysis
- 11.2.7.4. Recent Developments
- 11.2.7.5. Financials (Based on Availability)
- 11.2.8 Imperial Construction Company**List Not Exhaustive
- 11.2.8.1. Overview
- 11.2.8.2. Products
- 11.2.8.3. SWOT Analysis
- 11.2.8.4. Recent Developments
- 11.2.8.5. Financials (Based on Availability)
- 11.2.9 Nordic Construction Company Limited
- 11.2.9.1. Overview
- 11.2.9.2. Products
- 11.2.9.3. SWOT Analysis
- 11.2.9.4. Recent Developments
- 11.2.9.5. Financials (Based on Availability)
- 11.2.10 Milembe Construction Co Ltd
- 11.2.10.1. Overview
- 11.2.10.2. Products
- 11.2.10.3. SWOT Analysis
- 11.2.10.4. Recent Developments
- 11.2.10.5. Financials (Based on Availability)
- 11.2.11 Estim Construction
- 11.2.11.1. Overview
- 11.2.11.2. Products
- 11.2.11.3. SWOT Analysis
- 11.2.11.4. Recent Developments
- 11.2.11.5. Financials (Based on Availability)
- 11.2.1 Becco Limited
List of Figures
- Figure 1: Global Construction in Tanzania Market Revenue Breakdown (Million, %) by Region 2024 & 2032
- Figure 2: Tanzania Construction in Tanzania Market Revenue (Million), by Country 2024 & 2032
- Figure 3: Tanzania Construction in Tanzania Market Revenue Share (%), by Country 2024 & 2032
- Figure 4: North America Construction in Tanzania Market Revenue (Million), by Sector 2024 & 2032
- Figure 5: North America Construction in Tanzania Market Revenue Share (%), by Sector 2024 & 2032
- Figure 6: North America Construction in Tanzania Market Revenue (Million), by Country 2024 & 2032
- Figure 7: North America Construction in Tanzania Market Revenue Share (%), by Country 2024 & 2032
- Figure 8: South America Construction in Tanzania Market Revenue (Million), by Sector 2024 & 2032
- Figure 9: South America Construction in Tanzania Market Revenue Share (%), by Sector 2024 & 2032
- Figure 10: South America Construction in Tanzania Market Revenue (Million), by Country 2024 & 2032
- Figure 11: South America Construction in Tanzania Market Revenue Share (%), by Country 2024 & 2032
- Figure 12: Europe Construction in Tanzania Market Revenue (Million), by Sector 2024 & 2032
- Figure 13: Europe Construction in Tanzania Market Revenue Share (%), by Sector 2024 & 2032
- Figure 14: Europe Construction in Tanzania Market Revenue (Million), by Country 2024 & 2032
- Figure 15: Europe Construction in Tanzania Market Revenue Share (%), by Country 2024 & 2032
- Figure 16: Middle East & Africa Construction in Tanzania Market Revenue (Million), by Sector 2024 & 2032
- Figure 17: Middle East & Africa Construction in Tanzania Market Revenue Share (%), by Sector 2024 & 2032
- Figure 18: Middle East & Africa Construction in Tanzania Market Revenue (Million), by Country 2024 & 2032
- Figure 19: Middle East & Africa Construction in Tanzania Market Revenue Share (%), by Country 2024 & 2032
- Figure 20: Asia Pacific Construction in Tanzania Market Revenue (Million), by Sector 2024 & 2032
- Figure 21: Asia Pacific Construction in Tanzania Market Revenue Share (%), by Sector 2024 & 2032
- Figure 22: Asia Pacific Construction in Tanzania Market Revenue (Million), by Country 2024 & 2032
- Figure 23: Asia Pacific Construction in Tanzania Market Revenue Share (%), by Country 2024 & 2032
List of Tables
- Table 1: Global Construction in Tanzania Market Revenue Million Forecast, by Region 2019 & 2032
- Table 2: Global Construction in Tanzania Market Revenue Million Forecast, by Sector 2019 & 2032
- Table 3: Global Construction in Tanzania Market Revenue Million Forecast, by Region 2019 & 2032
- Table 4: Global Construction in Tanzania Market Revenue Million Forecast, by Country 2019 & 2032
- Table 5: Global Construction in Tanzania Market Revenue Million Forecast, by Sector 2019 & 2032
- Table 6: Global Construction in Tanzania Market Revenue Million Forecast, by Country 2019 & 2032
- Table 7: United States Construction in Tanzania Market Revenue (Million) Forecast, by Application 2019 & 2032
- Table 8: Canada Construction in Tanzania Market Revenue (Million) Forecast, by Application 2019 & 2032
- Table 9: Mexico Construction in Tanzania Market Revenue (Million) Forecast, by Application 2019 & 2032
- Table 10: Global Construction in Tanzania Market Revenue Million Forecast, by Sector 2019 & 2032
- Table 11: Global Construction in Tanzania Market Revenue Million Forecast, by Country 2019 & 2032
- Table 12: Brazil Construction in Tanzania Market Revenue (Million) Forecast, by Application 2019 & 2032
- Table 13: Argentina Construction in Tanzania Market Revenue (Million) Forecast, by Application 2019 & 2032
- Table 14: Rest of South America Construction in Tanzania Market Revenue (Million) Forecast, by Application 2019 & 2032
- Table 15: Global Construction in Tanzania Market Revenue Million Forecast, by Sector 2019 & 2032
- Table 16: Global Construction in Tanzania Market Revenue Million Forecast, by Country 2019 & 2032
- Table 17: United Kingdom Construction in Tanzania Market Revenue (Million) Forecast, by Application 2019 & 2032
- Table 18: Germany Construction in Tanzania Market Revenue (Million) Forecast, by Application 2019 & 2032
- Table 19: France Construction in Tanzania Market Revenue (Million) Forecast, by Application 2019 & 2032
- Table 20: Italy Construction in Tanzania Market Revenue (Million) Forecast, by Application 2019 & 2032
- Table 21: Spain Construction in Tanzania Market Revenue (Million) Forecast, by Application 2019 & 2032
- Table 22: Russia Construction in Tanzania Market Revenue (Million) Forecast, by Application 2019 & 2032
- Table 23: Benelux Construction in Tanzania Market Revenue (Million) Forecast, by Application 2019 & 2032
- Table 24: Nordics Construction in Tanzania Market Revenue (Million) Forecast, by Application 2019 & 2032
- Table 25: Rest of Europe Construction in Tanzania Market Revenue (Million) Forecast, by Application 2019 & 2032
- Table 26: Global Construction in Tanzania Market Revenue Million Forecast, by Sector 2019 & 2032
- Table 27: Global Construction in Tanzania Market Revenue Million Forecast, by Country 2019 & 2032
- Table 28: Turkey Construction in Tanzania Market Revenue (Million) Forecast, by Application 2019 & 2032
- Table 29: Israel Construction in Tanzania Market Revenue (Million) Forecast, by Application 2019 & 2032
- Table 30: GCC Construction in Tanzania Market Revenue (Million) Forecast, by Application 2019 & 2032
- Table 31: North Africa Construction in Tanzania Market Revenue (Million) Forecast, by Application 2019 & 2032
- Table 32: South Africa Construction in Tanzania Market Revenue (Million) Forecast, by Application 2019 & 2032
- Table 33: Rest of Middle East & Africa Construction in Tanzania Market Revenue (Million) Forecast, by Application 2019 & 2032
- Table 34: Global Construction in Tanzania Market Revenue Million Forecast, by Sector 2019 & 2032
- Table 35: Global Construction in Tanzania Market Revenue Million Forecast, by Country 2019 & 2032
- Table 36: China Construction in Tanzania Market Revenue (Million) Forecast, by Application 2019 & 2032
- Table 37: India Construction in Tanzania Market Revenue (Million) Forecast, by Application 2019 & 2032
- Table 38: Japan Construction in Tanzania Market Revenue (Million) Forecast, by Application 2019 & 2032
- Table 39: South Korea Construction in Tanzania Market Revenue (Million) Forecast, by Application 2019 & 2032
- Table 40: ASEAN Construction in Tanzania Market Revenue (Million) Forecast, by Application 2019 & 2032
- Table 41: Oceania Construction in Tanzania Market Revenue (Million) Forecast, by Application 2019 & 2032
- Table 42: Rest of Asia Pacific Construction in Tanzania Market Revenue (Million) Forecast, by Application 2019 & 2032
Frequently Asked Questions
1. What is the projected Compound Annual Growth Rate (CAGR) of the Construction in Tanzania Market?
The projected CAGR is approximately 4.67%.
2. Which companies are prominent players in the Construction in Tanzania Market?
Key companies in the market include Becco Limited, Mohammedi Builders Ltd, CSI Construction, Al Husseini Construction, Advent Construction Ltd, Salem Construction Limited, Masasi Construction Co Ltd, Imperial Construction Company**List Not Exhaustive, Nordic Construction Company Limited, Milembe Construction Co Ltd, Estim Construction.
3. What are the main segments of the Construction in Tanzania Market?
The market segments include Sector.
4. Can you provide details about the market size?
The market size is estimated to be USD 5.62 Million as of 2022.
5. What are some drivers contributing to market growth?
Increasing Investment in Infrastructure Projects; The rising popularity of sustainable architecture.
6. What are the notable trends driving market growth?
Increasing Investment in Infrastructure Projects.
7. Are there any restraints impacting market growth?
Volatility in Raw material prices.
8. Can you provide examples of recent developments in the market?
August 2022: Adani Group (APSEZ), an Indian port giant, and AD Ports (Abu Dhabi Ports) have signed an agreement to work together to pursue Tanzanian strategic investment possibilities. The joint venture partners intended to provide end-to-end logistics infrastructure and services, including rail, ports, maritime services, digital services, and industrial zones in Tanzania.
9. What pricing options are available for accessing the report?
Pricing options include single-user, multi-user, and enterprise licenses priced at USD 3800, USD 4500, and USD 5800 respectively.
10. Is the market size provided in terms of value or volume?
The market size is provided in terms of value, measured in Million.
11. Are there any specific market keywords associated with the report?
Yes, the market keyword associated with the report is "Construction in Tanzania Market," which aids in identifying and referencing the specific market segment covered.
12. How do I determine which pricing option suits my needs best?
The pricing options vary based on user requirements and access needs. Individual users may opt for single-user licenses, while businesses requiring broader access may choose multi-user or enterprise licenses for cost-effective access to the report.
13. Are there any additional resources or data provided in the Construction in Tanzania Market report?
While the report offers comprehensive insights, it's advisable to review the specific contents or supplementary materials provided to ascertain if additional resources or data are available.
14. How can I stay updated on further developments or reports in the Construction in Tanzania Market?
To stay informed about further developments, trends, and reports in the Construction in Tanzania Market, consider subscribing to industry newsletters, following relevant companies and organizations, or regularly checking reputable industry news sources and publications.
Methodology
Step 1 - Identification of Relevant Samples Size from Population Database


Step 2 - Approaches for Defining Global Market Size (Value, Volume* & Price*)

Note*: In applicable scenarios
Step 3 - Data Sources
Primary Research
- Web Analytics
- Survey Reports
- Research Institute
- Latest Research Reports
- Opinion Leaders
Secondary Research
- Annual Reports
- White Paper
- Latest Press Release
- Industry Association
- Paid Database
- Investor Presentations

Step 4 - Data Triangulation
Involves using different sources of information in order to increase the validity of a study
These sources are likely to be stakeholders in a program - participants, other researchers, program staff, other community members, and so on.
Then we put all data in single framework & apply various statistical tools to find out the dynamic on the market.
During the analysis stage, feedback from the stakeholder groups would be compared to determine areas of agreement as well as areas of divergence


