
Key Insights
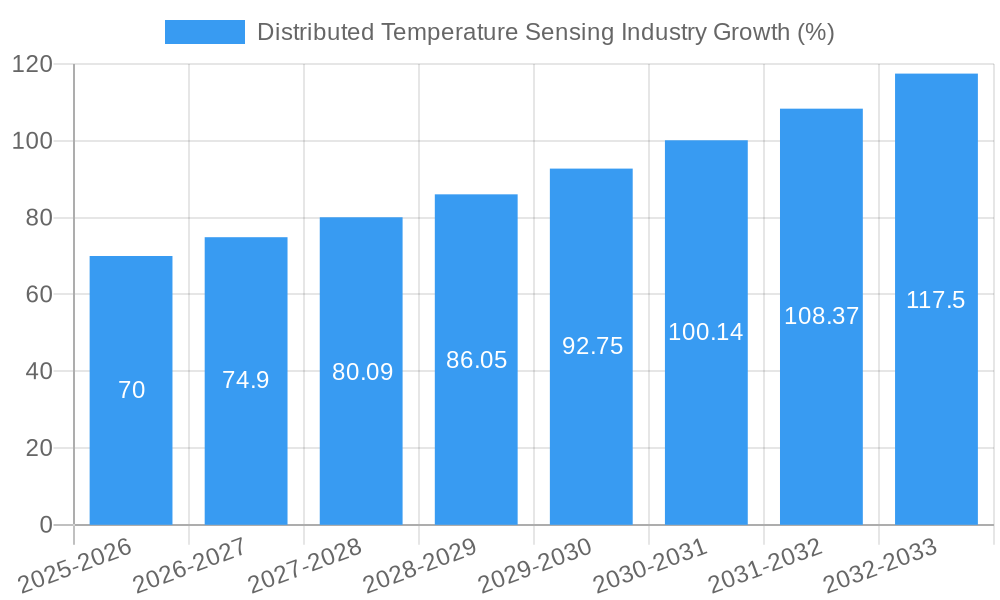
The Distributed Temperature Sensing (DTS) market is experiencing robust growth, driven by increasing demand across various sectors. A 7% Compound Annual Growth Rate (CAGR) from 2019 to 2024 suggests a significant market expansion, projected to continue through 2033. Key application areas like oil & gas production, power cable monitoring, and pipeline monitoring are primary growth drivers. The need for real-time monitoring, enhanced safety protocols, and improved operational efficiency in these industries fuels the adoption of DTS technology. Furthermore, the expanding environmental monitoring sector, particularly in relation to climate change mitigation and resource management, presents a considerable opportunity for market expansion. Different fiber types, including single-mode and multi-mode fibers, cater to varying application needs, contributing to market segmentation.
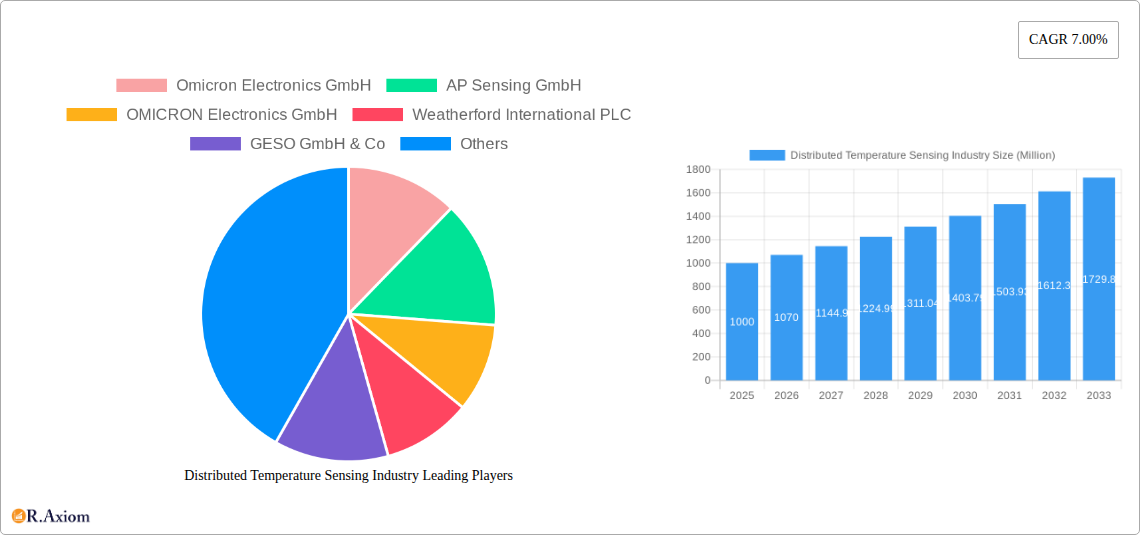
Competition within the DTS market is relatively fragmented, with several key players, including Omicron Electronics GmbH, AP Sensing GmbH, Weatherford International PLC, and Yokogawa Electric Corporation, vying for market share. Technological advancements in sensor technology, improved data analytics capabilities, and the development of more robust and reliable systems are key trends shaping the market landscape. However, high initial investment costs, the complexity of system implementation, and the need for specialized expertise can present some restraints to broader market penetration. Despite these challenges, the overall outlook for the DTS market remains positive, fueled by ongoing technological innovation and the increasing demand for advanced monitoring solutions across diverse industrial sectors. The market's geographical distribution is likely to see strong growth in regions such as Asia Pacific, driven by infrastructure development and industrial expansion. North America and Europe, while mature markets, are expected to maintain steady growth.
This comprehensive report provides an in-depth analysis of the Distributed Temperature Sensing (DTS) industry, offering actionable insights for stakeholders across the value chain. The study period spans 2019-2033, with 2025 serving as the base and estimated year. The forecast period covers 2025-2033, while the historical period encompasses 2019-2024. The report analyzes market dynamics, segmentation, competitive landscape, and future growth prospects, leveraging extensive data and expert analysis to provide a clear understanding of this evolving market. The global DTS market is projected to reach xx Million by 2033, exhibiting a CAGR of xx% during the forecast period.
Distributed Temperature Sensing Industry Market Concentration & Innovation
The DTS industry exhibits a moderately concentrated market structure, with several key players holding significant market share. Omicron Electronics GmbH, AP Sensing GmbH, OMICRON Electronics GmbH, Weatherford International PLC, and Yokogawa Electric Corporation are some of the leading companies, together accounting for an estimated xx% of the global market share in 2025. Market concentration is influenced by factors such as technological expertise, established distribution networks, and brand recognition.
Innovation is a crucial driver within the DTS industry. Continuous advancements in fiber optic technology, improved sensor accuracy, and the development of sophisticated data analytics capabilities are key areas of innovation. Stringent regulatory frameworks concerning safety and environmental compliance drive the adoption of advanced DTS systems. The industry also witnesses the emergence of substitute technologies, such as distributed acoustic sensing (DAS), though these have not yet significantly impacted DTS market share. End-user trends toward automation and real-time monitoring fuel the demand for advanced DTS solutions.
M&A activity has played a significant role in shaping the competitive landscape. Over the historical period, several mergers and acquisitions have occurred, with deal values totaling an estimated xx Million. These transactions highlight the strategic importance of consolidating market share and expanding technological capabilities. The most significant M&A deal in the past five years was xx, resulting in xx% increase in market share for the acquiring company.
- Key Market Concentration Metrics (2025):
- Top 5 players' market share: xx%
- Average M&A deal value (2019-2024): xx Million
- Number of M&A deals (2019-2024): xx
Distributed Temperature Sensing Industry Industry Trends & Insights
The DTS industry is experiencing robust growth, driven by several key factors. The increasing demand for enhanced safety and security across various sectors like oil and gas, power transmission, and infrastructure monitoring is a major growth catalyst. Technological advancements, particularly in the development of high-sensitivity sensors and improved data processing capabilities, are further fueling market expansion. The rising adoption of smart city initiatives and the growing focus on environmental monitoring are also contributing to market growth.
The industry is undergoing significant technological disruptions, with the integration of Artificial Intelligence (AI) and Machine Learning (ML) for predictive maintenance and data analysis gaining traction. Consumer preferences are shifting towards solutions offering enhanced reliability, lower operational costs, and improved data visualization capabilities. Competitive dynamics are characterized by intense innovation and strategic partnerships, as companies strive to differentiate their offerings and gain a competitive edge. This intense competition is reflected in the decreasing prices and increasing product features across the market. The market penetration of DTS systems has increased significantly from xx% in 2019 to xx% in 2024, highlighting the growing adoption rate.
Dominant Markets & Segments in Distributed Temperature Sensing Industry
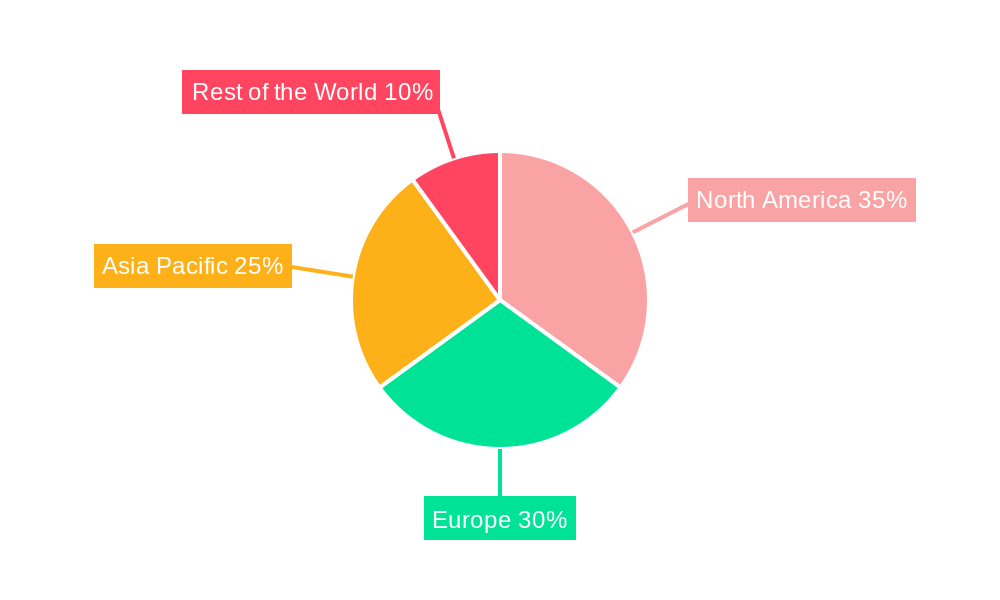
The oil & gas production segment is currently the dominant application area for DTS technology, accounting for approximately xx% of the market share in 2025. This is driven by the critical need for real-time monitoring of pipeline integrity, leak detection, and improved safety protocols within the oil & gas sector. Geographically, North America and Europe are the leading regions for DTS adoption, driven by robust infrastructure investments, stringent safety regulations, and a high concentration of industrial activities. Key drivers include:
- Oil & Gas Production: Stringent safety regulations, increasing demand for pipeline integrity monitoring, and the need for leak detection.
- Power Cable Monitoring: Growing electricity demand and the need to prevent power outages.
- Process & Pipeline Monitoring: Demand for enhanced process control, optimized resource management, and reduced downtime.
- North America: High concentration of oil & gas production facilities, significant investments in infrastructure development.
- Europe: Stringent environmental regulations, a growing focus on safety, and the need for optimized infrastructure management.
- Single-mode fiber: Superior performance and reliability in long-distance applications.
The single-mode fiber segment dominates the market by fiber type due to its superior performance in long-distance applications prevalent in oil & gas pipelines and power cable monitoring. The market is expected to witness significant growth in the coming years due to increased adoption in various industries.
Distributed Temperature Sensing Industry Product Developments
Recent product innovations focus on improving sensor accuracy, enhancing data processing capabilities, and integrating advanced analytics. Miniaturization of sensors, the development of wireless DTS systems, and improved software interfaces are enhancing ease of use and operational efficiency. These innovations cater to evolving market demands for greater precision, reduced installation complexities, and real-time data insights. The competitive advantage stems from offering superior performance, enhanced reliability, and cost-effective solutions tailored to specific application needs.
Report Scope & Segmentation Analysis
This report segments the DTS market by fiber type (single-mode fiber, multi-mode fiber) and by application (oil & gas production, power cable monitoring, process & pipeline monitoring, fire detection, environmental monitoring). Each segment is analyzed based on market size, growth projections, and competitive dynamics. The single-mode fiber segment is projected to maintain its dominance due to its superior performance in long-distance applications. The oil & gas production segment is expected to witness the highest growth rate, driven by increasing demand for enhanced safety and monitoring. The other application segments are also expected to experience significant growth, fueled by increasing adoption in various industries.
Key Drivers of Distributed Temperature Sensing Industry Growth
Several factors fuel DTS industry growth: stringent government regulations emphasizing safety and environmental compliance, increasing demand for real-time monitoring across various sectors, and the continuous development of advanced sensor technologies offering improved accuracy and reliability. The expanding oil & gas exploration and production activities, coupled with the growing need for efficient power grid management, are also key growth drivers. Technological advancements, such as AI and ML integration, enhance predictive maintenance capabilities, furthering industry adoption.
Challenges in the Distributed Temperature Sensing Industry Sector
The DTS industry faces challenges including the high initial investment cost associated with DTS system implementation and the need for specialized technical expertise for installation and maintenance. Supply chain disruptions and fluctuations in raw material prices can also impact profitability. Intense competition among industry players and the potential emergence of alternative technologies pose additional challenges. The overall impact of these challenges on market growth is estimated at approximately xx% reduction in CAGR over the forecast period.
Emerging Opportunities in Distributed Temperature Sensing Industry
Emerging opportunities include the growing adoption of DTS in smart city infrastructure, expansion into new applications such as geothermal energy monitoring, and the development of integrated solutions combining DTS with other sensing technologies. The increasing demand for improved data analytics and predictive maintenance creates further growth potential. The use of DTS in environmental monitoring for climate change research and disaster prevention is also a rapidly expanding area.
Leading Players in the Distributed Temperature Sensing Industry Market
- Omicron Electronics GmbH
- AP Sensing GmbH
- OMICRON Electronics GmbH
- Weatherford International PLC
- GESO GmbH & Co
- OFS Fitel LLC
- Sensornet Limited
- Bandweaver Technologies
- Banner Engineering Corp
- Halliburton Company
- NKT Photonics
- Yokogawa Electric Corporation
- Schlumberger Limited
- Sumitomo Electric Industries Ltd
- Micron Optics Inc
Key Developments in Distributed Temperature Sensing Industry Industry
- January 2023: AP Sensing launched its new generation of DTS system with improved accuracy and data processing capabilities.
- June 2022: Yokogawa Electric Corporation announced a strategic partnership with a leading oil & gas company to deploy DTS solutions in their pipeline networks.
- October 2021: Schlumberger Limited acquired a smaller DTS technology company, expanding its portfolio of monitoring solutions.
- (Further significant developments will be included in the full report.)
Strategic Outlook for Distributed Temperature Sensing Industry Market
The DTS industry is poised for continued growth, driven by technological innovation, increasing demand for advanced monitoring solutions, and expansion into new application areas. The integration of AI and ML, coupled with the development of cost-effective and user-friendly systems, will further fuel market expansion. The long-term outlook remains positive, with significant growth potential across various segments and geographical regions. The market is expected to continue to consolidate, with larger players acquiring smaller companies to expand their product portfolios and gain market share.
Distributed Temperature Sensing Industry Segmentation
-
1. Fiber Type
- 1.1. Single-mode fiber
- 1.2. Multi-mode fiber
-
2. Application
- 2.1. Oil & Gas Production
- 2.2. Power Cable Monitoring
- 2.3. Process & Pipeline Monitoring
- 2.4. Fire Detection
- 2.5. Environmental Monitoring
Distributed Temperature Sensing Industry Segmentation By Geography
- 1. North America
- 2. Europe
- 3. Asia Pacific
- 4. Rest of the World
Distributed Temperature Sensing Industry REPORT HIGHLIGHTS
| Aspects | Details |
|---|---|
| Study Period | 2019-2033 |
| Base Year | 2024 |
| Estimated Year | 2025 |
| Forecast Period | 2025-2033 |
| Historical Period | 2019-2024 |
| Growth Rate | CAGR of 7.00% from 2019-2033 |
| Segmentation |
|
Table of Contents
- 1. Introduction
- 1.1. Research Scope
- 1.2. Market Segmentation
- 1.3. Research Methodology
- 1.4. Definitions and Assumptions
- 2. Executive Summary
- 2.1. Introduction
- 3. Market Dynamics
- 3.1. Introduction
- 3.2. Market Drivers
- 3.2.1. ; Trustworthiness of DTS Systems/Sensors for Sensing & Monitoring Applications in Severe Environments; Growing Need for Labor Safety at Working Sites; Rising Applications in the Oil & Gas Industry
- 3.3. Market Restrains
- 3.3.1. ; Optical Cables are Inclined to Physical Damage; High Costs Associated With DTS Systems
- 3.4. Market Trends
- 3.4.1. Distributed Temperature Sensing Technology to have Major Application in Oil & Gas Production
- 4. Market Factor Analysis
- 4.1. Porters Five Forces
- 4.2. Supply/Value Chain
- 4.3. PESTEL analysis
- 4.4. Market Entropy
- 4.5. Patent/Trademark Analysis
- 5. Global Distributed Temperature Sensing Industry Analysis, Insights and Forecast, 2019-2031
- 5.1. Market Analysis, Insights and Forecast - by Fiber Type
- 5.1.1. Single-mode fiber
- 5.1.2. Multi-mode fiber
- 5.2. Market Analysis, Insights and Forecast - by Application
- 5.2.1. Oil & Gas Production
- 5.2.2. Power Cable Monitoring
- 5.2.3. Process & Pipeline Monitoring
- 5.2.4. Fire Detection
- 5.2.5. Environmental Monitoring
- 5.3. Market Analysis, Insights and Forecast - by Region
- 5.3.1. North America
- 5.3.2. Europe
- 5.3.3. Asia Pacific
- 5.3.4. Rest of the World
- 5.1. Market Analysis, Insights and Forecast - by Fiber Type
- 6. North America Distributed Temperature Sensing Industry Analysis, Insights and Forecast, 2019-2031
- 6.1. Market Analysis, Insights and Forecast - by Fiber Type
- 6.1.1. Single-mode fiber
- 6.1.2. Multi-mode fiber
- 6.2. Market Analysis, Insights and Forecast - by Application
- 6.2.1. Oil & Gas Production
- 6.2.2. Power Cable Monitoring
- 6.2.3. Process & Pipeline Monitoring
- 6.2.4. Fire Detection
- 6.2.5. Environmental Monitoring
- 6.1. Market Analysis, Insights and Forecast - by Fiber Type
- 7. Europe Distributed Temperature Sensing Industry Analysis, Insights and Forecast, 2019-2031
- 7.1. Market Analysis, Insights and Forecast - by Fiber Type
- 7.1.1. Single-mode fiber
- 7.1.2. Multi-mode fiber
- 7.2. Market Analysis, Insights and Forecast - by Application
- 7.2.1. Oil & Gas Production
- 7.2.2. Power Cable Monitoring
- 7.2.3. Process & Pipeline Monitoring
- 7.2.4. Fire Detection
- 7.2.5. Environmental Monitoring
- 7.1. Market Analysis, Insights and Forecast - by Fiber Type
- 8. Asia Pacific Distributed Temperature Sensing Industry Analysis, Insights and Forecast, 2019-2031
- 8.1. Market Analysis, Insights and Forecast - by Fiber Type
- 8.1.1. Single-mode fiber
- 8.1.2. Multi-mode fiber
- 8.2. Market Analysis, Insights and Forecast - by Application
- 8.2.1. Oil & Gas Production
- 8.2.2. Power Cable Monitoring
- 8.2.3. Process & Pipeline Monitoring
- 8.2.4. Fire Detection
- 8.2.5. Environmental Monitoring
- 8.1. Market Analysis, Insights and Forecast - by Fiber Type
- 9. Rest of the World Distributed Temperature Sensing Industry Analysis, Insights and Forecast, 2019-2031
- 9.1. Market Analysis, Insights and Forecast - by Fiber Type
- 9.1.1. Single-mode fiber
- 9.1.2. Multi-mode fiber
- 9.2. Market Analysis, Insights and Forecast - by Application
- 9.2.1. Oil & Gas Production
- 9.2.2. Power Cable Monitoring
- 9.2.3. Process & Pipeline Monitoring
- 9.2.4. Fire Detection
- 9.2.5. Environmental Monitoring
- 9.1. Market Analysis, Insights and Forecast - by Fiber Type
- 10. North America Distributed Temperature Sensing Industry Analysis, Insights and Forecast, 2019-2031
- 10.1. Market Analysis, Insights and Forecast - By Country/Sub-region
- 10.1.1.
- 11. Europe Distributed Temperature Sensing Industry Analysis, Insights and Forecast, 2019-2031
- 11.1. Market Analysis, Insights and Forecast - By Country/Sub-region
- 11.1.1.
- 12. Asia Pacific Distributed Temperature Sensing Industry Analysis, Insights and Forecast, 2019-2031
- 12.1. Market Analysis, Insights and Forecast - By Country/Sub-region
- 12.1.1.
- 13. Rest of the World Distributed Temperature Sensing Industry Analysis, Insights and Forecast, 2019-2031
- 13.1. Market Analysis, Insights and Forecast - By Country/Sub-region
- 13.1.1.
- 14. Competitive Analysis
- 14.1. Global Market Share Analysis 2024
- 14.2. Company Profiles
- 14.2.1 Omicron Electronics GmbH
- 14.2.1.1. Overview
- 14.2.1.2. Products
- 14.2.1.3. SWOT Analysis
- 14.2.1.4. Recent Developments
- 14.2.1.5. Financials (Based on Availability)
- 14.2.2 AP Sensing GmbH
- 14.2.2.1. Overview
- 14.2.2.2. Products
- 14.2.2.3. SWOT Analysis
- 14.2.2.4. Recent Developments
- 14.2.2.5. Financials (Based on Availability)
- 14.2.3 OMICRON Electronics GmbH
- 14.2.3.1. Overview
- 14.2.3.2. Products
- 14.2.3.3. SWOT Analysis
- 14.2.3.4. Recent Developments
- 14.2.3.5. Financials (Based on Availability)
- 14.2.4 Weatherford International PLC
- 14.2.4.1. Overview
- 14.2.4.2. Products
- 14.2.4.3. SWOT Analysis
- 14.2.4.4. Recent Developments
- 14.2.4.5. Financials (Based on Availability)
- 14.2.5 GESO GmbH & Co
- 14.2.5.1. Overview
- 14.2.5.2. Products
- 14.2.5.3. SWOT Analysis
- 14.2.5.4. Recent Developments
- 14.2.5.5. Financials (Based on Availability)
- 14.2.6 OFS Fitel LLC
- 14.2.6.1. Overview
- 14.2.6.2. Products
- 14.2.6.3. SWOT Analysis
- 14.2.6.4. Recent Developments
- 14.2.6.5. Financials (Based on Availability)
- 14.2.7 Sensornet Limited*List Not Exhaustive
- 14.2.7.1. Overview
- 14.2.7.2. Products
- 14.2.7.3. SWOT Analysis
- 14.2.7.4. Recent Developments
- 14.2.7.5. Financials (Based on Availability)
- 14.2.8 Bandweaver Technologies
- 14.2.8.1. Overview
- 14.2.8.2. Products
- 14.2.8.3. SWOT Analysis
- 14.2.8.4. Recent Developments
- 14.2.8.5. Financials (Based on Availability)
- 14.2.9 Banner Engineering Corp
- 14.2.9.1. Overview
- 14.2.9.2. Products
- 14.2.9.3. SWOT Analysis
- 14.2.9.4. Recent Developments
- 14.2.9.5. Financials (Based on Availability)
- 14.2.10 Halliburton Company
- 14.2.10.1. Overview
- 14.2.10.2. Products
- 14.2.10.3. SWOT Analysis
- 14.2.10.4. Recent Developments
- 14.2.10.5. Financials (Based on Availability)
- 14.2.11 NKT Photonics
- 14.2.11.1. Overview
- 14.2.11.2. Products
- 14.2.11.3. SWOT Analysis
- 14.2.11.4. Recent Developments
- 14.2.11.5. Financials (Based on Availability)
- 14.2.12 Yokogawa Electric Corporation
- 14.2.12.1. Overview
- 14.2.12.2. Products
- 14.2.12.3. SWOT Analysis
- 14.2.12.4. Recent Developments
- 14.2.12.5. Financials (Based on Availability)
- 14.2.13 Schlumberger Limited
- 14.2.13.1. Overview
- 14.2.13.2. Products
- 14.2.13.3. SWOT Analysis
- 14.2.13.4. Recent Developments
- 14.2.13.5. Financials (Based on Availability)
- 14.2.14 Sumitomo Electric Industries Ltd
- 14.2.14.1. Overview
- 14.2.14.2. Products
- 14.2.14.3. SWOT Analysis
- 14.2.14.4. Recent Developments
- 14.2.14.5. Financials (Based on Availability)
- 14.2.15 Micron Optics Inc
- 14.2.15.1. Overview
- 14.2.15.2. Products
- 14.2.15.3. SWOT Analysis
- 14.2.15.4. Recent Developments
- 14.2.15.5. Financials (Based on Availability)
- 14.2.1 Omicron Electronics GmbH
List of Figures
- Figure 1: Global Distributed Temperature Sensing Industry Revenue Breakdown (Million, %) by Region 2024 & 2032
- Figure 2: North America Distributed Temperature Sensing Industry Revenue (Million), by Country 2024 & 2032
- Figure 3: North America Distributed Temperature Sensing Industry Revenue Share (%), by Country 2024 & 2032
- Figure 4: Europe Distributed Temperature Sensing Industry Revenue (Million), by Country 2024 & 2032
- Figure 5: Europe Distributed Temperature Sensing Industry Revenue Share (%), by Country 2024 & 2032
- Figure 6: Asia Pacific Distributed Temperature Sensing Industry Revenue (Million), by Country 2024 & 2032
- Figure 7: Asia Pacific Distributed Temperature Sensing Industry Revenue Share (%), by Country 2024 & 2032
- Figure 8: Rest of the World Distributed Temperature Sensing Industry Revenue (Million), by Country 2024 & 2032
- Figure 9: Rest of the World Distributed Temperature Sensing Industry Revenue Share (%), by Country 2024 & 2032
- Figure 10: North America Distributed Temperature Sensing Industry Revenue (Million), by Fiber Type 2024 & 2032
- Figure 11: North America Distributed Temperature Sensing Industry Revenue Share (%), by Fiber Type 2024 & 2032
- Figure 12: North America Distributed Temperature Sensing Industry Revenue (Million), by Application 2024 & 2032
- Figure 13: North America Distributed Temperature Sensing Industry Revenue Share (%), by Application 2024 & 2032
- Figure 14: North America Distributed Temperature Sensing Industry Revenue (Million), by Country 2024 & 2032
- Figure 15: North America Distributed Temperature Sensing Industry Revenue Share (%), by Country 2024 & 2032
- Figure 16: Europe Distributed Temperature Sensing Industry Revenue (Million), by Fiber Type 2024 & 2032
- Figure 17: Europe Distributed Temperature Sensing Industry Revenue Share (%), by Fiber Type 2024 & 2032
- Figure 18: Europe Distributed Temperature Sensing Industry Revenue (Million), by Application 2024 & 2032
- Figure 19: Europe Distributed Temperature Sensing Industry Revenue Share (%), by Application 2024 & 2032
- Figure 20: Europe Distributed Temperature Sensing Industry Revenue (Million), by Country 2024 & 2032
- Figure 21: Europe Distributed Temperature Sensing Industry Revenue Share (%), by Country 2024 & 2032
- Figure 22: Asia Pacific Distributed Temperature Sensing Industry Revenue (Million), by Fiber Type 2024 & 2032
- Figure 23: Asia Pacific Distributed Temperature Sensing Industry Revenue Share (%), by Fiber Type 2024 & 2032
- Figure 24: Asia Pacific Distributed Temperature Sensing Industry Revenue (Million), by Application 2024 & 2032
- Figure 25: Asia Pacific Distributed Temperature Sensing Industry Revenue Share (%), by Application 2024 & 2032
- Figure 26: Asia Pacific Distributed Temperature Sensing Industry Revenue (Million), by Country 2024 & 2032
- Figure 27: Asia Pacific Distributed Temperature Sensing Industry Revenue Share (%), by Country 2024 & 2032
- Figure 28: Rest of the World Distributed Temperature Sensing Industry Revenue (Million), by Fiber Type 2024 & 2032
- Figure 29: Rest of the World Distributed Temperature Sensing Industry Revenue Share (%), by Fiber Type 2024 & 2032
- Figure 30: Rest of the World Distributed Temperature Sensing Industry Revenue (Million), by Application 2024 & 2032
- Figure 31: Rest of the World Distributed Temperature Sensing Industry Revenue Share (%), by Application 2024 & 2032
- Figure 32: Rest of the World Distributed Temperature Sensing Industry Revenue (Million), by Country 2024 & 2032
- Figure 33: Rest of the World Distributed Temperature Sensing Industry Revenue Share (%), by Country 2024 & 2032
List of Tables
- Table 1: Global Distributed Temperature Sensing Industry Revenue Million Forecast, by Region 2019 & 2032
- Table 2: Global Distributed Temperature Sensing Industry Revenue Million Forecast, by Fiber Type 2019 & 2032
- Table 3: Global Distributed Temperature Sensing Industry Revenue Million Forecast, by Application 2019 & 2032
- Table 4: Global Distributed Temperature Sensing Industry Revenue Million Forecast, by Region 2019 & 2032
- Table 5: Global Distributed Temperature Sensing Industry Revenue Million Forecast, by Country 2019 & 2032
- Table 6: Distributed Temperature Sensing Industry Revenue (Million) Forecast, by Application 2019 & 2032
- Table 7: Global Distributed Temperature Sensing Industry Revenue Million Forecast, by Country 2019 & 2032
- Table 8: Distributed Temperature Sensing Industry Revenue (Million) Forecast, by Application 2019 & 2032
- Table 9: Global Distributed Temperature Sensing Industry Revenue Million Forecast, by Country 2019 & 2032
- Table 10: Distributed Temperature Sensing Industry Revenue (Million) Forecast, by Application 2019 & 2032
- Table 11: Global Distributed Temperature Sensing Industry Revenue Million Forecast, by Country 2019 & 2032
- Table 12: Distributed Temperature Sensing Industry Revenue (Million) Forecast, by Application 2019 & 2032
- Table 13: Global Distributed Temperature Sensing Industry Revenue Million Forecast, by Fiber Type 2019 & 2032
- Table 14: Global Distributed Temperature Sensing Industry Revenue Million Forecast, by Application 2019 & 2032
- Table 15: Global Distributed Temperature Sensing Industry Revenue Million Forecast, by Country 2019 & 2032
- Table 16: Global Distributed Temperature Sensing Industry Revenue Million Forecast, by Fiber Type 2019 & 2032
- Table 17: Global Distributed Temperature Sensing Industry Revenue Million Forecast, by Application 2019 & 2032
- Table 18: Global Distributed Temperature Sensing Industry Revenue Million Forecast, by Country 2019 & 2032
- Table 19: Global Distributed Temperature Sensing Industry Revenue Million Forecast, by Fiber Type 2019 & 2032
- Table 20: Global Distributed Temperature Sensing Industry Revenue Million Forecast, by Application 2019 & 2032
- Table 21: Global Distributed Temperature Sensing Industry Revenue Million Forecast, by Country 2019 & 2032
- Table 22: Global Distributed Temperature Sensing Industry Revenue Million Forecast, by Fiber Type 2019 & 2032
- Table 23: Global Distributed Temperature Sensing Industry Revenue Million Forecast, by Application 2019 & 2032
- Table 24: Global Distributed Temperature Sensing Industry Revenue Million Forecast, by Country 2019 & 2032
Frequently Asked Questions
1. What is the projected Compound Annual Growth Rate (CAGR) of the Distributed Temperature Sensing Industry?
The projected CAGR is approximately 7.00%.
2. Which companies are prominent players in the Distributed Temperature Sensing Industry?
Key companies in the market include Omicron Electronics GmbH, AP Sensing GmbH, OMICRON Electronics GmbH, Weatherford International PLC, GESO GmbH & Co, OFS Fitel LLC, Sensornet Limited*List Not Exhaustive, Bandweaver Technologies, Banner Engineering Corp, Halliburton Company, NKT Photonics, Yokogawa Electric Corporation, Schlumberger Limited, Sumitomo Electric Industries Ltd, Micron Optics Inc.
3. What are the main segments of the Distributed Temperature Sensing Industry?
The market segments include Fiber Type, Application.
4. Can you provide details about the market size?
The market size is estimated to be USD XX Million as of 2022.
5. What are some drivers contributing to market growth?
; Trustworthiness of DTS Systems/Sensors for Sensing & Monitoring Applications in Severe Environments; Growing Need for Labor Safety at Working Sites; Rising Applications in the Oil & Gas Industry.
6. What are the notable trends driving market growth?
Distributed Temperature Sensing Technology to have Major Application in Oil & Gas Production.
7. Are there any restraints impacting market growth?
; Optical Cables are Inclined to Physical Damage; High Costs Associated With DTS Systems.
8. Can you provide examples of recent developments in the market?
N/A
9. What pricing options are available for accessing the report?
Pricing options include single-user, multi-user, and enterprise licenses priced at USD 4750, USD 5250, and USD 8750 respectively.
10. Is the market size provided in terms of value or volume?
The market size is provided in terms of value, measured in Million.
11. Are there any specific market keywords associated with the report?
Yes, the market keyword associated with the report is "Distributed Temperature Sensing Industry," which aids in identifying and referencing the specific market segment covered.
12. How do I determine which pricing option suits my needs best?
The pricing options vary based on user requirements and access needs. Individual users may opt for single-user licenses, while businesses requiring broader access may choose multi-user or enterprise licenses for cost-effective access to the report.
13. Are there any additional resources or data provided in the Distributed Temperature Sensing Industry report?
While the report offers comprehensive insights, it's advisable to review the specific contents or supplementary materials provided to ascertain if additional resources or data are available.
14. How can I stay updated on further developments or reports in the Distributed Temperature Sensing Industry?
To stay informed about further developments, trends, and reports in the Distributed Temperature Sensing Industry, consider subscribing to industry newsletters, following relevant companies and organizations, or regularly checking reputable industry news sources and publications.
Methodology
Step 1 - Identification of Relevant Samples Size from Population Database


Step 2 - Approaches for Defining Global Market Size (Value, Volume* & Price*)

Note*: In applicable scenarios
Step 3 - Data Sources
Primary Research
- Web Analytics
- Survey Reports
- Research Institute
- Latest Research Reports
- Opinion Leaders
Secondary Research
- Annual Reports
- White Paper
- Latest Press Release
- Industry Association
- Paid Database
- Investor Presentations

Step 4 - Data Triangulation
Involves using different sources of information in order to increase the validity of a study
These sources are likely to be stakeholders in a program - participants, other researchers, program staff, other community members, and so on.
Then we put all data in single framework & apply various statistical tools to find out the dynamic on the market.
During the analysis stage, feedback from the stakeholder groups would be compared to determine areas of agreement as well as areas of divergence


