
Key Insights
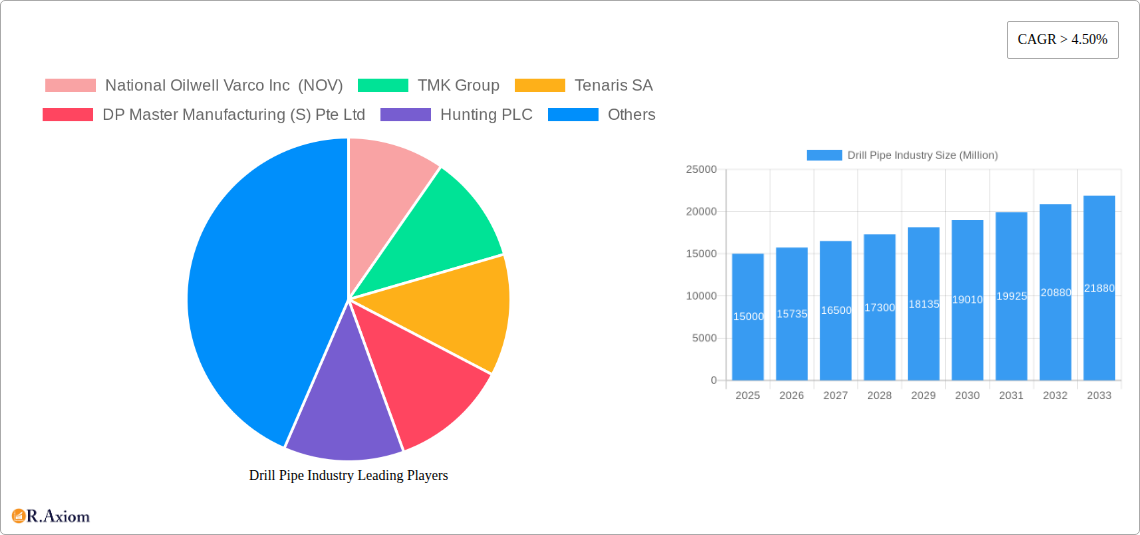
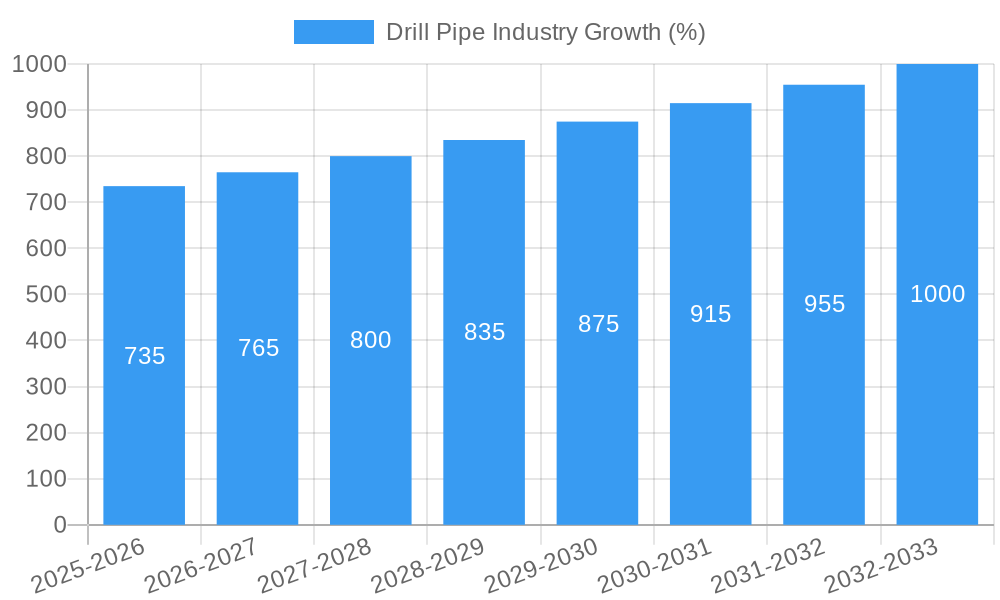
The global drill pipe market, valued at approximately $XX million in 2025, is experiencing robust growth, projected to maintain a Compound Annual Growth Rate (CAGR) exceeding 4.50% from 2025 to 2033. This expansion is fueled by several key drivers. Firstly, the increasing demand for oil and gas globally is driving exploration and production activities, necessitating a higher volume of drill pipes. Secondly, advancements in drilling technologies, such as horizontal drilling and hydraulic fracturing, require specialized drill pipes, stimulating market growth. The shift towards offshore drilling, particularly in deepwater environments, further contributes to the demand for high-quality, heavy-weight drill pipes. While supply chain disruptions and fluctuating commodity prices pose some restraints, the long-term outlook remains positive due to consistent energy demand and ongoing investments in the oil and gas sector. The market is segmented by type (standard drill pipe, heavy-weight drill pipe, drill collar) and deployment (onshore, offshore), with the offshore segment exhibiting faster growth owing to the complexities and higher technological demands of deepwater operations. Major players like National Oilwell Varco, TMK Group, and Tenaris are significantly shaping the market landscape through technological innovation and strategic partnerships. Regional analysis indicates strong growth in North America and Asia-Pacific, driven by significant exploration and production activities in these regions.
The market's segmentation reveals distinct growth trajectories. The heavy-weight drill pipe segment is expected to witness faster growth than the standard drill pipe segment due to its crucial role in deepwater and challenging drilling environments. The offshore deployment segment is also projected to experience higher growth, driven by the increasing focus on offshore oil and gas exploration and production. Geographic variations in growth are expected, with regions like North America and Asia-Pacific experiencing faster expansion due to robust oil and gas activities and substantial investments in exploration and production infrastructure. However, regions with stringent environmental regulations and fluctuating political landscapes may experience slower growth. Competitive pressures among major manufacturers are expected to intensify, prompting strategic alliances, mergers and acquisitions, and technological advancements to maintain market share and profitability. Overall, the market exhibits a strong positive outlook, shaped by global energy demand and technological advancements, despite facing challenges related to commodity prices and supply chain dynamics.
Drill Pipe Industry Market Report: 2019-2033
This comprehensive report provides an in-depth analysis of the global drill pipe industry, offering valuable insights for stakeholders including manufacturers, investors, and industry professionals. The report covers the period from 2019 to 2033, with a base year of 2025 and a forecast period of 2025-2033. The study analyzes market trends, competitive dynamics, technological advancements, and future growth opportunities, providing a detailed overview of this crucial sector within the oil and gas industry. The report projects a market value reaching xx Million by 2033, driven by factors such as increasing global energy demand and ongoing exploration activities.
Drill Pipe Industry Market Concentration & Innovation
The drill pipe industry exhibits a moderately concentrated market structure, with key players such as National Oilwell Varco Inc (NOV), TMK Group, and Tenaris SA holding significant market shares. However, several smaller, specialized manufacturers also contribute to the overall market. The market concentration is influenced by factors such as economies of scale, technological advancements, and the high capital investments required for manufacturing and distribution. Innovation in the industry primarily revolves around enhancing drill pipe performance, durability, and efficiency. This includes developing advanced materials, improving manufacturing processes, and incorporating technologies like advanced sensors and data analytics for predictive maintenance. Regulatory frameworks, particularly those related to safety and environmental protection, play a significant role in shaping the industry's landscape. Stringent regulations necessitate ongoing investments in research and development to meet compliance requirements. Substitutes for drill pipes are limited; however, advancements in directional drilling technologies and horizontal drilling techniques may influence the demand for certain types of drill pipes. Mergers and acquisitions (M&A) activities play a crucial role in shaping market concentration. Recent years have witnessed several notable M&A deals, with deal values ranging from xx Million to xx Million, contributing to both consolidation and expansion within the industry.
- Market Share (2024 Estimate): NOV (xx%), TMK Group (xx%), Tenaris SA (xx%), Others (xx%)
- Average M&A Deal Value (2019-2024): xx Million
- Number of M&A Deals (2019-2024): xx
Drill Pipe Industry Industry Trends & Insights
The global drill pipe industry has witnessed significant fluctuations in recent years, largely influenced by the volatility in oil and gas prices and global economic conditions. However, long-term growth prospects remain positive due to the persistent demand for oil and gas. The increasing exploration and production activities in various regions, particularly in shale gas reserves and deepwater projects, are fueling the demand for advanced drill pipes. Technological disruptions, such as the adoption of automation and digital technologies in drilling operations, are transforming the industry, leading to enhanced efficiency and reduced operational costs. Consumer preferences are shifting towards higher-performance, longer-lasting drill pipes with improved resistance to wear and tear. The industry is characterized by intense competition, with manufacturers constantly striving to differentiate their offerings through innovation and competitive pricing strategies. The Compound Annual Growth Rate (CAGR) for the drill pipe market during the historical period (2019-2024) is estimated at xx%, with the forecast period (2025-2033) projecting a CAGR of xx%. Market penetration is high in established oil and gas producing regions, but there are significant opportunities for growth in emerging markets.
Dominant Markets & Segments in Drill Pipe Industry
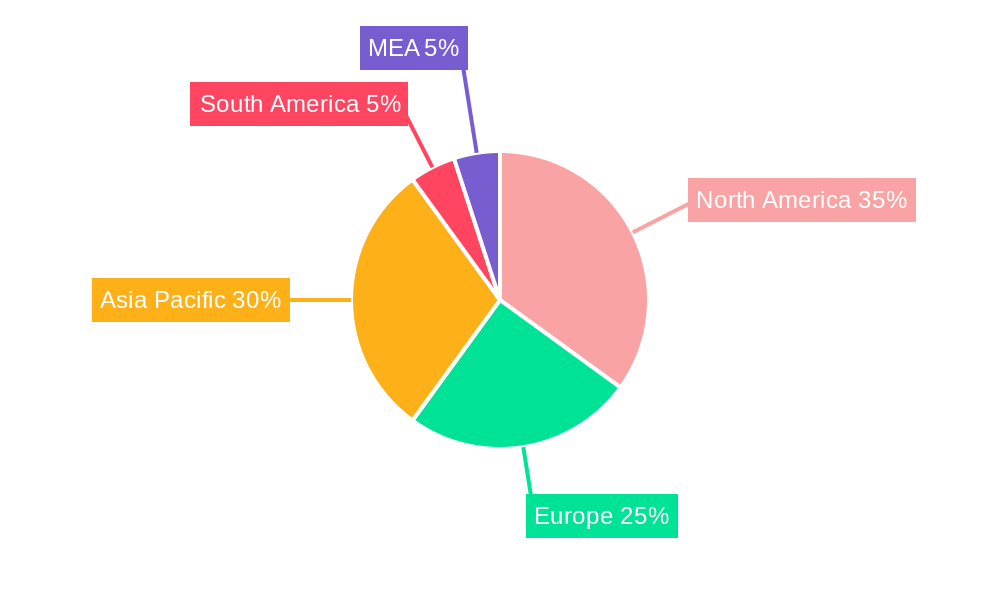
The North American region, particularly the United States, remains the dominant market for drill pipes, driven by the substantial shale gas production. However, significant growth is anticipated in regions such as the Middle East and Asia-Pacific, owing to ongoing exploration and production activities.
Key Drivers:
- North America (US): Abundant shale gas reserves, robust upstream investments.
- Middle East: Large oil reserves, substantial investments in oil and gas infrastructure.
- Asia-Pacific: Growing energy demand, increased exploration and production activities.
Segment Dominance:
- Type: Standard drill pipes continue to hold a significant market share, followed by heavy-weight drill pipes. Drill collars represent a smaller but specialized segment.
- Deployment: Onshore deployment remains dominant due to the larger number of land-based drilling operations. However, the offshore segment is expected to witness a faster growth rate, driven by increased deepwater exploration activities.
The dominance of these markets and segments is based on several factors, including the availability of resources, government policies, and infrastructure development.
Drill Pipe Industry Product Developments
Recent product innovations in the drill pipe industry focus on enhancing performance, durability, and safety. Manufacturers are developing advanced materials with increased strength and resistance to corrosion, improving the longevity and efficiency of drill pipes. The integration of smart sensors and data analytics allows for real-time monitoring of drill pipe conditions, enabling predictive maintenance and reducing downtime. These advancements offer significant competitive advantages by reducing operational costs and improving the overall drilling process. This aligns well with industry demands for efficient and sustainable drilling operations.
Report Scope & Segmentation Analysis
This report segments the drill pipe market based on type (Standard Drill Pipe, Heavy Weight Drill Pipe, Drill Collar) and deployment (Onshore, Offshore).
- Standard Drill Pipe: This segment is projected to experience steady growth due to its widespread application in conventional drilling operations. Market size is xx Million in 2025.
- Heavy Weight Drill Pipe: This segment is expected to see substantial growth driven by increasing deepwater drilling activities. Market size is xx Million in 2025.
- Drill Collar: The Drill Collar segment will have a smaller market size than others, primarily due to its specialized usage in drilling. Market size is xx Million in 2025.
- Onshore: This segment holds the largest market share due to the prevalence of onshore drilling. Market size is xx Million in 2025.
- Offshore: The offshore segment is expected to demonstrate robust growth, driven by deepwater exploration. Market size is xx Million in 2025.
Key Drivers of Drill Pipe Industry Growth
The growth of the drill pipe industry is propelled by several key factors. Firstly, the increasing global demand for energy fuels exploration and production activities, driving the need for drill pipes. Secondly, technological advancements resulting in higher-performance drill pipes enhance drilling efficiency and reduce operational costs. Finally, supportive government policies in various regions promoting oil and gas exploration contribute to market expansion. For example, the significant investment by PetroChina in shale gas development in China showcases this driver.
Challenges in the Drill Pipe Industry Sector
The drill pipe industry faces several challenges. Fluctuations in oil and gas prices create uncertainty and affect investment decisions. Supply chain disruptions, especially in times of geopolitical instability, can impact the availability of raw materials and manufacturing capabilities. Intense competition among manufacturers leads to price pressure and necessitates continuous innovation to maintain a competitive edge. Further, stringent environmental regulations add complexity to operations and increase compliance costs.
Emerging Opportunities in Drill Pipe Industry
The industry presents significant opportunities. The growth of renewable energy resources while still relying on traditional fossil fuels provides a sustainable approach to energy production. Technological advancements, such as the development of smart drill pipes with integrated sensors and data analytics, offer enhanced efficiency and optimization potentials. Furthermore, exploration in previously untapped regions and deepwater projects presents new market avenues for drill pipe manufacturers.
Leading Players in the Drill Pipe Industry Market
- National Oilwell Varco Inc (NOV)
- TMK Group
- Tenaris SA
- DP Master Manufacturing (S) Pte Ltd
- Hunting PLC
- International Drilling Services Ltd (IDS)
- Challenger International Inc
- Tejas Tubular Products Inc
- Hilong Group
- Workstrings International
- Texas Steel Conversion Inc (TSC)
- Oil Country Tubular Limited
- Drill pipe international LLC
Key Developments in Drill Pipe Industry Industry
- September 2021: PetroChina's planned investment of billions of dollars in shale oil and gas development in Northeast China signifies a major boost to drill pipe demand.
- February 2022: The discovery of a new oil block in Barmer, India, by Vedanta-Cairn, indicates potential for increased drilling activity and demand for drill pipes in the region.
Strategic Outlook for Drill Pipe Industry Market
The future of the drill pipe industry appears promising, driven by sustained global energy demand, technological advancements, and exploration activities in new and established regions. Opportunities exist in developing and deploying advanced materials, incorporating digital technologies, and expanding into emerging markets. Companies that can adapt to evolving market dynamics, invest in research and development, and offer innovative solutions are poised to capture significant market share.
Drill Pipe Industry Segmentation
-
1. Type
- 1.1. Standard Drill Pipe
- 1.2. Heavy Weight Drill Pipe
- 1.3. Drill Collar
-
2. Deployment
- 2.1. Onshore
- 2.2. Offshore
Drill Pipe Industry Segmentation By Geography
- 1. North America
- 2. Europe
- 3. Asia Pacific
- 4. South America
- 5. Middle East and Africa
Drill Pipe Industry REPORT HIGHLIGHTS
| Aspects | Details |
|---|---|
| Study Period | 2019-2033 |
| Base Year | 2024 |
| Estimated Year | 2025 |
| Forecast Period | 2025-2033 |
| Historical Period | 2019-2024 |
| Growth Rate | CAGR of > 4.50% from 2019-2033 |
| Segmentation |
|
Table of Contents
- 1. Introduction
- 1.1. Research Scope
- 1.2. Market Segmentation
- 1.3. Research Methodology
- 1.4. Definitions and Assumptions
- 2. Executive Summary
- 2.1. Introduction
- 3. Market Dynamics
- 3.1. Introduction
- 3.2. Market Drivers
- 3.2.1. 4.; Uninterrupted and Reliable Power Supply and Heavy Deployment of DG (diesel generator) Set4.; Improvement in Technology of Diesel Generator
- 3.3. Market Restrains
- 3.3.1. 4.; The Growing Trend of Renewable Power Generation
- 3.4. Market Trends
- 3.4.1. Onshore to Dominate the Market
- 4. Market Factor Analysis
- 4.1. Porters Five Forces
- 4.2. Supply/Value Chain
- 4.3. PESTEL analysis
- 4.4. Market Entropy
- 4.5. Patent/Trademark Analysis
- 5. Global Drill Pipe Industry Analysis, Insights and Forecast, 2019-2031
- 5.1. Market Analysis, Insights and Forecast - by Type
- 5.1.1. Standard Drill Pipe
- 5.1.2. Heavy Weight Drill Pipe
- 5.1.3. Drill Collar
- 5.2. Market Analysis, Insights and Forecast - by Deployment
- 5.2.1. Onshore
- 5.2.2. Offshore
- 5.3. Market Analysis, Insights and Forecast - by Region
- 5.3.1. North America
- 5.3.2. Europe
- 5.3.3. Asia Pacific
- 5.3.4. South America
- 5.3.5. Middle East and Africa
- 5.1. Market Analysis, Insights and Forecast - by Type
- 6. North America Drill Pipe Industry Analysis, Insights and Forecast, 2019-2031
- 6.1. Market Analysis, Insights and Forecast - by Type
- 6.1.1. Standard Drill Pipe
- 6.1.2. Heavy Weight Drill Pipe
- 6.1.3. Drill Collar
- 6.2. Market Analysis, Insights and Forecast - by Deployment
- 6.2.1. Onshore
- 6.2.2. Offshore
- 6.1. Market Analysis, Insights and Forecast - by Type
- 7. Europe Drill Pipe Industry Analysis, Insights and Forecast, 2019-2031
- 7.1. Market Analysis, Insights and Forecast - by Type
- 7.1.1. Standard Drill Pipe
- 7.1.2. Heavy Weight Drill Pipe
- 7.1.3. Drill Collar
- 7.2. Market Analysis, Insights and Forecast - by Deployment
- 7.2.1. Onshore
- 7.2.2. Offshore
- 7.1. Market Analysis, Insights and Forecast - by Type
- 8. Asia Pacific Drill Pipe Industry Analysis, Insights and Forecast, 2019-2031
- 8.1. Market Analysis, Insights and Forecast - by Type
- 8.1.1. Standard Drill Pipe
- 8.1.2. Heavy Weight Drill Pipe
- 8.1.3. Drill Collar
- 8.2. Market Analysis, Insights and Forecast - by Deployment
- 8.2.1. Onshore
- 8.2.2. Offshore
- 8.1. Market Analysis, Insights and Forecast - by Type
- 9. South America Drill Pipe Industry Analysis, Insights and Forecast, 2019-2031
- 9.1. Market Analysis, Insights and Forecast - by Type
- 9.1.1. Standard Drill Pipe
- 9.1.2. Heavy Weight Drill Pipe
- 9.1.3. Drill Collar
- 9.2. Market Analysis, Insights and Forecast - by Deployment
- 9.2.1. Onshore
- 9.2.2. Offshore
- 9.1. Market Analysis, Insights and Forecast - by Type
- 10. Middle East and Africa Drill Pipe Industry Analysis, Insights and Forecast, 2019-2031
- 10.1. Market Analysis, Insights and Forecast - by Type
- 10.1.1. Standard Drill Pipe
- 10.1.2. Heavy Weight Drill Pipe
- 10.1.3. Drill Collar
- 10.2. Market Analysis, Insights and Forecast - by Deployment
- 10.2.1. Onshore
- 10.2.2. Offshore
- 10.1. Market Analysis, Insights and Forecast - by Type
- 11. North America Drill Pipe Industry Analysis, Insights and Forecast, 2019-2031
- 11.1. Market Analysis, Insights and Forecast - By Country/Sub-region
- 11.1.1 United States
- 11.1.2 Canada
- 11.1.3 Mexico
- 12. Europe Drill Pipe Industry Analysis, Insights and Forecast, 2019-2031
- 12.1. Market Analysis, Insights and Forecast - By Country/Sub-region
- 12.1.1 Germany
- 12.1.2 United Kingdom
- 12.1.3 France
- 12.1.4 Spain
- 12.1.5 Italy
- 12.1.6 Spain
- 12.1.7 Belgium
- 12.1.8 Netherland
- 12.1.9 Nordics
- 12.1.10 Rest of Europe
- 13. Asia Pacific Drill Pipe Industry Analysis, Insights and Forecast, 2019-2031
- 13.1. Market Analysis, Insights and Forecast - By Country/Sub-region
- 13.1.1 China
- 13.1.2 Japan
- 13.1.3 India
- 13.1.4 South Korea
- 13.1.5 Southeast Asia
- 13.1.6 Australia
- 13.1.7 Indonesia
- 13.1.8 Phillipes
- 13.1.9 Singapore
- 13.1.10 Thailandc
- 13.1.11 Rest of Asia Pacific
- 14. South America Drill Pipe Industry Analysis, Insights and Forecast, 2019-2031
- 14.1. Market Analysis, Insights and Forecast - By Country/Sub-region
- 14.1.1 Brazil
- 14.1.2 Argentina
- 14.1.3 Peru
- 14.1.4 Chile
- 14.1.5 Colombia
- 14.1.6 Ecuador
- 14.1.7 Venezuela
- 14.1.8 Rest of South America
- 15. MEA Drill Pipe Industry Analysis, Insights and Forecast, 2019-2031
- 15.1. Market Analysis, Insights and Forecast - By Country/Sub-region
- 15.1.1 United Arab Emirates
- 15.1.2 Saudi Arabia
- 15.1.3 South Africa
- 15.1.4 Rest of Middle East and Africa
- 16. Competitive Analysis
- 16.1. Global Market Share Analysis 2024
- 16.2. Company Profiles
- 16.2.1 National Oilwell Varco Inc (NOV)
- 16.2.1.1. Overview
- 16.2.1.2. Products
- 16.2.1.3. SWOT Analysis
- 16.2.1.4. Recent Developments
- 16.2.1.5. Financials (Based on Availability)
- 16.2.2 TMK Group
- 16.2.2.1. Overview
- 16.2.2.2. Products
- 16.2.2.3. SWOT Analysis
- 16.2.2.4. Recent Developments
- 16.2.2.5. Financials (Based on Availability)
- 16.2.3 Tenaris SA
- 16.2.3.1. Overview
- 16.2.3.2. Products
- 16.2.3.3. SWOT Analysis
- 16.2.3.4. Recent Developments
- 16.2.3.5. Financials (Based on Availability)
- 16.2.4 DP Master Manufacturing (S) Pte Ltd
- 16.2.4.1. Overview
- 16.2.4.2. Products
- 16.2.4.3. SWOT Analysis
- 16.2.4.4. Recent Developments
- 16.2.4.5. Financials (Based on Availability)
- 16.2.5 Hunting PLC
- 16.2.5.1. Overview
- 16.2.5.2. Products
- 16.2.5.3. SWOT Analysis
- 16.2.5.4. Recent Developments
- 16.2.5.5. Financials (Based on Availability)
- 16.2.6 International Drilling Services Ltd (IDS)
- 16.2.6.1. Overview
- 16.2.6.2. Products
- 16.2.6.3. SWOT Analysis
- 16.2.6.4. Recent Developments
- 16.2.6.5. Financials (Based on Availability)
- 16.2.7 Challenger International Inc
- 16.2.7.1. Overview
- 16.2.7.2. Products
- 16.2.7.3. SWOT Analysis
- 16.2.7.4. Recent Developments
- 16.2.7.5. Financials (Based on Availability)
- 16.2.8 Tejas Tubular Products Inc
- 16.2.8.1. Overview
- 16.2.8.2. Products
- 16.2.8.3. SWOT Analysis
- 16.2.8.4. Recent Developments
- 16.2.8.5. Financials (Based on Availability)
- 16.2.9 Hilong Group
- 16.2.9.1. Overview
- 16.2.9.2. Products
- 16.2.9.3. SWOT Analysis
- 16.2.9.4. Recent Developments
- 16.2.9.5. Financials (Based on Availability)
- 16.2.10 Workstrings International
- 16.2.10.1. Overview
- 16.2.10.2. Products
- 16.2.10.3. SWOT Analysis
- 16.2.10.4. Recent Developments
- 16.2.10.5. Financials (Based on Availability)
- 16.2.11 Texas Steel Conversion Inc (TSC)
- 16.2.11.1. Overview
- 16.2.11.2. Products
- 16.2.11.3. SWOT Analysis
- 16.2.11.4. Recent Developments
- 16.2.11.5. Financials (Based on Availability)
- 16.2.12 Oil Country Tubular Limited
- 16.2.12.1. Overview
- 16.2.12.2. Products
- 16.2.12.3. SWOT Analysis
- 16.2.12.4. Recent Developments
- 16.2.12.5. Financials (Based on Availability)
- 16.2.13 Drill pipe international LLC
- 16.2.13.1. Overview
- 16.2.13.2. Products
- 16.2.13.3. SWOT Analysis
- 16.2.13.4. Recent Developments
- 16.2.13.5. Financials (Based on Availability)
- 16.2.1 National Oilwell Varco Inc (NOV)
List of Figures
- Figure 1: Global Drill Pipe Industry Revenue Breakdown (Million, %) by Region 2024 & 2032
- Figure 2: Global Drill Pipe Industry Volume Breakdown (Tonnes, %) by Region 2024 & 2032
- Figure 3: North America Drill Pipe Industry Revenue (Million), by Country 2024 & 2032
- Figure 4: North America Drill Pipe Industry Volume (Tonnes), by Country 2024 & 2032
- Figure 5: North America Drill Pipe Industry Revenue Share (%), by Country 2024 & 2032
- Figure 6: North America Drill Pipe Industry Volume Share (%), by Country 2024 & 2032
- Figure 7: Europe Drill Pipe Industry Revenue (Million), by Country 2024 & 2032
- Figure 8: Europe Drill Pipe Industry Volume (Tonnes), by Country 2024 & 2032
- Figure 9: Europe Drill Pipe Industry Revenue Share (%), by Country 2024 & 2032
- Figure 10: Europe Drill Pipe Industry Volume Share (%), by Country 2024 & 2032
- Figure 11: Asia Pacific Drill Pipe Industry Revenue (Million), by Country 2024 & 2032
- Figure 12: Asia Pacific Drill Pipe Industry Volume (Tonnes), by Country 2024 & 2032
- Figure 13: Asia Pacific Drill Pipe Industry Revenue Share (%), by Country 2024 & 2032
- Figure 14: Asia Pacific Drill Pipe Industry Volume Share (%), by Country 2024 & 2032
- Figure 15: South America Drill Pipe Industry Revenue (Million), by Country 2024 & 2032
- Figure 16: South America Drill Pipe Industry Volume (Tonnes), by Country 2024 & 2032
- Figure 17: South America Drill Pipe Industry Revenue Share (%), by Country 2024 & 2032
- Figure 18: South America Drill Pipe Industry Volume Share (%), by Country 2024 & 2032
- Figure 19: MEA Drill Pipe Industry Revenue (Million), by Country 2024 & 2032
- Figure 20: MEA Drill Pipe Industry Volume (Tonnes), by Country 2024 & 2032
- Figure 21: MEA Drill Pipe Industry Revenue Share (%), by Country 2024 & 2032
- Figure 22: MEA Drill Pipe Industry Volume Share (%), by Country 2024 & 2032
- Figure 23: North America Drill Pipe Industry Revenue (Million), by Type 2024 & 2032
- Figure 24: North America Drill Pipe Industry Volume (Tonnes), by Type 2024 & 2032
- Figure 25: North America Drill Pipe Industry Revenue Share (%), by Type 2024 & 2032
- Figure 26: North America Drill Pipe Industry Volume Share (%), by Type 2024 & 2032
- Figure 27: North America Drill Pipe Industry Revenue (Million), by Deployment 2024 & 2032
- Figure 28: North America Drill Pipe Industry Volume (Tonnes), by Deployment 2024 & 2032
- Figure 29: North America Drill Pipe Industry Revenue Share (%), by Deployment 2024 & 2032
- Figure 30: North America Drill Pipe Industry Volume Share (%), by Deployment 2024 & 2032
- Figure 31: North America Drill Pipe Industry Revenue (Million), by Country 2024 & 2032
- Figure 32: North America Drill Pipe Industry Volume (Tonnes), by Country 2024 & 2032
- Figure 33: North America Drill Pipe Industry Revenue Share (%), by Country 2024 & 2032
- Figure 34: North America Drill Pipe Industry Volume Share (%), by Country 2024 & 2032
- Figure 35: Europe Drill Pipe Industry Revenue (Million), by Type 2024 & 2032
- Figure 36: Europe Drill Pipe Industry Volume (Tonnes), by Type 2024 & 2032
- Figure 37: Europe Drill Pipe Industry Revenue Share (%), by Type 2024 & 2032
- Figure 38: Europe Drill Pipe Industry Volume Share (%), by Type 2024 & 2032
- Figure 39: Europe Drill Pipe Industry Revenue (Million), by Deployment 2024 & 2032
- Figure 40: Europe Drill Pipe Industry Volume (Tonnes), by Deployment 2024 & 2032
- Figure 41: Europe Drill Pipe Industry Revenue Share (%), by Deployment 2024 & 2032
- Figure 42: Europe Drill Pipe Industry Volume Share (%), by Deployment 2024 & 2032
- Figure 43: Europe Drill Pipe Industry Revenue (Million), by Country 2024 & 2032
- Figure 44: Europe Drill Pipe Industry Volume (Tonnes), by Country 2024 & 2032
- Figure 45: Europe Drill Pipe Industry Revenue Share (%), by Country 2024 & 2032
- Figure 46: Europe Drill Pipe Industry Volume Share (%), by Country 2024 & 2032
- Figure 47: Asia Pacific Drill Pipe Industry Revenue (Million), by Type 2024 & 2032
- Figure 48: Asia Pacific Drill Pipe Industry Volume (Tonnes), by Type 2024 & 2032
- Figure 49: Asia Pacific Drill Pipe Industry Revenue Share (%), by Type 2024 & 2032
- Figure 50: Asia Pacific Drill Pipe Industry Volume Share (%), by Type 2024 & 2032
- Figure 51: Asia Pacific Drill Pipe Industry Revenue (Million), by Deployment 2024 & 2032
- Figure 52: Asia Pacific Drill Pipe Industry Volume (Tonnes), by Deployment 2024 & 2032
- Figure 53: Asia Pacific Drill Pipe Industry Revenue Share (%), by Deployment 2024 & 2032
- Figure 54: Asia Pacific Drill Pipe Industry Volume Share (%), by Deployment 2024 & 2032
- Figure 55: Asia Pacific Drill Pipe Industry Revenue (Million), by Country 2024 & 2032
- Figure 56: Asia Pacific Drill Pipe Industry Volume (Tonnes), by Country 2024 & 2032
- Figure 57: Asia Pacific Drill Pipe Industry Revenue Share (%), by Country 2024 & 2032
- Figure 58: Asia Pacific Drill Pipe Industry Volume Share (%), by Country 2024 & 2032
- Figure 59: South America Drill Pipe Industry Revenue (Million), by Type 2024 & 2032
- Figure 60: South America Drill Pipe Industry Volume (Tonnes), by Type 2024 & 2032
- Figure 61: South America Drill Pipe Industry Revenue Share (%), by Type 2024 & 2032
- Figure 62: South America Drill Pipe Industry Volume Share (%), by Type 2024 & 2032
- Figure 63: South America Drill Pipe Industry Revenue (Million), by Deployment 2024 & 2032
- Figure 64: South America Drill Pipe Industry Volume (Tonnes), by Deployment 2024 & 2032
- Figure 65: South America Drill Pipe Industry Revenue Share (%), by Deployment 2024 & 2032
- Figure 66: South America Drill Pipe Industry Volume Share (%), by Deployment 2024 & 2032
- Figure 67: South America Drill Pipe Industry Revenue (Million), by Country 2024 & 2032
- Figure 68: South America Drill Pipe Industry Volume (Tonnes), by Country 2024 & 2032
- Figure 69: South America Drill Pipe Industry Revenue Share (%), by Country 2024 & 2032
- Figure 70: South America Drill Pipe Industry Volume Share (%), by Country 2024 & 2032
- Figure 71: Middle East and Africa Drill Pipe Industry Revenue (Million), by Type 2024 & 2032
- Figure 72: Middle East and Africa Drill Pipe Industry Volume (Tonnes), by Type 2024 & 2032
- Figure 73: Middle East and Africa Drill Pipe Industry Revenue Share (%), by Type 2024 & 2032
- Figure 74: Middle East and Africa Drill Pipe Industry Volume Share (%), by Type 2024 & 2032
- Figure 75: Middle East and Africa Drill Pipe Industry Revenue (Million), by Deployment 2024 & 2032
- Figure 76: Middle East and Africa Drill Pipe Industry Volume (Tonnes), by Deployment 2024 & 2032
- Figure 77: Middle East and Africa Drill Pipe Industry Revenue Share (%), by Deployment 2024 & 2032
- Figure 78: Middle East and Africa Drill Pipe Industry Volume Share (%), by Deployment 2024 & 2032
- Figure 79: Middle East and Africa Drill Pipe Industry Revenue (Million), by Country 2024 & 2032
- Figure 80: Middle East and Africa Drill Pipe Industry Volume (Tonnes), by Country 2024 & 2032
- Figure 81: Middle East and Africa Drill Pipe Industry Revenue Share (%), by Country 2024 & 2032
- Figure 82: Middle East and Africa Drill Pipe Industry Volume Share (%), by Country 2024 & 2032
List of Tables
- Table 1: Global Drill Pipe Industry Revenue Million Forecast, by Region 2019 & 2032
- Table 2: Global Drill Pipe Industry Volume Tonnes Forecast, by Region 2019 & 2032
- Table 3: Global Drill Pipe Industry Revenue Million Forecast, by Type 2019 & 2032
- Table 4: Global Drill Pipe Industry Volume Tonnes Forecast, by Type 2019 & 2032
- Table 5: Global Drill Pipe Industry Revenue Million Forecast, by Deployment 2019 & 2032
- Table 6: Global Drill Pipe Industry Volume Tonnes Forecast, by Deployment 2019 & 2032
- Table 7: Global Drill Pipe Industry Revenue Million Forecast, by Region 2019 & 2032
- Table 8: Global Drill Pipe Industry Volume Tonnes Forecast, by Region 2019 & 2032
- Table 9: Global Drill Pipe Industry Revenue Million Forecast, by Country 2019 & 2032
- Table 10: Global Drill Pipe Industry Volume Tonnes Forecast, by Country 2019 & 2032
- Table 11: United States Drill Pipe Industry Revenue (Million) Forecast, by Application 2019 & 2032
- Table 12: United States Drill Pipe Industry Volume (Tonnes) Forecast, by Application 2019 & 2032
- Table 13: Canada Drill Pipe Industry Revenue (Million) Forecast, by Application 2019 & 2032
- Table 14: Canada Drill Pipe Industry Volume (Tonnes) Forecast, by Application 2019 & 2032
- Table 15: Mexico Drill Pipe Industry Revenue (Million) Forecast, by Application 2019 & 2032
- Table 16: Mexico Drill Pipe Industry Volume (Tonnes) Forecast, by Application 2019 & 2032
- Table 17: Global Drill Pipe Industry Revenue Million Forecast, by Country 2019 & 2032
- Table 18: Global Drill Pipe Industry Volume Tonnes Forecast, by Country 2019 & 2032
- Table 19: Germany Drill Pipe Industry Revenue (Million) Forecast, by Application 2019 & 2032
- Table 20: Germany Drill Pipe Industry Volume (Tonnes) Forecast, by Application 2019 & 2032
- Table 21: United Kingdom Drill Pipe Industry Revenue (Million) Forecast, by Application 2019 & 2032
- Table 22: United Kingdom Drill Pipe Industry Volume (Tonnes) Forecast, by Application 2019 & 2032
- Table 23: France Drill Pipe Industry Revenue (Million) Forecast, by Application 2019 & 2032
- Table 24: France Drill Pipe Industry Volume (Tonnes) Forecast, by Application 2019 & 2032
- Table 25: Spain Drill Pipe Industry Revenue (Million) Forecast, by Application 2019 & 2032
- Table 26: Spain Drill Pipe Industry Volume (Tonnes) Forecast, by Application 2019 & 2032
- Table 27: Italy Drill Pipe Industry Revenue (Million) Forecast, by Application 2019 & 2032
- Table 28: Italy Drill Pipe Industry Volume (Tonnes) Forecast, by Application 2019 & 2032
- Table 29: Spain Drill Pipe Industry Revenue (Million) Forecast, by Application 2019 & 2032
- Table 30: Spain Drill Pipe Industry Volume (Tonnes) Forecast, by Application 2019 & 2032
- Table 31: Belgium Drill Pipe Industry Revenue (Million) Forecast, by Application 2019 & 2032
- Table 32: Belgium Drill Pipe Industry Volume (Tonnes) Forecast, by Application 2019 & 2032
- Table 33: Netherland Drill Pipe Industry Revenue (Million) Forecast, by Application 2019 & 2032
- Table 34: Netherland Drill Pipe Industry Volume (Tonnes) Forecast, by Application 2019 & 2032
- Table 35: Nordics Drill Pipe Industry Revenue (Million) Forecast, by Application 2019 & 2032
- Table 36: Nordics Drill Pipe Industry Volume (Tonnes) Forecast, by Application 2019 & 2032
- Table 37: Rest of Europe Drill Pipe Industry Revenue (Million) Forecast, by Application 2019 & 2032
- Table 38: Rest of Europe Drill Pipe Industry Volume (Tonnes) Forecast, by Application 2019 & 2032
- Table 39: Global Drill Pipe Industry Revenue Million Forecast, by Country 2019 & 2032
- Table 40: Global Drill Pipe Industry Volume Tonnes Forecast, by Country 2019 & 2032
- Table 41: China Drill Pipe Industry Revenue (Million) Forecast, by Application 2019 & 2032
- Table 42: China Drill Pipe Industry Volume (Tonnes) Forecast, by Application 2019 & 2032
- Table 43: Japan Drill Pipe Industry Revenue (Million) Forecast, by Application 2019 & 2032
- Table 44: Japan Drill Pipe Industry Volume (Tonnes) Forecast, by Application 2019 & 2032
- Table 45: India Drill Pipe Industry Revenue (Million) Forecast, by Application 2019 & 2032
- Table 46: India Drill Pipe Industry Volume (Tonnes) Forecast, by Application 2019 & 2032
- Table 47: South Korea Drill Pipe Industry Revenue (Million) Forecast, by Application 2019 & 2032
- Table 48: South Korea Drill Pipe Industry Volume (Tonnes) Forecast, by Application 2019 & 2032
- Table 49: Southeast Asia Drill Pipe Industry Revenue (Million) Forecast, by Application 2019 & 2032
- Table 50: Southeast Asia Drill Pipe Industry Volume (Tonnes) Forecast, by Application 2019 & 2032
- Table 51: Australia Drill Pipe Industry Revenue (Million) Forecast, by Application 2019 & 2032
- Table 52: Australia Drill Pipe Industry Volume (Tonnes) Forecast, by Application 2019 & 2032
- Table 53: Indonesia Drill Pipe Industry Revenue (Million) Forecast, by Application 2019 & 2032
- Table 54: Indonesia Drill Pipe Industry Volume (Tonnes) Forecast, by Application 2019 & 2032
- Table 55: Phillipes Drill Pipe Industry Revenue (Million) Forecast, by Application 2019 & 2032
- Table 56: Phillipes Drill Pipe Industry Volume (Tonnes) Forecast, by Application 2019 & 2032
- Table 57: Singapore Drill Pipe Industry Revenue (Million) Forecast, by Application 2019 & 2032
- Table 58: Singapore Drill Pipe Industry Volume (Tonnes) Forecast, by Application 2019 & 2032
- Table 59: Thailandc Drill Pipe Industry Revenue (Million) Forecast, by Application 2019 & 2032
- Table 60: Thailandc Drill Pipe Industry Volume (Tonnes) Forecast, by Application 2019 & 2032
- Table 61: Rest of Asia Pacific Drill Pipe Industry Revenue (Million) Forecast, by Application 2019 & 2032
- Table 62: Rest of Asia Pacific Drill Pipe Industry Volume (Tonnes) Forecast, by Application 2019 & 2032
- Table 63: Global Drill Pipe Industry Revenue Million Forecast, by Country 2019 & 2032
- Table 64: Global Drill Pipe Industry Volume Tonnes Forecast, by Country 2019 & 2032
- Table 65: Brazil Drill Pipe Industry Revenue (Million) Forecast, by Application 2019 & 2032
- Table 66: Brazil Drill Pipe Industry Volume (Tonnes) Forecast, by Application 2019 & 2032
- Table 67: Argentina Drill Pipe Industry Revenue (Million) Forecast, by Application 2019 & 2032
- Table 68: Argentina Drill Pipe Industry Volume (Tonnes) Forecast, by Application 2019 & 2032
- Table 69: Peru Drill Pipe Industry Revenue (Million) Forecast, by Application 2019 & 2032
- Table 70: Peru Drill Pipe Industry Volume (Tonnes) Forecast, by Application 2019 & 2032
- Table 71: Chile Drill Pipe Industry Revenue (Million) Forecast, by Application 2019 & 2032
- Table 72: Chile Drill Pipe Industry Volume (Tonnes) Forecast, by Application 2019 & 2032
- Table 73: Colombia Drill Pipe Industry Revenue (Million) Forecast, by Application 2019 & 2032
- Table 74: Colombia Drill Pipe Industry Volume (Tonnes) Forecast, by Application 2019 & 2032
- Table 75: Ecuador Drill Pipe Industry Revenue (Million) Forecast, by Application 2019 & 2032
- Table 76: Ecuador Drill Pipe Industry Volume (Tonnes) Forecast, by Application 2019 & 2032
- Table 77: Venezuela Drill Pipe Industry Revenue (Million) Forecast, by Application 2019 & 2032
- Table 78: Venezuela Drill Pipe Industry Volume (Tonnes) Forecast, by Application 2019 & 2032
- Table 79: Rest of South America Drill Pipe Industry Revenue (Million) Forecast, by Application 2019 & 2032
- Table 80: Rest of South America Drill Pipe Industry Volume (Tonnes) Forecast, by Application 2019 & 2032
- Table 81: Global Drill Pipe Industry Revenue Million Forecast, by Country 2019 & 2032
- Table 82: Global Drill Pipe Industry Volume Tonnes Forecast, by Country 2019 & 2032
- Table 83: United Arab Emirates Drill Pipe Industry Revenue (Million) Forecast, by Application 2019 & 2032
- Table 84: United Arab Emirates Drill Pipe Industry Volume (Tonnes) Forecast, by Application 2019 & 2032
- Table 85: Saudi Arabia Drill Pipe Industry Revenue (Million) Forecast, by Application 2019 & 2032
- Table 86: Saudi Arabia Drill Pipe Industry Volume (Tonnes) Forecast, by Application 2019 & 2032
- Table 87: South Africa Drill Pipe Industry Revenue (Million) Forecast, by Application 2019 & 2032
- Table 88: South Africa Drill Pipe Industry Volume (Tonnes) Forecast, by Application 2019 & 2032
- Table 89: Rest of Middle East and Africa Drill Pipe Industry Revenue (Million) Forecast, by Application 2019 & 2032
- Table 90: Rest of Middle East and Africa Drill Pipe Industry Volume (Tonnes) Forecast, by Application 2019 & 2032
- Table 91: Global Drill Pipe Industry Revenue Million Forecast, by Type 2019 & 2032
- Table 92: Global Drill Pipe Industry Volume Tonnes Forecast, by Type 2019 & 2032
- Table 93: Global Drill Pipe Industry Revenue Million Forecast, by Deployment 2019 & 2032
- Table 94: Global Drill Pipe Industry Volume Tonnes Forecast, by Deployment 2019 & 2032
- Table 95: Global Drill Pipe Industry Revenue Million Forecast, by Country 2019 & 2032
- Table 96: Global Drill Pipe Industry Volume Tonnes Forecast, by Country 2019 & 2032
- Table 97: Global Drill Pipe Industry Revenue Million Forecast, by Type 2019 & 2032
- Table 98: Global Drill Pipe Industry Volume Tonnes Forecast, by Type 2019 & 2032
- Table 99: Global Drill Pipe Industry Revenue Million Forecast, by Deployment 2019 & 2032
- Table 100: Global Drill Pipe Industry Volume Tonnes Forecast, by Deployment 2019 & 2032
- Table 101: Global Drill Pipe Industry Revenue Million Forecast, by Country 2019 & 2032
- Table 102: Global Drill Pipe Industry Volume Tonnes Forecast, by Country 2019 & 2032
- Table 103: Global Drill Pipe Industry Revenue Million Forecast, by Type 2019 & 2032
- Table 104: Global Drill Pipe Industry Volume Tonnes Forecast, by Type 2019 & 2032
- Table 105: Global Drill Pipe Industry Revenue Million Forecast, by Deployment 2019 & 2032
- Table 106: Global Drill Pipe Industry Volume Tonnes Forecast, by Deployment 2019 & 2032
- Table 107: Global Drill Pipe Industry Revenue Million Forecast, by Country 2019 & 2032
- Table 108: Global Drill Pipe Industry Volume Tonnes Forecast, by Country 2019 & 2032
- Table 109: Global Drill Pipe Industry Revenue Million Forecast, by Type 2019 & 2032
- Table 110: Global Drill Pipe Industry Volume Tonnes Forecast, by Type 2019 & 2032
- Table 111: Global Drill Pipe Industry Revenue Million Forecast, by Deployment 2019 & 2032
- Table 112: Global Drill Pipe Industry Volume Tonnes Forecast, by Deployment 2019 & 2032
- Table 113: Global Drill Pipe Industry Revenue Million Forecast, by Country 2019 & 2032
- Table 114: Global Drill Pipe Industry Volume Tonnes Forecast, by Country 2019 & 2032
- Table 115: Global Drill Pipe Industry Revenue Million Forecast, by Type 2019 & 2032
- Table 116: Global Drill Pipe Industry Volume Tonnes Forecast, by Type 2019 & 2032
- Table 117: Global Drill Pipe Industry Revenue Million Forecast, by Deployment 2019 & 2032
- Table 118: Global Drill Pipe Industry Volume Tonnes Forecast, by Deployment 2019 & 2032
- Table 119: Global Drill Pipe Industry Revenue Million Forecast, by Country 2019 & 2032
- Table 120: Global Drill Pipe Industry Volume Tonnes Forecast, by Country 2019 & 2032
Frequently Asked Questions
1. What is the projected Compound Annual Growth Rate (CAGR) of the Drill Pipe Industry?
The projected CAGR is approximately > 4.50%.
2. Which companies are prominent players in the Drill Pipe Industry?
Key companies in the market include National Oilwell Varco Inc (NOV), TMK Group, Tenaris SA, DP Master Manufacturing (S) Pte Ltd, Hunting PLC, International Drilling Services Ltd (IDS), Challenger International Inc, Tejas Tubular Products Inc, Hilong Group, Workstrings International, Texas Steel Conversion Inc (TSC), Oil Country Tubular Limited, Drill pipe international LLC.
3. What are the main segments of the Drill Pipe Industry?
The market segments include Type, Deployment.
4. Can you provide details about the market size?
The market size is estimated to be USD XX Million as of 2022.
5. What are some drivers contributing to market growth?
4.; Uninterrupted and Reliable Power Supply and Heavy Deployment of DG (diesel generator) Set4.; Improvement in Technology of Diesel Generator.
6. What are the notable trends driving market growth?
Onshore to Dominate the Market.
7. Are there any restraints impacting market growth?
4.; The Growing Trend of Renewable Power Generation.
8. Can you provide examples of recent developments in the market?
As of September 2021, PetroChina planned to invest billions of dollars in developing rare shale oil and gas formations in the northeast of China to meet the demand as it is the world's largest consumer of refined petroleum.
9. What pricing options are available for accessing the report?
Pricing options include single-user, multi-user, and enterprise licenses priced at USD 4750, USD 5250, and USD 8750 respectively.
10. Is the market size provided in terms of value or volume?
The market size is provided in terms of value, measured in Million and volume, measured in Tonnes.
11. Are there any specific market keywords associated with the report?
Yes, the market keyword associated with the report is "Drill Pipe Industry," which aids in identifying and referencing the specific market segment covered.
12. How do I determine which pricing option suits my needs best?
The pricing options vary based on user requirements and access needs. Individual users may opt for single-user licenses, while businesses requiring broader access may choose multi-user or enterprise licenses for cost-effective access to the report.
13. Are there any additional resources or data provided in the Drill Pipe Industry report?
While the report offers comprehensive insights, it's advisable to review the specific contents or supplementary materials provided to ascertain if additional resources or data are available.
14. How can I stay updated on further developments or reports in the Drill Pipe Industry?
To stay informed about further developments, trends, and reports in the Drill Pipe Industry, consider subscribing to industry newsletters, following relevant companies and organizations, or regularly checking reputable industry news sources and publications.
Methodology
Step 1 - Identification of Relevant Samples Size from Population Database


Step 2 - Approaches for Defining Global Market Size (Value, Volume* & Price*)

Note*: In applicable scenarios
Step 3 - Data Sources
Primary Research
- Web Analytics
- Survey Reports
- Research Institute
- Latest Research Reports
- Opinion Leaders
Secondary Research
- Annual Reports
- White Paper
- Latest Press Release
- Industry Association
- Paid Database
- Investor Presentations

Step 4 - Data Triangulation
Involves using different sources of information in order to increase the validity of a study
These sources are likely to be stakeholders in a program - participants, other researchers, program staff, other community members, and so on.
Then we put all data in single framework & apply various statistical tools to find out the dynamic on the market.
During the analysis stage, feedback from the stakeholder groups would be compared to determine areas of agreement as well as areas of divergence


