

Key Insights
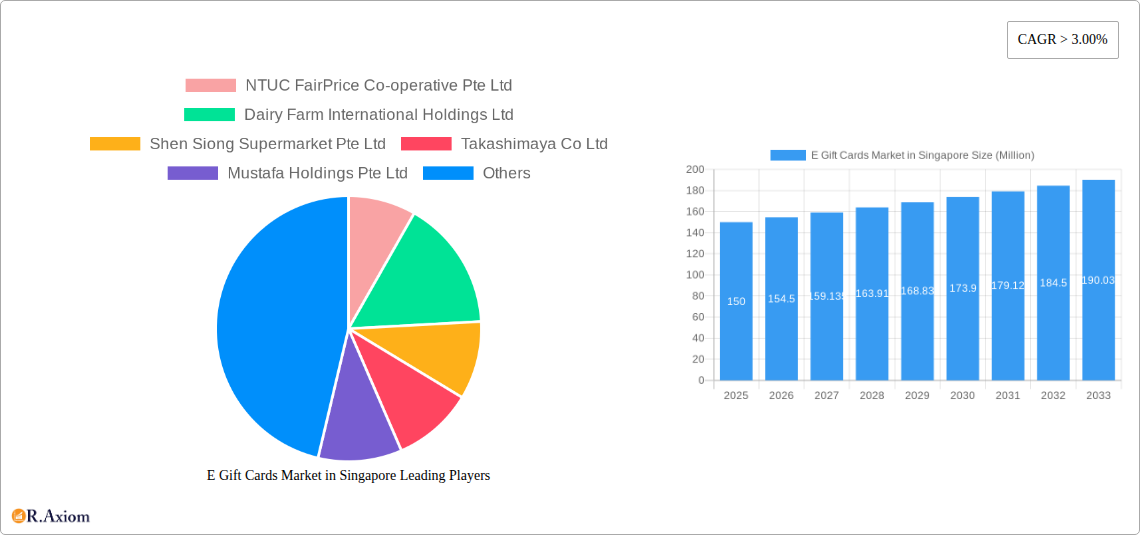
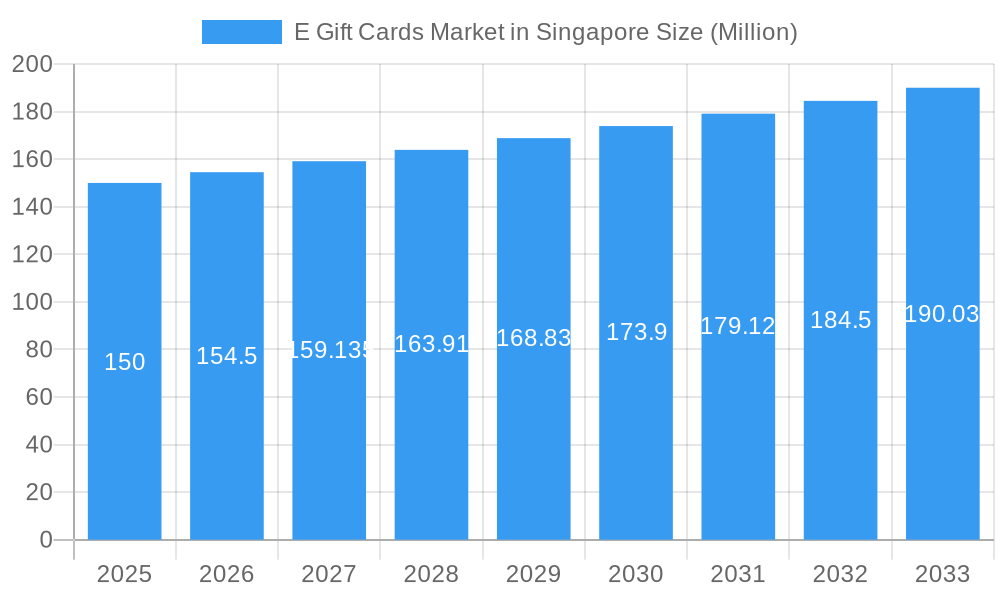
The Singaporean e-gift card market is projected for significant expansion, exhibiting a Compound Annual Growth Rate (CAGR) of 9.3% from its base year of 2025. With a current market size estimated at $1.57 billion, driven by increasing digital adoption, the inherent convenience of online transactions, and the robust growth of e-commerce, this sector presents substantial opportunities. Key market participants, including NTUC FairPrice, Dairy Farm International Holdings, and Sheng Siong Supermarket, are capitalizing on these trends by integrating e-gift card solutions into their digital offerings. The market's upward trajectory is further propelled by a growing consumer preference for digital gifting, especially among younger demographics, and the increasing adoption of e-gift cards for employee incentives and corporate gifting initiatives.
E Gift Cards Market in Singapore Market Size (In Billion)
While market dynamics are favorable, the landscape is characterized by intensifying competition from both established retailers and emerging fintech innovators. Maintaining consumer confidence through secure and seamless transaction platforms is paramount for sustained growth. Nevertheless, the implementation of innovative product features, strategic collaborations, and targeted marketing efforts are expected to effectively navigate these challenges. Market segmentation spans diverse retail verticals such as grocery, department stores, and electronics, each demonstrating distinct growth patterns. Understanding these individual segment dynamics will empower businesses to refine their strategies for optimal market penetration. Future growth will be critically dependent on the deeper integration of e-gift cards into existing loyalty programs and the exploration of specialized market niches, underscoring the imperative for continuous innovation and agile adaptation.
E Gift Cards Market in Singapore Company Market Share
E-Gift Cards Market in Singapore: A Comprehensive Market Report (2019-2033)
This detailed report provides a comprehensive analysis of the E-Gift Cards market in Singapore, covering market size, growth drivers, challenges, competitive landscape, and future outlook. The study period spans from 2019 to 2033, with 2025 serving as the base and estimated year. The report offers actionable insights for industry stakeholders, investors, and businesses operating within or planning to enter the Singaporean e-gift card market.
E-Gift Cards Market in Singapore: Market Concentration & Innovation
This section analyzes the market concentration, innovation drivers, regulatory frameworks, product substitutes, end-user trends, and M&A activities within the Singaporean e-gift card market. The highly fragmented nature of the market is explored, with key players like NTUC FairPrice, Dairy Farm International, and Takashimaya holding significant but not dominant market shares. The report quantifies market share for these and other key players (estimated values where precise data isn't publicly available).
Market Concentration: The Singaporean e-gift card market exhibits a moderately fragmented structure, with no single entity dominating. The top five players collectively hold an estimated xx% market share in 2025, indicating opportunities for both existing players and new entrants.
Innovation Drivers: Technological advancements, particularly in mobile payment platforms and digital wallets, are driving innovation. The increasing integration of e-gift cards with loyalty programs and personalized gifting options further stimulates market growth.
Regulatory Framework: The regulatory environment governing e-gift card transactions in Singapore is relatively stable and supportive of digital commerce, contributing to market expansion.
Product Substitutes: While various other gifting options exist, the convenience and flexibility of e-gift cards provide a compelling alternative. The competitive landscape involves other digital gifting solutions and traditional physical gift cards.
End-User Trends: Growing adoption of online shopping and a preference for digital gifting solutions among younger demographics are key end-user trends fueling market growth.
M&A Activities: The report includes analysis of recent mergers and acquisitions (M&A) in the Singaporean e-gift card sector, including deal values (estimated at xx Million for the period 2019-2024) and their impact on market dynamics. Consolidation is anticipated to continue shaping the competitive landscape.
E-Gift Cards Market in Singapore: Industry Trends & Insights
This section delves into the market growth drivers, technological disruptions, consumer preferences, and competitive dynamics within the Singaporean e-gift card market. The report provides insights into the Compound Annual Growth Rate (CAGR) and market penetration of e-gift cards during the study period.
The market is experiencing robust growth, driven by factors such as the increasing adoption of digital payment methods, a rise in online shopping, and the convenience offered by e-gift cards. The CAGR for the e-gift card market in Singapore from 2019 to 2024 is estimated to be xx%, indicating significant expansion during this period. Market penetration is steadily increasing, with a projected xx% of the total gift card market shifting to digital formats by 2025. Technological innovations, including seamless integration with mobile wallets and personalized gifting experiences, are further accelerating market expansion. Consumer preferences are shifting towards convenience and flexibility, favoring e-gift cards over traditional physical options. Intense competition among various players is fostering innovation and value-added services. The market shows a strong potential for future growth, driven by the ongoing digitalization of the economy and evolving consumer behaviors.
Dominant Markets & Segments in E-Gift Cards Market in Singapore
This section identifies the leading segments and regions within the Singaporean e-gift card market. Key drivers for segment dominance are examined, including economic policies, infrastructure development, and consumer preferences.
Dominant Segment: The retail segment currently holds the largest market share, driven by the high prevalence of online retail and increased consumer spending on e-commerce platforms.
Key Drivers for Dominance:
- Robust E-commerce Infrastructure: Singapore boasts a well-developed e-commerce ecosystem, supporting the adoption of e-gift cards.
- High Smartphone Penetration: The high smartphone penetration rate in Singapore facilitates seamless e-gift card transactions.
- Favorable Government Policies: Supportive government policies promoting digital payments and e-commerce further fuel market growth.
- Consumer Preferences: Consumers prefer the convenience and flexibility of e-gift cards, driving segment dominance.
The retail segment is projected to maintain its dominance throughout the forecast period, with consistent growth fueled by the factors mentioned above.
E-Gift Cards Market in Singapore: Product Developments
Recent product innovations include the integration of e-gift cards with loyalty programs, personalized gifting options, and the development of multi-brand e-gift cards. These advancements enhance customer engagement and offer greater flexibility and personalization. The rising use of blockchain technology for enhanced security and transparency in e-gift card transactions is also a notable trend. Market fit for these innovations is high, given the growing preference for digital convenience and personalized gifting experiences.
Report Scope & Segmentation Analysis
The report segments the e-gift card market in Singapore by various parameters, including:
- By Distribution Channel: Online, Offline
- By Gift Card Type: Open-loop, Closed-loop
- By End-User: Individuals, Corporate
Each segment is analyzed in detail, including market size, growth projections, and competitive dynamics. For instance, the online segment is projected to experience significant growth due to the increasing popularity of online shopping and digital transactions. The closed-loop segment is expected to retain a significant market share due to its targeted nature and enhanced brand loyalty.
Key Drivers of E Gift Cards Market in Singapore Growth
Several factors fuel the growth of the e-gift card market in Singapore:
- Increasing Smartphone Penetration: The widespread use of smartphones facilitates convenient e-gift card purchasing and redemption.
- Growth of E-commerce: The rising popularity of online shopping boosts demand for digital gift cards as a convenient gifting option.
- Government Initiatives: Government support for digital transactions and e-commerce further stimulates market growth.
Challenges in the E Gift Cards Market in Singapore Sector
The Singaporean e-gift card market faces challenges like:
- Security Concerns: Concerns about fraud and data breaches pose a significant challenge.
- Competition: Intense competition from various players necessitates continuous innovation to retain market share.
- Redemption Issues: Occasionally, difficulties in redeeming e-gift cards can affect customer satisfaction.
Emerging Opportunities in E Gift Cards Market in Singapore
Emerging opportunities include:
- Integration with Loyalty Programs: Combining e-gift cards with loyalty programs can enhance customer engagement.
- Personalized Gifting: Offering personalized e-gift cards caters to evolving consumer preferences.
- Expansion into Niche Markets: Targeting specific demographics or industries presents untapped potential.
Leading Players in the E Gift Cards Market in Singapore Market
- NTUC FairPrice Co-operative Pte Ltd
- Dairy Farm International Holdings Ltd
- Shen Siong Supermarket Pte Ltd
- Takashimaya Co Ltd
- Mustafa Holdings Pte Ltd
- Courts Asia Ltd
- Al Futtaim Group LLC
- Yamada Denki Co Ltd
List Not Exhaustive
Key Developments in E Gift Cards Market in Singapore Industry
- December 2020: Giftano launched a new 360 online gifting e-shop, expanding its offerings. This broadened the market for online gifting options and increased competition.
- March 2022: Hallmark launched Hallmark Gold Crown gift cards, expanding the range of available e-gift cards. This increased choice for consumers and strengthened the overall market.
Strategic Outlook for E Gift Cards Market in Singapore Market
The e-gift card market in Singapore is poised for continued expansion, driven by the factors mentioned earlier. The increasing integration of e-gift cards into various platforms and the ongoing shift towards digital transactions will fuel market growth. Further innovation in personalization and security features will enhance customer experience and adoption rates. The market shows strong potential for continued growth and significant expansion over the forecast period (2025-2033).
E Gift Cards Market in Singapore Segmentation
-
1. Product
- 1.1. E-Gift Card
- 1.2. Physical Card
-
2. Consumer
- 2.1. Individual
- 2.2. Corporate
-
3. Distribution Channel
- 3.1. Online
- 3.2. Offline
E Gift Cards Market in Singapore Segmentation By Geography
-
1. North America
- 1.1. United States
- 1.2. Canada
- 1.3. Mexico
-
2. South America
- 2.1. Brazil
- 2.2. Argentina
- 2.3. Rest of South America
-
3. Europe
- 3.1. United Kingdom
- 3.2. Germany
- 3.3. France
- 3.4. Italy
- 3.5. Spain
- 3.6. Russia
- 3.7. Benelux
- 3.8. Nordics
- 3.9. Rest of Europe
-
4. Middle East & Africa
- 4.1. Turkey
- 4.2. Israel
- 4.3. GCC
- 4.4. North Africa
- 4.5. South Africa
- 4.6. Rest of Middle East & Africa
-
5. Asia Pacific
- 5.1. China
- 5.2. India
- 5.3. Japan
- 5.4. South Korea
- 5.5. ASEAN
- 5.6. Oceania
- 5.7. Rest of Asia Pacific
E Gift Cards Market in Singapore Regional Market Share
Geographic Coverage of E Gift Cards Market in Singapore
E Gift Cards Market in Singapore REPORT HIGHLIGHTS
| Aspects | Details |
|---|---|
| Study Period | 2020-2034 |
| Base Year | 2025 |
| Estimated Year | 2026 |
| Forecast Period | 2026-2034 |
| Historical Period | 2020-2025 |
| Growth Rate | CAGR of 9.3% from 2020-2034 |
| Segmentation |
|
Table of Contents
- 1. Introduction
- 1.1. Research Scope
- 1.2. Market Segmentation
- 1.3. Research Objective
- 1.4. Definitions and Assumptions
- 2. Executive Summary
- 2.1. Market Snapshot
- 3. Market Dynamics
- 3.1. Market Drivers
- 3.2. Market Restrains
- 3.3. Market Trends
- 3.4. Market Opportunities
- 4. Market Factor Analysis
- 4.1. Porters Five Forces
- 4.1.1. Bargaining Power of Suppliers
- 4.1.2. Bargaining Power of Buyers
- 4.1.3. Threat of New Entrants
- 4.1.4. Threat of Substitutes
- 4.1.5. Competitive Rivalry
- 4.2. PESTEL analysis
- 4.3. BCG Analysis
- 4.3.1. Stars (High Growth, High Market Share)
- 4.3.2. Cash Cows (Low Growth, High Market Share)
- 4.3.3. Question Mark (High Growth, Low Market Share)
- 4.3.4. Dogs (Low Growth, Low Market Share)
- 4.4. Ansoff Matrix Analysis
- 4.5. Supply Chain Analysis
- 4.6. Regulatory Landscape
- 4.7. Current Market Potential and Opportunity Assessment (TAM–SAM–SOM Framework)
- 4.8. RAX Analyst Note
- 4.1. Porters Five Forces
- 5. Market Analysis, Insights and Forecast 2021-2033
- 5.1. Market Analysis, Insights and Forecast - by Product
- 5.1.1. E-Gift Card
- 5.1.2. Physical Card
- 5.2. Market Analysis, Insights and Forecast - by Consumer
- 5.2.1. Individual
- 5.2.2. Corporate
- 5.3. Market Analysis, Insights and Forecast - by Distribution Channel
- 5.3.1. Online
- 5.3.2. Offline
- 5.4. Market Analysis, Insights and Forecast - by Region
- 5.4.1. North America
- 5.4.2. South America
- 5.4.3. Europe
- 5.4.4. Middle East & Africa
- 5.4.5. Asia Pacific
- 5.1. Market Analysis, Insights and Forecast - by Product
- 6. Global E Gift Cards Market in Singapore Analysis, Insights and Forecast, 2021-2033
- 6.1. Market Analysis, Insights and Forecast - by Product
- 6.1.1. E-Gift Card
- 6.1.2. Physical Card
- 6.2. Market Analysis, Insights and Forecast - by Consumer
- 6.2.1. Individual
- 6.2.2. Corporate
- 6.3. Market Analysis, Insights and Forecast - by Distribution Channel
- 6.3.1. Online
- 6.3.2. Offline
- 6.1. Market Analysis, Insights and Forecast - by Product
- 7. North America E Gift Cards Market in Singapore Analysis, Insights and Forecast, 2020-2032
- 7.1. Market Analysis, Insights and Forecast - by Product
- 7.1.1. E-Gift Card
- 7.1.2. Physical Card
- 7.2. Market Analysis, Insights and Forecast - by Consumer
- 7.2.1. Individual
- 7.2.2. Corporate
- 7.3. Market Analysis, Insights and Forecast - by Distribution Channel
- 7.3.1. Online
- 7.3.2. Offline
- 7.1. Market Analysis, Insights and Forecast - by Product
- 8. South America E Gift Cards Market in Singapore Analysis, Insights and Forecast, 2020-2032
- 8.1. Market Analysis, Insights and Forecast - by Product
- 8.1.1. E-Gift Card
- 8.1.2. Physical Card
- 8.2. Market Analysis, Insights and Forecast - by Consumer
- 8.2.1. Individual
- 8.2.2. Corporate
- 8.3. Market Analysis, Insights and Forecast - by Distribution Channel
- 8.3.1. Online
- 8.3.2. Offline
- 8.1. Market Analysis, Insights and Forecast - by Product
- 9. Europe E Gift Cards Market in Singapore Analysis, Insights and Forecast, 2020-2032
- 9.1. Market Analysis, Insights and Forecast - by Product
- 9.1.1. E-Gift Card
- 9.1.2. Physical Card
- 9.2. Market Analysis, Insights and Forecast - by Consumer
- 9.2.1. Individual
- 9.2.2. Corporate
- 9.3. Market Analysis, Insights and Forecast - by Distribution Channel
- 9.3.1. Online
- 9.3.2. Offline
- 9.1. Market Analysis, Insights and Forecast - by Product
- 10. Middle East & Africa E Gift Cards Market in Singapore Analysis, Insights and Forecast, 2020-2032
- 10.1. Market Analysis, Insights and Forecast - by Product
- 10.1.1. E-Gift Card
- 10.1.2. Physical Card
- 10.2. Market Analysis, Insights and Forecast - by Consumer
- 10.2.1. Individual
- 10.2.2. Corporate
- 10.3. Market Analysis, Insights and Forecast - by Distribution Channel
- 10.3.1. Online
- 10.3.2. Offline
- 10.1. Market Analysis, Insights and Forecast - by Product
- 11. Asia Pacific E Gift Cards Market in Singapore Analysis, Insights and Forecast, 2020-2032
- 11.1. Market Analysis, Insights and Forecast - by Product
- 11.1.1. E-Gift Card
- 11.1.2. Physical Card
- 11.2. Market Analysis, Insights and Forecast - by Consumer
- 11.2.1. Individual
- 11.2.2. Corporate
- 11.3. Market Analysis, Insights and Forecast - by Distribution Channel
- 11.3.1. Online
- 11.3.2. Offline
- 11.1. Market Analysis, Insights and Forecast - by Product
- 12. Competitive Analysis
- 12.1. Company Profiles
- 12.1.1 NTUC FairPrice Co-operative Pte Ltd
- 12.1.1.1. Company Overview
- 12.1.1.2. Products
- 12.1.1.3. Company Financials
- 12.1.1.4. SWOT Analysis
- 12.1.2 Dairy Farm International Holdings Ltd
- 12.1.2.1. Company Overview
- 12.1.2.2. Products
- 12.1.2.3. Company Financials
- 12.1.2.4. SWOT Analysis
- 12.1.3 Shen Siong Supermarket Pte Ltd
- 12.1.3.1. Company Overview
- 12.1.3.2. Products
- 12.1.3.3. Company Financials
- 12.1.3.4. SWOT Analysis
- 12.1.4 Takashimaya Co Ltd
- 12.1.4.1. Company Overview
- 12.1.4.2. Products
- 12.1.4.3. Company Financials
- 12.1.4.4. SWOT Analysis
- 12.1.5 Mustafa Holdings Pte Ltd
- 12.1.5.1. Company Overview
- 12.1.5.2. Products
- 12.1.5.3. Company Financials
- 12.1.5.4. SWOT Analysis
- 12.1.6 Courts Asia Ltd
- 12.1.6.1. Company Overview
- 12.1.6.2. Products
- 12.1.6.3. Company Financials
- 12.1.6.4. SWOT Analysis
- 12.1.7 Al Futtaim Group LLC
- 12.1.7.1. Company Overview
- 12.1.7.2. Products
- 12.1.7.3. Company Financials
- 12.1.7.4. SWOT Analysis
- 12.1.8 Yamada Denki Co Ltd**List Not Exhaustive
- 12.1.8.1. Company Overview
- 12.1.8.2. Products
- 12.1.8.3. Company Financials
- 12.1.8.4. SWOT Analysis
- 12.1.1 NTUC FairPrice Co-operative Pte Ltd
- 12.2. Market Entropy
- 12.2.1 Company's Key Areas Served
- 12.2.2 Recent Developments
- 12.3. Company Market Share Analysis 2025
- 12.3.1 Top 5 Companies Market Share Analysis
- 12.3.2 Top 3 Companies Market Share Analysis
- 12.4. List of Potential Customers
- 13. Research Methodology
List of Figures
- Figure 1: Global E Gift Cards Market in Singapore Revenue Breakdown (billion, %) by Region 2025 & 2033
- Figure 2: North America E Gift Cards Market in Singapore Revenue (billion), by Product 2025 & 2033
- Figure 3: North America E Gift Cards Market in Singapore Revenue Share (%), by Product 2025 & 2033
- Figure 4: North America E Gift Cards Market in Singapore Revenue (billion), by Consumer 2025 & 2033
- Figure 5: North America E Gift Cards Market in Singapore Revenue Share (%), by Consumer 2025 & 2033
- Figure 6: North America E Gift Cards Market in Singapore Revenue (billion), by Distribution Channel 2025 & 2033
- Figure 7: North America E Gift Cards Market in Singapore Revenue Share (%), by Distribution Channel 2025 & 2033
- Figure 8: North America E Gift Cards Market in Singapore Revenue (billion), by Country 2025 & 2033
- Figure 9: North America E Gift Cards Market in Singapore Revenue Share (%), by Country 2025 & 2033
- Figure 10: South America E Gift Cards Market in Singapore Revenue (billion), by Product 2025 & 2033
- Figure 11: South America E Gift Cards Market in Singapore Revenue Share (%), by Product 2025 & 2033
- Figure 12: South America E Gift Cards Market in Singapore Revenue (billion), by Consumer 2025 & 2033
- Figure 13: South America E Gift Cards Market in Singapore Revenue Share (%), by Consumer 2025 & 2033
- Figure 14: South America E Gift Cards Market in Singapore Revenue (billion), by Distribution Channel 2025 & 2033
- Figure 15: South America E Gift Cards Market in Singapore Revenue Share (%), by Distribution Channel 2025 & 2033
- Figure 16: South America E Gift Cards Market in Singapore Revenue (billion), by Country 2025 & 2033
- Figure 17: South America E Gift Cards Market in Singapore Revenue Share (%), by Country 2025 & 2033
- Figure 18: Europe E Gift Cards Market in Singapore Revenue (billion), by Product 2025 & 2033
- Figure 19: Europe E Gift Cards Market in Singapore Revenue Share (%), by Product 2025 & 2033
- Figure 20: Europe E Gift Cards Market in Singapore Revenue (billion), by Consumer 2025 & 2033
- Figure 21: Europe E Gift Cards Market in Singapore Revenue Share (%), by Consumer 2025 & 2033
- Figure 22: Europe E Gift Cards Market in Singapore Revenue (billion), by Distribution Channel 2025 & 2033
- Figure 23: Europe E Gift Cards Market in Singapore Revenue Share (%), by Distribution Channel 2025 & 2033
- Figure 24: Europe E Gift Cards Market in Singapore Revenue (billion), by Country 2025 & 2033
- Figure 25: Europe E Gift Cards Market in Singapore Revenue Share (%), by Country 2025 & 2033
- Figure 26: Middle East & Africa E Gift Cards Market in Singapore Revenue (billion), by Product 2025 & 2033
- Figure 27: Middle East & Africa E Gift Cards Market in Singapore Revenue Share (%), by Product 2025 & 2033
- Figure 28: Middle East & Africa E Gift Cards Market in Singapore Revenue (billion), by Consumer 2025 & 2033
- Figure 29: Middle East & Africa E Gift Cards Market in Singapore Revenue Share (%), by Consumer 2025 & 2033
- Figure 30: Middle East & Africa E Gift Cards Market in Singapore Revenue (billion), by Distribution Channel 2025 & 2033
- Figure 31: Middle East & Africa E Gift Cards Market in Singapore Revenue Share (%), by Distribution Channel 2025 & 2033
- Figure 32: Middle East & Africa E Gift Cards Market in Singapore Revenue (billion), by Country 2025 & 2033
- Figure 33: Middle East & Africa E Gift Cards Market in Singapore Revenue Share (%), by Country 2025 & 2033
- Figure 34: Asia Pacific E Gift Cards Market in Singapore Revenue (billion), by Product 2025 & 2033
- Figure 35: Asia Pacific E Gift Cards Market in Singapore Revenue Share (%), by Product 2025 & 2033
- Figure 36: Asia Pacific E Gift Cards Market in Singapore Revenue (billion), by Consumer 2025 & 2033
- Figure 37: Asia Pacific E Gift Cards Market in Singapore Revenue Share (%), by Consumer 2025 & 2033
- Figure 38: Asia Pacific E Gift Cards Market in Singapore Revenue (billion), by Distribution Channel 2025 & 2033
- Figure 39: Asia Pacific E Gift Cards Market in Singapore Revenue Share (%), by Distribution Channel 2025 & 2033
- Figure 40: Asia Pacific E Gift Cards Market in Singapore Revenue (billion), by Country 2025 & 2033
- Figure 41: Asia Pacific E Gift Cards Market in Singapore Revenue Share (%), by Country 2025 & 2033
List of Tables
- Table 1: Global E Gift Cards Market in Singapore Revenue billion Forecast, by Product 2020 & 2033
- Table 2: Global E Gift Cards Market in Singapore Revenue billion Forecast, by Consumer 2020 & 2033
- Table 3: Global E Gift Cards Market in Singapore Revenue billion Forecast, by Distribution Channel 2020 & 2033
- Table 4: Global E Gift Cards Market in Singapore Revenue billion Forecast, by Region 2020 & 2033
- Table 5: Global E Gift Cards Market in Singapore Revenue billion Forecast, by Product 2020 & 2033
- Table 6: Global E Gift Cards Market in Singapore Revenue billion Forecast, by Consumer 2020 & 2033
- Table 7: Global E Gift Cards Market in Singapore Revenue billion Forecast, by Distribution Channel 2020 & 2033
- Table 8: Global E Gift Cards Market in Singapore Revenue billion Forecast, by Country 2020 & 2033
- Table 9: United States E Gift Cards Market in Singapore Revenue (billion) Forecast, by Application 2020 & 2033
- Table 10: Canada E Gift Cards Market in Singapore Revenue (billion) Forecast, by Application 2020 & 2033
- Table 11: Mexico E Gift Cards Market in Singapore Revenue (billion) Forecast, by Application 2020 & 2033
- Table 12: Global E Gift Cards Market in Singapore Revenue billion Forecast, by Product 2020 & 2033
- Table 13: Global E Gift Cards Market in Singapore Revenue billion Forecast, by Consumer 2020 & 2033
- Table 14: Global E Gift Cards Market in Singapore Revenue billion Forecast, by Distribution Channel 2020 & 2033
- Table 15: Global E Gift Cards Market in Singapore Revenue billion Forecast, by Country 2020 & 2033
- Table 16: Brazil E Gift Cards Market in Singapore Revenue (billion) Forecast, by Application 2020 & 2033
- Table 17: Argentina E Gift Cards Market in Singapore Revenue (billion) Forecast, by Application 2020 & 2033
- Table 18: Rest of South America E Gift Cards Market in Singapore Revenue (billion) Forecast, by Application 2020 & 2033
- Table 19: Global E Gift Cards Market in Singapore Revenue billion Forecast, by Product 2020 & 2033
- Table 20: Global E Gift Cards Market in Singapore Revenue billion Forecast, by Consumer 2020 & 2033
- Table 21: Global E Gift Cards Market in Singapore Revenue billion Forecast, by Distribution Channel 2020 & 2033
- Table 22: Global E Gift Cards Market in Singapore Revenue billion Forecast, by Country 2020 & 2033
- Table 23: United Kingdom E Gift Cards Market in Singapore Revenue (billion) Forecast, by Application 2020 & 2033
- Table 24: Germany E Gift Cards Market in Singapore Revenue (billion) Forecast, by Application 2020 & 2033
- Table 25: France E Gift Cards Market in Singapore Revenue (billion) Forecast, by Application 2020 & 2033
- Table 26: Italy E Gift Cards Market in Singapore Revenue (billion) Forecast, by Application 2020 & 2033
- Table 27: Spain E Gift Cards Market in Singapore Revenue (billion) Forecast, by Application 2020 & 2033
- Table 28: Russia E Gift Cards Market in Singapore Revenue (billion) Forecast, by Application 2020 & 2033
- Table 29: Benelux E Gift Cards Market in Singapore Revenue (billion) Forecast, by Application 2020 & 2033
- Table 30: Nordics E Gift Cards Market in Singapore Revenue (billion) Forecast, by Application 2020 & 2033
- Table 31: Rest of Europe E Gift Cards Market in Singapore Revenue (billion) Forecast, by Application 2020 & 2033
- Table 32: Global E Gift Cards Market in Singapore Revenue billion Forecast, by Product 2020 & 2033
- Table 33: Global E Gift Cards Market in Singapore Revenue billion Forecast, by Consumer 2020 & 2033
- Table 34: Global E Gift Cards Market in Singapore Revenue billion Forecast, by Distribution Channel 2020 & 2033
- Table 35: Global E Gift Cards Market in Singapore Revenue billion Forecast, by Country 2020 & 2033
- Table 36: Turkey E Gift Cards Market in Singapore Revenue (billion) Forecast, by Application 2020 & 2033
- Table 37: Israel E Gift Cards Market in Singapore Revenue (billion) Forecast, by Application 2020 & 2033
- Table 38: GCC E Gift Cards Market in Singapore Revenue (billion) Forecast, by Application 2020 & 2033
- Table 39: North Africa E Gift Cards Market in Singapore Revenue (billion) Forecast, by Application 2020 & 2033
- Table 40: South Africa E Gift Cards Market in Singapore Revenue (billion) Forecast, by Application 2020 & 2033
- Table 41: Rest of Middle East & Africa E Gift Cards Market in Singapore Revenue (billion) Forecast, by Application 2020 & 2033
- Table 42: Global E Gift Cards Market in Singapore Revenue billion Forecast, by Product 2020 & 2033
- Table 43: Global E Gift Cards Market in Singapore Revenue billion Forecast, by Consumer 2020 & 2033
- Table 44: Global E Gift Cards Market in Singapore Revenue billion Forecast, by Distribution Channel 2020 & 2033
- Table 45: Global E Gift Cards Market in Singapore Revenue billion Forecast, by Country 2020 & 2033
- Table 46: China E Gift Cards Market in Singapore Revenue (billion) Forecast, by Application 2020 & 2033
- Table 47: India E Gift Cards Market in Singapore Revenue (billion) Forecast, by Application 2020 & 2033
- Table 48: Japan E Gift Cards Market in Singapore Revenue (billion) Forecast, by Application 2020 & 2033
- Table 49: South Korea E Gift Cards Market in Singapore Revenue (billion) Forecast, by Application 2020 & 2033
- Table 50: ASEAN E Gift Cards Market in Singapore Revenue (billion) Forecast, by Application 2020 & 2033
- Table 51: Oceania E Gift Cards Market in Singapore Revenue (billion) Forecast, by Application 2020 & 2033
- Table 52: Rest of Asia Pacific E Gift Cards Market in Singapore Revenue (billion) Forecast, by Application 2020 & 2033
Frequently Asked Questions
1. What is the projected Compound Annual Growth Rate (CAGR) of the E Gift Cards Market in Singapore?
The projected CAGR is approximately 9.3%.
2. Which companies are prominent players in the E Gift Cards Market in Singapore?
Key companies in the market include NTUC FairPrice Co-operative Pte Ltd, Dairy Farm International Holdings Ltd, Shen Siong Supermarket Pte Ltd, Takashimaya Co Ltd, Mustafa Holdings Pte Ltd, Courts Asia Ltd, Al Futtaim Group LLC, Yamada Denki Co Ltd**List Not Exhaustive.
3. What are the main segments of the E Gift Cards Market in Singapore?
The market segments include Product, Consumer , Distribution Channel.
4. Can you provide details about the market size?
The market size is estimated to be USD 1.57 billion as of 2022.
5. What are some drivers contributing to market growth?
N/A
6. What are the notable trends driving market growth?
Increase in Corporate Incentives Boosting Sales of Virtual Gift Cards in Singapore.
7. Are there any restraints impacting market growth?
N/A
8. Can you provide examples of recent developments in the market?
In March 2022, Hallmark launched Hallmark Gold Crown gift cards available at participating Hallmark stores and on Hallmark.com.
9. What pricing options are available for accessing the report?
Pricing options include single-user, multi-user, and enterprise licenses priced at USD 3800, USD 4500, and USD 5800 respectively.
10. Is the market size provided in terms of value or volume?
The market size is provided in terms of value, measured in billion.
11. Are there any specific market keywords associated with the report?
Yes, the market keyword associated with the report is "E Gift Cards Market in Singapore," which aids in identifying and referencing the specific market segment covered.
12. How do I determine which pricing option suits my needs best?
The pricing options vary based on user requirements and access needs. Individual users may opt for single-user licenses, while businesses requiring broader access may choose multi-user or enterprise licenses for cost-effective access to the report.
13. Are there any additional resources or data provided in the E Gift Cards Market in Singapore report?
While the report offers comprehensive insights, it's advisable to review the specific contents or supplementary materials provided to ascertain if additional resources or data are available.
14. How can I stay updated on further developments or reports in the E Gift Cards Market in Singapore?
To stay informed about further developments, trends, and reports in the E Gift Cards Market in Singapore, consider subscribing to industry newsletters, following relevant companies and organizations, or regularly checking reputable industry news sources and publications.
Methodology
Step 1 - Identification of Relevant Samples Size from Population Database


Step 2 - Approaches for Defining Global Market Size (Value, Volume* & Price*)

Note*: In applicable scenarios
Step 3 - Data Sources
Primary Research
- Web Analytics
- Survey Reports
- Research Institute
- Latest Research Reports
- Opinion Leaders
Secondary Research
- Annual Reports
- White Paper
- Latest Press Release
- Industry Association
- Paid Database
- Investor Presentations

Step 4 - Data Triangulation
Involves using different sources of information in order to increase the validity of a study
These sources are likely to be stakeholders in a program - participants, other researchers, program staff, other community members, and so on.
Then we put all data in single framework & apply various statistical tools to find out the dynamic on the market.
During the analysis stage, feedback from the stakeholder groups would be compared to determine areas of agreement as well as areas of divergence