
Key Insights
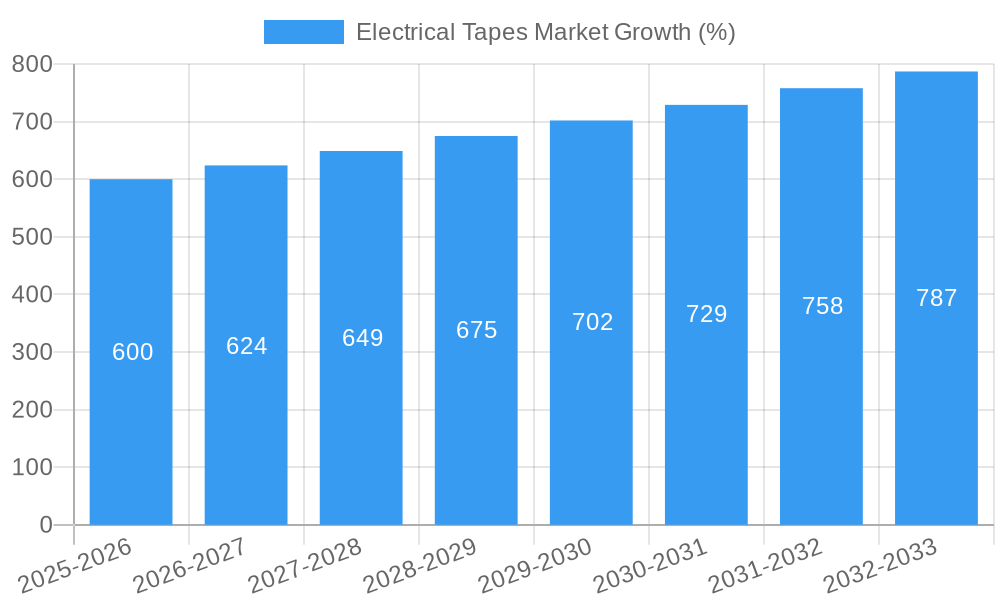
The global electrical tapes market is experiencing robust growth, driven by the burgeoning electrical and electronics industry, the increasing demand for energy-efficient solutions, and the expansion of infrastructure projects worldwide. A compound annual growth rate (CAGR) exceeding 4% indicates a steadily expanding market, projected to reach significant value over the forecast period (2025-2033). Key market segments include acrylic, epoxy, rubber-based, silicone, and polyurethane resins, each catering to specific application needs in terms of adhesive strength, temperature resistance, and electrical insulation properties. Technology segments like water-based, solvent-based, hot-melt, and reactive tapes offer diverse solutions based on environmental concerns and application requirements. Major end-user industries include automotive manufacturing, healthcare, packaging, and the expanding consumer/DIY sectors, all contributing to market expansion. While challenges such as fluctuating raw material prices and stringent environmental regulations exist, the overall market outlook remains positive, driven by technological advancements and the sustained growth in related industries.
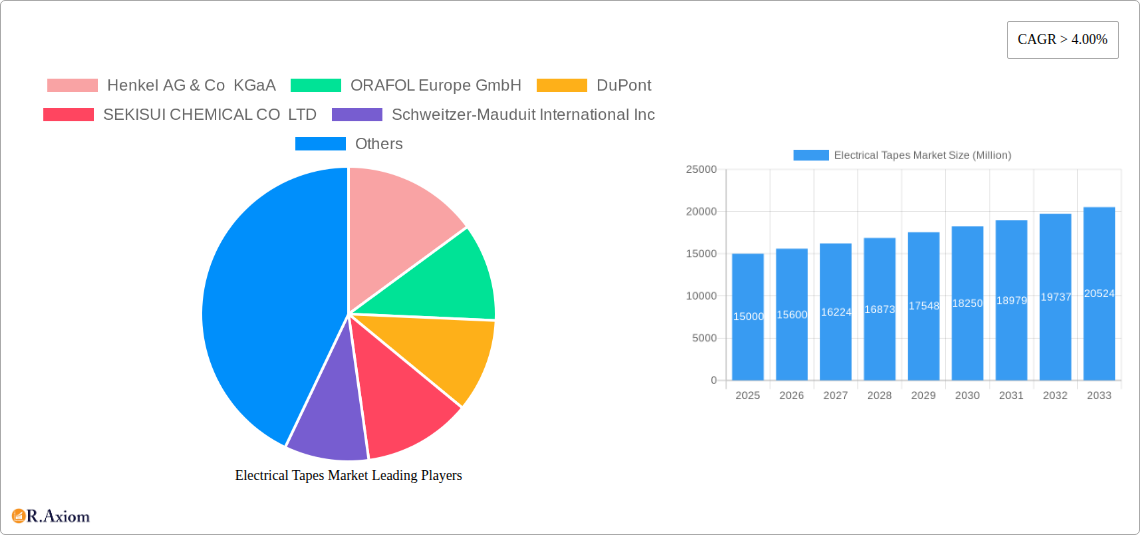
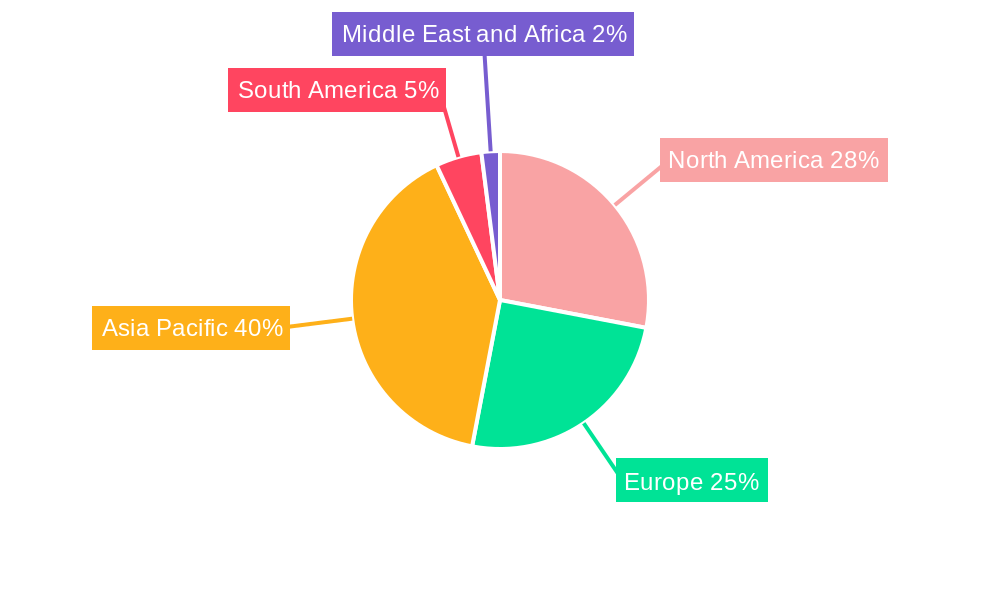
The competitive landscape is characterized by a mix of established multinational corporations and specialized regional players. Leading companies like 3M, Henkel, and DuPont leverage their extensive R&D capabilities and strong distribution networks to maintain market leadership. However, the market is also witnessing increased competition from smaller players focusing on niche applications and innovative product offerings. Regional market dynamics are influenced by factors such as industrial development, economic growth, and government regulations. The Asia-Pacific region, particularly China and India, is expected to be a key growth driver due to rapid industrialization and urbanization. North America and Europe will also contribute significantly, although at a potentially slightly slower pace compared to Asia-Pacific. The market's future growth hinges on the continued expansion of the electrical and electronics sectors, advancements in tape technology, and the adoption of sustainable manufacturing practices.
Electrical Tapes Market: A Comprehensive Report (2019-2033)
This detailed report provides a comprehensive analysis of the global Electrical Tapes Market, covering the period 2019-2033. It offers in-depth insights into market dynamics, segmentation, leading players, and future growth prospects, equipping stakeholders with actionable intelligence for strategic decision-making. The report utilizes data from the historical period (2019-2024), the base year (2025), and projects the market's trajectory through the forecast period (2025-2033). The estimated market value for 2025 is xx Million.
Electrical Tapes Market Concentration & Innovation
This section analyzes the competitive landscape of the electrical tapes market, examining market concentration, innovation drivers, regulatory influences, and recent M&A activities. The market is characterized by a moderately concentrated structure, with several key players holding significant market share. However, the presence of numerous smaller players introduces a level of competition. Innovation is driven by the need for improved insulation properties, enhanced durability, and specialized applications across diverse end-user industries. Stringent safety and environmental regulations influence product development and manufacturing processes. Product substitution is a potential challenge, with alternative technologies emerging in niche segments. End-user trends towards automation and miniaturization are creating demand for specialized tapes. Mergers and acquisitions (M&A) are observed as strategic moves by major players to expand market reach and product portfolios.
- Market Concentration: The top 5 players hold an estimated xx% market share in 2025. Market concentration is expected to remain relatively stable during the forecast period.
- M&A Activity: Significant M&A deals, such as Clearlake Capital Group's acquisition of Intertape Polymer Group in 2022, demonstrate the consolidation trend in the market. The total value of M&A deals in the past five years is estimated at xx Million.
- Innovation Drivers: Demand for higher performance tapes in applications like electric vehicles and renewable energy is driving innovation in material science and adhesive technologies.
Electrical Tapes Market Industry Trends & Insights
The global electrical tapes market is experiencing robust growth, driven by increasing demand across various sectors. The market's Compound Annual Growth Rate (CAGR) from 2025 to 2033 is projected to be xx%. Several factors contribute to this growth, including rising demand from the burgeoning electronics industry, increased adoption of electric vehicles, and the expansion of renewable energy infrastructure. Technological advancements in adhesive formulations and tape manufacturing processes are enhancing product performance and expanding application possibilities. Consumer preferences are shifting toward eco-friendly and sustainable alternatives. The competitive landscape is characterized by intense rivalry among established players and emerging entrants, leading to product differentiation and price competition. Market penetration of specialized tapes, such as those with high-temperature resistance or specific adhesive properties, is increasing.
Dominant Markets & Segments in Electrical Tapes Market
The Electrical Tapes Market exhibits significant regional and segmental variations. The [Region Name] region is expected to dominate the market due to factors such as [Reason 1, e.g., robust industrial growth] and [Reason 2, e.g., supportive government policies]. Within segments, [Specific Resin Type, e.g., Acrylic] tapes hold the largest market share due to its cost-effectiveness and versatility. Similarly, [Specific Technology, e.g., Solvent-based] technology dominates due to its strong adhesion properties. The automotive and electrical and electronics end-user industries are the primary drivers of market growth.
- Key Drivers (Region Name):
- Strong economic growth.
- Expanding manufacturing sector.
- Increasing infrastructure development.
- Dominant Segments:
- Resin: Acrylic (due to cost-effectiveness and versatility)
- Technology: Solvent-based (due to strong adhesion)
- End-user: Automotive and Electrical and Electronics (due to high demand from these sectors).
Electrical Tapes Market Product Developments
Recent product developments focus on enhancing performance characteristics, such as improved insulation, higher temperature resistance, and increased flexibility. Innovations in adhesive technologies are enabling the creation of tapes with stronger adhesion and better durability. These advancements cater to the growing demand for high-performance tapes in demanding applications, such as electric vehicles and aerospace. Manufacturers are also focusing on developing eco-friendly and sustainable options, using recycled materials and biodegradable adhesives.
Report Scope & Segmentation Analysis
The report comprehensively segments the electrical tapes market by resin type (Acrylic, Epoxy, Rubber-based, Silicone, Polyurethane), technology (Water-based, Solvent-based, Hot-melt, Reactive), and end-user industry (Automotive, Healthcare, Packaging, Electrical and Electronics, Consumer/DIY, Other). Each segment's growth projections, market size, and competitive dynamics are analyzed in detail. For instance, the acrylic resin segment is projected to experience significant growth due to its versatility and cost-effectiveness, while the automotive end-user segment is expected to be a major driver of market expansion.
Key Drivers of Electrical Tapes Market Growth
The electrical tapes market is fueled by several key growth drivers. The booming electronics industry and the rising adoption of electric vehicles are creating substantial demand for high-performance tapes. Furthermore, the expanding renewable energy sector necessitates specialized tapes with enhanced insulation and weather resistance. Government regulations promoting energy efficiency and environmental sustainability are also driving market growth. Technological advancements leading to improved adhesive properties and increased durability further contribute to market expansion.
Challenges in the Electrical Tapes Market Sector
The electrical tapes market faces several challenges. Fluctuations in raw material prices can impact profitability. Stringent environmental regulations necessitate the adoption of sustainable manufacturing practices, which can increase costs. Intense competition from both established players and new entrants puts pressure on pricing and margins. Supply chain disruptions, particularly those related to key raw materials, can impact production and delivery schedules.
Emerging Opportunities in Electrical Tapes Market
The electrical tapes market presents several promising opportunities. The growth of the electric vehicle industry is opening new avenues for specialized high-performance tapes. The increasing demand for sustainable and eco-friendly products presents opportunities for manufacturers to develop and market bio-based tapes. Expansion into emerging markets with growing industrial sectors offers significant potential for market growth. The development of advanced adhesive technologies that offer improved performance and durability provides scope for product innovation.
Leading Players in the Electrical Tapes Market Market
- Henkel AG & Co KGaA
- ORAFOL Europe GmbH
- DuPont
- SEKISUI CHEMICAL CO LTD
- Schweitzer-Mauduit International Inc
- Sika AG
- LINTEC Corporation
- OJI Holdings Corporation
- Shurtape Technologies LLC
- NITTO DENKO CORPORATION
- Intertape Polymer Group
- tesa SE - A Beiersdorf Company
- HB Fuller Company
- Berry Global Inc
- 3M
- Lohmanh GmbH & Co KG
Key Developments in Electrical Tapes Market Industry
- June 2022: Clearlake Capital Group, L.P. completed its acquisition of Intertape Polymer Group Inc., expanding its portfolio in the adhesives market.
- January 2022: tesa S.E. - A Beiersdorf Company initiated construction of a new plant in Haiphong, Vietnam, with an investment of approximately USD 65.07 Million. This expansion is projected to significantly increase the company’s production capacity.
Strategic Outlook for Electrical Tapes Market Market
The electrical tapes market is poised for continued growth, driven by several factors. The ongoing expansion of the electronics and automotive industries, coupled with the growing adoption of renewable energy technologies, will continue to fuel demand for high-performance tapes. The focus on sustainable and eco-friendly products will create opportunities for manufacturers to develop and market innovative, environmentally responsible solutions. Strategic investments in research and development to improve adhesive technologies and product performance will further drive market growth. The market's future potential is substantial, offering significant opportunities for both established players and new entrants.
Electrical Tapes Market Segmentation
-
1. Resin
- 1.1. Acrylic
- 1.2. Epoxy
- 1.3. Rubber-based
- 1.4. Silicone
- 1.5. Polyurethane
-
2. Technology
- 2.1. Water-based
- 2.2. Solvent-based
- 2.3. Hot-melt
- 2.4. Reactive
-
3. End-user Industry
- 3.1. Automotive
- 3.2. Healthcare
- 3.3. Packaging
- 3.4. Electrical and Electronics
- 3.5. Consumer/DIY
- 3.6. Other End-user Industries
Electrical Tapes Market Segmentation By Geography
-
1. Asia Pacific
- 1.1. China
- 1.2. India
- 1.3. Japan
- 1.4. South Korea
- 1.5. Rest of Asia Pacific
-
2. North America
- 2.1. United States
- 2.2. Canada
- 2.3. Mexico
-
3. Europe
- 3.1. Germany
- 3.2. United Kingdom
- 3.3. Italy
- 3.4. France
- 3.5. Rest of the Europe
-
4. South America
- 4.1. Brazil
- 4.2. Argentina
- 4.3. Rest of South America
-
5. Middle East and Africa
- 5.1. Saudi Arabia
- 5.2. South Africa
- 5.3. Rest of Middle East and Africa
Electrical Tapes Market REPORT HIGHLIGHTS
| Aspects | Details |
|---|---|
| Study Period | 2019-2033 |
| Base Year | 2024 |
| Estimated Year | 2025 |
| Forecast Period | 2025-2033 |
| Historical Period | 2019-2024 |
| Growth Rate | CAGR of > 4.00% from 2019-2033 |
| Segmentation |
|
Table of Contents
- 1. Introduction
- 1.1. Research Scope
- 1.2. Market Segmentation
- 1.3. Research Methodology
- 1.4. Definitions and Assumptions
- 2. Executive Summary
- 2.1. Introduction
- 3. Market Dynamics
- 3.1. Introduction
- 3.2. Market Drivers
- 3.2.1. Rapidly Growing Demand from the Packaging Industry; Continuous Usage of Adhesive Tapes in Electric and Hybrid Vehicles
- 3.3. Market Restrains
- 3.3.1. Volatility in Prices of Raw Materials
- 3.4. Market Trends
- 3.4.1. Packaging Segment to Dominate the Market
- 4. Market Factor Analysis
- 4.1. Porters Five Forces
- 4.2. Supply/Value Chain
- 4.3. PESTEL analysis
- 4.4. Market Entropy
- 4.5. Patent/Trademark Analysis
- 5. Global Electrical Tapes Market Analysis, Insights and Forecast, 2019-2031
- 5.1. Market Analysis, Insights and Forecast - by Resin
- 5.1.1. Acrylic
- 5.1.2. Epoxy
- 5.1.3. Rubber-based
- 5.1.4. Silicone
- 5.1.5. Polyurethane
- 5.2. Market Analysis, Insights and Forecast - by Technology
- 5.2.1. Water-based
- 5.2.2. Solvent-based
- 5.2.3. Hot-melt
- 5.2.4. Reactive
- 5.3. Market Analysis, Insights and Forecast - by End-user Industry
- 5.3.1. Automotive
- 5.3.2. Healthcare
- 5.3.3. Packaging
- 5.3.4. Electrical and Electronics
- 5.3.5. Consumer/DIY
- 5.3.6. Other End-user Industries
- 5.4. Market Analysis, Insights and Forecast - by Region
- 5.4.1. Asia Pacific
- 5.4.2. North America
- 5.4.3. Europe
- 5.4.4. South America
- 5.4.5. Middle East and Africa
- 5.1. Market Analysis, Insights and Forecast - by Resin
- 6. Asia Pacific Electrical Tapes Market Analysis, Insights and Forecast, 2019-2031
- 6.1. Market Analysis, Insights and Forecast - by Resin
- 6.1.1. Acrylic
- 6.1.2. Epoxy
- 6.1.3. Rubber-based
- 6.1.4. Silicone
- 6.1.5. Polyurethane
- 6.2. Market Analysis, Insights and Forecast - by Technology
- 6.2.1. Water-based
- 6.2.2. Solvent-based
- 6.2.3. Hot-melt
- 6.2.4. Reactive
- 6.3. Market Analysis, Insights and Forecast - by End-user Industry
- 6.3.1. Automotive
- 6.3.2. Healthcare
- 6.3.3. Packaging
- 6.3.4. Electrical and Electronics
- 6.3.5. Consumer/DIY
- 6.3.6. Other End-user Industries
- 6.1. Market Analysis, Insights and Forecast - by Resin
- 7. North America Electrical Tapes Market Analysis, Insights and Forecast, 2019-2031
- 7.1. Market Analysis, Insights and Forecast - by Resin
- 7.1.1. Acrylic
- 7.1.2. Epoxy
- 7.1.3. Rubber-based
- 7.1.4. Silicone
- 7.1.5. Polyurethane
- 7.2. Market Analysis, Insights and Forecast - by Technology
- 7.2.1. Water-based
- 7.2.2. Solvent-based
- 7.2.3. Hot-melt
- 7.2.4. Reactive
- 7.3. Market Analysis, Insights and Forecast - by End-user Industry
- 7.3.1. Automotive
- 7.3.2. Healthcare
- 7.3.3. Packaging
- 7.3.4. Electrical and Electronics
- 7.3.5. Consumer/DIY
- 7.3.6. Other End-user Industries
- 7.1. Market Analysis, Insights and Forecast - by Resin
- 8. Europe Electrical Tapes Market Analysis, Insights and Forecast, 2019-2031
- 8.1. Market Analysis, Insights and Forecast - by Resin
- 8.1.1. Acrylic
- 8.1.2. Epoxy
- 8.1.3. Rubber-based
- 8.1.4. Silicone
- 8.1.5. Polyurethane
- 8.2. Market Analysis, Insights and Forecast - by Technology
- 8.2.1. Water-based
- 8.2.2. Solvent-based
- 8.2.3. Hot-melt
- 8.2.4. Reactive
- 8.3. Market Analysis, Insights and Forecast - by End-user Industry
- 8.3.1. Automotive
- 8.3.2. Healthcare
- 8.3.3. Packaging
- 8.3.4. Electrical and Electronics
- 8.3.5. Consumer/DIY
- 8.3.6. Other End-user Industries
- 8.1. Market Analysis, Insights and Forecast - by Resin
- 9. South America Electrical Tapes Market Analysis, Insights and Forecast, 2019-2031
- 9.1. Market Analysis, Insights and Forecast - by Resin
- 9.1.1. Acrylic
- 9.1.2. Epoxy
- 9.1.3. Rubber-based
- 9.1.4. Silicone
- 9.1.5. Polyurethane
- 9.2. Market Analysis, Insights and Forecast - by Technology
- 9.2.1. Water-based
- 9.2.2. Solvent-based
- 9.2.3. Hot-melt
- 9.2.4. Reactive
- 9.3. Market Analysis, Insights and Forecast - by End-user Industry
- 9.3.1. Automotive
- 9.3.2. Healthcare
- 9.3.3. Packaging
- 9.3.4. Electrical and Electronics
- 9.3.5. Consumer/DIY
- 9.3.6. Other End-user Industries
- 9.1. Market Analysis, Insights and Forecast - by Resin
- 10. Middle East and Africa Electrical Tapes Market Analysis, Insights and Forecast, 2019-2031
- 10.1. Market Analysis, Insights and Forecast - by Resin
- 10.1.1. Acrylic
- 10.1.2. Epoxy
- 10.1.3. Rubber-based
- 10.1.4. Silicone
- 10.1.5. Polyurethane
- 10.2. Market Analysis, Insights and Forecast - by Technology
- 10.2.1. Water-based
- 10.2.2. Solvent-based
- 10.2.3. Hot-melt
- 10.2.4. Reactive
- 10.3. Market Analysis, Insights and Forecast - by End-user Industry
- 10.3.1. Automotive
- 10.3.2. Healthcare
- 10.3.3. Packaging
- 10.3.4. Electrical and Electronics
- 10.3.5. Consumer/DIY
- 10.3.6. Other End-user Industries
- 10.1. Market Analysis, Insights and Forecast - by Resin
- 11. Asia Pacific Electrical Tapes Market Analysis, Insights and Forecast, 2019-2031
- 11.1. Market Analysis, Insights and Forecast - By Country/Sub-region
- 11.1.1 China
- 11.1.2 India
- 11.1.3 Japan
- 11.1.4 South Korea
- 11.1.5 Rest of Asia Pacific
- 12. North America Electrical Tapes Market Analysis, Insights and Forecast, 2019-2031
- 12.1. Market Analysis, Insights and Forecast - By Country/Sub-region
- 12.1.1 United States
- 12.1.2 Canada
- 12.1.3 Mexico
- 13. Europe Electrical Tapes Market Analysis, Insights and Forecast, 2019-2031
- 13.1. Market Analysis, Insights and Forecast - By Country/Sub-region
- 13.1.1 Germany
- 13.1.2 United Kingdom
- 13.1.3 Italy
- 13.1.4 France
- 13.1.5 Rest of the Europe
- 14. South America Electrical Tapes Market Analysis, Insights and Forecast, 2019-2031
- 14.1. Market Analysis, Insights and Forecast - By Country/Sub-region
- 14.1.1 Brazil
- 14.1.2 Argentina
- 14.1.3 Rest of South America
- 15. Middle East and Africa Electrical Tapes Market Analysis, Insights and Forecast, 2019-2031
- 15.1. Market Analysis, Insights and Forecast - By Country/Sub-region
- 15.1.1 Saudi Arabia
- 15.1.2 South Africa
- 15.1.3 Rest of Middle East and Africa
- 16. Competitive Analysis
- 16.1. Global Market Share Analysis 2024
- 16.2. Company Profiles
- 16.2.1 Henkel AG & Co KGaA
- 16.2.1.1. Overview
- 16.2.1.2. Products
- 16.2.1.3. SWOT Analysis
- 16.2.1.4. Recent Developments
- 16.2.1.5. Financials (Based on Availability)
- 16.2.2 ORAFOL Europe GmbH
- 16.2.2.1. Overview
- 16.2.2.2. Products
- 16.2.2.3. SWOT Analysis
- 16.2.2.4. Recent Developments
- 16.2.2.5. Financials (Based on Availability)
- 16.2.3 DuPont
- 16.2.3.1. Overview
- 16.2.3.2. Products
- 16.2.3.3. SWOT Analysis
- 16.2.3.4. Recent Developments
- 16.2.3.5. Financials (Based on Availability)
- 16.2.4 SEKISUI CHEMICAL CO LTD
- 16.2.4.1. Overview
- 16.2.4.2. Products
- 16.2.4.3. SWOT Analysis
- 16.2.4.4. Recent Developments
- 16.2.4.5. Financials (Based on Availability)
- 16.2.5 Schweitzer-Mauduit International Inc
- 16.2.5.1. Overview
- 16.2.5.2. Products
- 16.2.5.3. SWOT Analysis
- 16.2.5.4. Recent Developments
- 16.2.5.5. Financials (Based on Availability)
- 16.2.6 Sika AG
- 16.2.6.1. Overview
- 16.2.6.2. Products
- 16.2.6.3. SWOT Analysis
- 16.2.6.4. Recent Developments
- 16.2.6.5. Financials (Based on Availability)
- 16.2.7 LINTEC Corporation
- 16.2.7.1. Overview
- 16.2.7.2. Products
- 16.2.7.3. SWOT Analysis
- 16.2.7.4. Recent Developments
- 16.2.7.5. Financials (Based on Availability)
- 16.2.8 OJI Holdings Corporation
- 16.2.8.1. Overview
- 16.2.8.2. Products
- 16.2.8.3. SWOT Analysis
- 16.2.8.4. Recent Developments
- 16.2.8.5. Financials (Based on Availability)
- 16.2.9 Shurtape Technologies LLC
- 16.2.9.1. Overview
- 16.2.9.2. Products
- 16.2.9.3. SWOT Analysis
- 16.2.9.4. Recent Developments
- 16.2.9.5. Financials (Based on Availability)
- 16.2.10 NITTO DENKO CORPORATION
- 16.2.10.1. Overview
- 16.2.10.2. Products
- 16.2.10.3. SWOT Analysis
- 16.2.10.4. Recent Developments
- 16.2.10.5. Financials (Based on Availability)
- 16.2.11 Intertape Polymer Group
- 16.2.11.1. Overview
- 16.2.11.2. Products
- 16.2.11.3. SWOT Analysis
- 16.2.11.4. Recent Developments
- 16.2.11.5. Financials (Based on Availability)
- 16.2.12 tesa SE - A Beiersdorf Company*List Not Exhaustive
- 16.2.12.1. Overview
- 16.2.12.2. Products
- 16.2.12.3. SWOT Analysis
- 16.2.12.4. Recent Developments
- 16.2.12.5. Financials (Based on Availability)
- 16.2.13 HB Fuller Company
- 16.2.13.1. Overview
- 16.2.13.2. Products
- 16.2.13.3. SWOT Analysis
- 16.2.13.4. Recent Developments
- 16.2.13.5. Financials (Based on Availability)
- 16.2.14 Berry Global Inc
- 16.2.14.1. Overview
- 16.2.14.2. Products
- 16.2.14.3. SWOT Analysis
- 16.2.14.4. Recent Developments
- 16.2.14.5. Financials (Based on Availability)
- 16.2.15 3M
- 16.2.15.1. Overview
- 16.2.15.2. Products
- 16.2.15.3. SWOT Analysis
- 16.2.15.4. Recent Developments
- 16.2.15.5. Financials (Based on Availability)
- 16.2.16 Lohmanh GmbH & Co KG
- 16.2.16.1. Overview
- 16.2.16.2. Products
- 16.2.16.3. SWOT Analysis
- 16.2.16.4. Recent Developments
- 16.2.16.5. Financials (Based on Availability)
- 16.2.1 Henkel AG & Co KGaA
List of Figures
- Figure 1: Global Electrical Tapes Market Revenue Breakdown (Million, %) by Region 2024 & 2032
- Figure 2: Global Electrical Tapes Market Volume Breakdown (Kiloton, %) by Region 2024 & 2032
- Figure 3: Asia Pacific Electrical Tapes Market Revenue (Million), by Country 2024 & 2032
- Figure 4: Asia Pacific Electrical Tapes Market Volume (Kiloton), by Country 2024 & 2032
- Figure 5: Asia Pacific Electrical Tapes Market Revenue Share (%), by Country 2024 & 2032
- Figure 6: Asia Pacific Electrical Tapes Market Volume Share (%), by Country 2024 & 2032
- Figure 7: North America Electrical Tapes Market Revenue (Million), by Country 2024 & 2032
- Figure 8: North America Electrical Tapes Market Volume (Kiloton), by Country 2024 & 2032
- Figure 9: North America Electrical Tapes Market Revenue Share (%), by Country 2024 & 2032
- Figure 10: North America Electrical Tapes Market Volume Share (%), by Country 2024 & 2032
- Figure 11: Europe Electrical Tapes Market Revenue (Million), by Country 2024 & 2032
- Figure 12: Europe Electrical Tapes Market Volume (Kiloton), by Country 2024 & 2032
- Figure 13: Europe Electrical Tapes Market Revenue Share (%), by Country 2024 & 2032
- Figure 14: Europe Electrical Tapes Market Volume Share (%), by Country 2024 & 2032
- Figure 15: South America Electrical Tapes Market Revenue (Million), by Country 2024 & 2032
- Figure 16: South America Electrical Tapes Market Volume (Kiloton), by Country 2024 & 2032
- Figure 17: South America Electrical Tapes Market Revenue Share (%), by Country 2024 & 2032
- Figure 18: South America Electrical Tapes Market Volume Share (%), by Country 2024 & 2032
- Figure 19: Middle East and Africa Electrical Tapes Market Revenue (Million), by Country 2024 & 2032
- Figure 20: Middle East and Africa Electrical Tapes Market Volume (Kiloton), by Country 2024 & 2032
- Figure 21: Middle East and Africa Electrical Tapes Market Revenue Share (%), by Country 2024 & 2032
- Figure 22: Middle East and Africa Electrical Tapes Market Volume Share (%), by Country 2024 & 2032
- Figure 23: Asia Pacific Electrical Tapes Market Revenue (Million), by Resin 2024 & 2032
- Figure 24: Asia Pacific Electrical Tapes Market Volume (Kiloton), by Resin 2024 & 2032
- Figure 25: Asia Pacific Electrical Tapes Market Revenue Share (%), by Resin 2024 & 2032
- Figure 26: Asia Pacific Electrical Tapes Market Volume Share (%), by Resin 2024 & 2032
- Figure 27: Asia Pacific Electrical Tapes Market Revenue (Million), by Technology 2024 & 2032
- Figure 28: Asia Pacific Electrical Tapes Market Volume (Kiloton), by Technology 2024 & 2032
- Figure 29: Asia Pacific Electrical Tapes Market Revenue Share (%), by Technology 2024 & 2032
- Figure 30: Asia Pacific Electrical Tapes Market Volume Share (%), by Technology 2024 & 2032
- Figure 31: Asia Pacific Electrical Tapes Market Revenue (Million), by End-user Industry 2024 & 2032
- Figure 32: Asia Pacific Electrical Tapes Market Volume (Kiloton), by End-user Industry 2024 & 2032
- Figure 33: Asia Pacific Electrical Tapes Market Revenue Share (%), by End-user Industry 2024 & 2032
- Figure 34: Asia Pacific Electrical Tapes Market Volume Share (%), by End-user Industry 2024 & 2032
- Figure 35: Asia Pacific Electrical Tapes Market Revenue (Million), by Country 2024 & 2032
- Figure 36: Asia Pacific Electrical Tapes Market Volume (Kiloton), by Country 2024 & 2032
- Figure 37: Asia Pacific Electrical Tapes Market Revenue Share (%), by Country 2024 & 2032
- Figure 38: Asia Pacific Electrical Tapes Market Volume Share (%), by Country 2024 & 2032
- Figure 39: North America Electrical Tapes Market Revenue (Million), by Resin 2024 & 2032
- Figure 40: North America Electrical Tapes Market Volume (Kiloton), by Resin 2024 & 2032
- Figure 41: North America Electrical Tapes Market Revenue Share (%), by Resin 2024 & 2032
- Figure 42: North America Electrical Tapes Market Volume Share (%), by Resin 2024 & 2032
- Figure 43: North America Electrical Tapes Market Revenue (Million), by Technology 2024 & 2032
- Figure 44: North America Electrical Tapes Market Volume (Kiloton), by Technology 2024 & 2032
- Figure 45: North America Electrical Tapes Market Revenue Share (%), by Technology 2024 & 2032
- Figure 46: North America Electrical Tapes Market Volume Share (%), by Technology 2024 & 2032
- Figure 47: North America Electrical Tapes Market Revenue (Million), by End-user Industry 2024 & 2032
- Figure 48: North America Electrical Tapes Market Volume (Kiloton), by End-user Industry 2024 & 2032
- Figure 49: North America Electrical Tapes Market Revenue Share (%), by End-user Industry 2024 & 2032
- Figure 50: North America Electrical Tapes Market Volume Share (%), by End-user Industry 2024 & 2032
- Figure 51: North America Electrical Tapes Market Revenue (Million), by Country 2024 & 2032
- Figure 52: North America Electrical Tapes Market Volume (Kiloton), by Country 2024 & 2032
- Figure 53: North America Electrical Tapes Market Revenue Share (%), by Country 2024 & 2032
- Figure 54: North America Electrical Tapes Market Volume Share (%), by Country 2024 & 2032
- Figure 55: Europe Electrical Tapes Market Revenue (Million), by Resin 2024 & 2032
- Figure 56: Europe Electrical Tapes Market Volume (Kiloton), by Resin 2024 & 2032
- Figure 57: Europe Electrical Tapes Market Revenue Share (%), by Resin 2024 & 2032
- Figure 58: Europe Electrical Tapes Market Volume Share (%), by Resin 2024 & 2032
- Figure 59: Europe Electrical Tapes Market Revenue (Million), by Technology 2024 & 2032
- Figure 60: Europe Electrical Tapes Market Volume (Kiloton), by Technology 2024 & 2032
- Figure 61: Europe Electrical Tapes Market Revenue Share (%), by Technology 2024 & 2032
- Figure 62: Europe Electrical Tapes Market Volume Share (%), by Technology 2024 & 2032
- Figure 63: Europe Electrical Tapes Market Revenue (Million), by End-user Industry 2024 & 2032
- Figure 64: Europe Electrical Tapes Market Volume (Kiloton), by End-user Industry 2024 & 2032
- Figure 65: Europe Electrical Tapes Market Revenue Share (%), by End-user Industry 2024 & 2032
- Figure 66: Europe Electrical Tapes Market Volume Share (%), by End-user Industry 2024 & 2032
- Figure 67: Europe Electrical Tapes Market Revenue (Million), by Country 2024 & 2032
- Figure 68: Europe Electrical Tapes Market Volume (Kiloton), by Country 2024 & 2032
- Figure 69: Europe Electrical Tapes Market Revenue Share (%), by Country 2024 & 2032
- Figure 70: Europe Electrical Tapes Market Volume Share (%), by Country 2024 & 2032
- Figure 71: South America Electrical Tapes Market Revenue (Million), by Resin 2024 & 2032
- Figure 72: South America Electrical Tapes Market Volume (Kiloton), by Resin 2024 & 2032
- Figure 73: South America Electrical Tapes Market Revenue Share (%), by Resin 2024 & 2032
- Figure 74: South America Electrical Tapes Market Volume Share (%), by Resin 2024 & 2032
- Figure 75: South America Electrical Tapes Market Revenue (Million), by Technology 2024 & 2032
- Figure 76: South America Electrical Tapes Market Volume (Kiloton), by Technology 2024 & 2032
- Figure 77: South America Electrical Tapes Market Revenue Share (%), by Technology 2024 & 2032
- Figure 78: South America Electrical Tapes Market Volume Share (%), by Technology 2024 & 2032
- Figure 79: South America Electrical Tapes Market Revenue (Million), by End-user Industry 2024 & 2032
- Figure 80: South America Electrical Tapes Market Volume (Kiloton), by End-user Industry 2024 & 2032
- Figure 81: South America Electrical Tapes Market Revenue Share (%), by End-user Industry 2024 & 2032
- Figure 82: South America Electrical Tapes Market Volume Share (%), by End-user Industry 2024 & 2032
- Figure 83: South America Electrical Tapes Market Revenue (Million), by Country 2024 & 2032
- Figure 84: South America Electrical Tapes Market Volume (Kiloton), by Country 2024 & 2032
- Figure 85: South America Electrical Tapes Market Revenue Share (%), by Country 2024 & 2032
- Figure 86: South America Electrical Tapes Market Volume Share (%), by Country 2024 & 2032
- Figure 87: Middle East and Africa Electrical Tapes Market Revenue (Million), by Resin 2024 & 2032
- Figure 88: Middle East and Africa Electrical Tapes Market Volume (Kiloton), by Resin 2024 & 2032
- Figure 89: Middle East and Africa Electrical Tapes Market Revenue Share (%), by Resin 2024 & 2032
- Figure 90: Middle East and Africa Electrical Tapes Market Volume Share (%), by Resin 2024 & 2032
- Figure 91: Middle East and Africa Electrical Tapes Market Revenue (Million), by Technology 2024 & 2032
- Figure 92: Middle East and Africa Electrical Tapes Market Volume (Kiloton), by Technology 2024 & 2032
- Figure 93: Middle East and Africa Electrical Tapes Market Revenue Share (%), by Technology 2024 & 2032
- Figure 94: Middle East and Africa Electrical Tapes Market Volume Share (%), by Technology 2024 & 2032
- Figure 95: Middle East and Africa Electrical Tapes Market Revenue (Million), by End-user Industry 2024 & 2032
- Figure 96: Middle East and Africa Electrical Tapes Market Volume (Kiloton), by End-user Industry 2024 & 2032
- Figure 97: Middle East and Africa Electrical Tapes Market Revenue Share (%), by End-user Industry 2024 & 2032
- Figure 98: Middle East and Africa Electrical Tapes Market Volume Share (%), by End-user Industry 2024 & 2032
- Figure 99: Middle East and Africa Electrical Tapes Market Revenue (Million), by Country 2024 & 2032
- Figure 100: Middle East and Africa Electrical Tapes Market Volume (Kiloton), by Country 2024 & 2032
- Figure 101: Middle East and Africa Electrical Tapes Market Revenue Share (%), by Country 2024 & 2032
- Figure 102: Middle East and Africa Electrical Tapes Market Volume Share (%), by Country 2024 & 2032
List of Tables
- Table 1: Global Electrical Tapes Market Revenue Million Forecast, by Region 2019 & 2032
- Table 2: Global Electrical Tapes Market Volume Kiloton Forecast, by Region 2019 & 2032
- Table 3: Global Electrical Tapes Market Revenue Million Forecast, by Resin 2019 & 2032
- Table 4: Global Electrical Tapes Market Volume Kiloton Forecast, by Resin 2019 & 2032
- Table 5: Global Electrical Tapes Market Revenue Million Forecast, by Technology 2019 & 2032
- Table 6: Global Electrical Tapes Market Volume Kiloton Forecast, by Technology 2019 & 2032
- Table 7: Global Electrical Tapes Market Revenue Million Forecast, by End-user Industry 2019 & 2032
- Table 8: Global Electrical Tapes Market Volume Kiloton Forecast, by End-user Industry 2019 & 2032
- Table 9: Global Electrical Tapes Market Revenue Million Forecast, by Region 2019 & 2032
- Table 10: Global Electrical Tapes Market Volume Kiloton Forecast, by Region 2019 & 2032
- Table 11: Global Electrical Tapes Market Revenue Million Forecast, by Country 2019 & 2032
- Table 12: Global Electrical Tapes Market Volume Kiloton Forecast, by Country 2019 & 2032
- Table 13: China Electrical Tapes Market Revenue (Million) Forecast, by Application 2019 & 2032
- Table 14: China Electrical Tapes Market Volume (Kiloton) Forecast, by Application 2019 & 2032
- Table 15: India Electrical Tapes Market Revenue (Million) Forecast, by Application 2019 & 2032
- Table 16: India Electrical Tapes Market Volume (Kiloton) Forecast, by Application 2019 & 2032
- Table 17: Japan Electrical Tapes Market Revenue (Million) Forecast, by Application 2019 & 2032
- Table 18: Japan Electrical Tapes Market Volume (Kiloton) Forecast, by Application 2019 & 2032
- Table 19: South Korea Electrical Tapes Market Revenue (Million) Forecast, by Application 2019 & 2032
- Table 20: South Korea Electrical Tapes Market Volume (Kiloton) Forecast, by Application 2019 & 2032
- Table 21: Rest of Asia Pacific Electrical Tapes Market Revenue (Million) Forecast, by Application 2019 & 2032
- Table 22: Rest of Asia Pacific Electrical Tapes Market Volume (Kiloton) Forecast, by Application 2019 & 2032
- Table 23: Global Electrical Tapes Market Revenue Million Forecast, by Country 2019 & 2032
- Table 24: Global Electrical Tapes Market Volume Kiloton Forecast, by Country 2019 & 2032
- Table 25: United States Electrical Tapes Market Revenue (Million) Forecast, by Application 2019 & 2032
- Table 26: United States Electrical Tapes Market Volume (Kiloton) Forecast, by Application 2019 & 2032
- Table 27: Canada Electrical Tapes Market Revenue (Million) Forecast, by Application 2019 & 2032
- Table 28: Canada Electrical Tapes Market Volume (Kiloton) Forecast, by Application 2019 & 2032
- Table 29: Mexico Electrical Tapes Market Revenue (Million) Forecast, by Application 2019 & 2032
- Table 30: Mexico Electrical Tapes Market Volume (Kiloton) Forecast, by Application 2019 & 2032
- Table 31: Global Electrical Tapes Market Revenue Million Forecast, by Country 2019 & 2032
- Table 32: Global Electrical Tapes Market Volume Kiloton Forecast, by Country 2019 & 2032
- Table 33: Germany Electrical Tapes Market Revenue (Million) Forecast, by Application 2019 & 2032
- Table 34: Germany Electrical Tapes Market Volume (Kiloton) Forecast, by Application 2019 & 2032
- Table 35: United Kingdom Electrical Tapes Market Revenue (Million) Forecast, by Application 2019 & 2032
- Table 36: United Kingdom Electrical Tapes Market Volume (Kiloton) Forecast, by Application 2019 & 2032
- Table 37: Italy Electrical Tapes Market Revenue (Million) Forecast, by Application 2019 & 2032
- Table 38: Italy Electrical Tapes Market Volume (Kiloton) Forecast, by Application 2019 & 2032
- Table 39: France Electrical Tapes Market Revenue (Million) Forecast, by Application 2019 & 2032
- Table 40: France Electrical Tapes Market Volume (Kiloton) Forecast, by Application 2019 & 2032
- Table 41: Rest of the Europe Electrical Tapes Market Revenue (Million) Forecast, by Application 2019 & 2032
- Table 42: Rest of the Europe Electrical Tapes Market Volume (Kiloton) Forecast, by Application 2019 & 2032
- Table 43: Global Electrical Tapes Market Revenue Million Forecast, by Country 2019 & 2032
- Table 44: Global Electrical Tapes Market Volume Kiloton Forecast, by Country 2019 & 2032
- Table 45: Brazil Electrical Tapes Market Revenue (Million) Forecast, by Application 2019 & 2032
- Table 46: Brazil Electrical Tapes Market Volume (Kiloton) Forecast, by Application 2019 & 2032
- Table 47: Argentina Electrical Tapes Market Revenue (Million) Forecast, by Application 2019 & 2032
- Table 48: Argentina Electrical Tapes Market Volume (Kiloton) Forecast, by Application 2019 & 2032
- Table 49: Rest of South America Electrical Tapes Market Revenue (Million) Forecast, by Application 2019 & 2032
- Table 50: Rest of South America Electrical Tapes Market Volume (Kiloton) Forecast, by Application 2019 & 2032
- Table 51: Global Electrical Tapes Market Revenue Million Forecast, by Country 2019 & 2032
- Table 52: Global Electrical Tapes Market Volume Kiloton Forecast, by Country 2019 & 2032
- Table 53: Saudi Arabia Electrical Tapes Market Revenue (Million) Forecast, by Application 2019 & 2032
- Table 54: Saudi Arabia Electrical Tapes Market Volume (Kiloton) Forecast, by Application 2019 & 2032
- Table 55: South Africa Electrical Tapes Market Revenue (Million) Forecast, by Application 2019 & 2032
- Table 56: South Africa Electrical Tapes Market Volume (Kiloton) Forecast, by Application 2019 & 2032
- Table 57: Rest of Middle East and Africa Electrical Tapes Market Revenue (Million) Forecast, by Application 2019 & 2032
- Table 58: Rest of Middle East and Africa Electrical Tapes Market Volume (Kiloton) Forecast, by Application 2019 & 2032
- Table 59: Global Electrical Tapes Market Revenue Million Forecast, by Resin 2019 & 2032
- Table 60: Global Electrical Tapes Market Volume Kiloton Forecast, by Resin 2019 & 2032
- Table 61: Global Electrical Tapes Market Revenue Million Forecast, by Technology 2019 & 2032
- Table 62: Global Electrical Tapes Market Volume Kiloton Forecast, by Technology 2019 & 2032
- Table 63: Global Electrical Tapes Market Revenue Million Forecast, by End-user Industry 2019 & 2032
- Table 64: Global Electrical Tapes Market Volume Kiloton Forecast, by End-user Industry 2019 & 2032
- Table 65: Global Electrical Tapes Market Revenue Million Forecast, by Country 2019 & 2032
- Table 66: Global Electrical Tapes Market Volume Kiloton Forecast, by Country 2019 & 2032
- Table 67: China Electrical Tapes Market Revenue (Million) Forecast, by Application 2019 & 2032
- Table 68: China Electrical Tapes Market Volume (Kiloton) Forecast, by Application 2019 & 2032
- Table 69: India Electrical Tapes Market Revenue (Million) Forecast, by Application 2019 & 2032
- Table 70: India Electrical Tapes Market Volume (Kiloton) Forecast, by Application 2019 & 2032
- Table 71: Japan Electrical Tapes Market Revenue (Million) Forecast, by Application 2019 & 2032
- Table 72: Japan Electrical Tapes Market Volume (Kiloton) Forecast, by Application 2019 & 2032
- Table 73: South Korea Electrical Tapes Market Revenue (Million) Forecast, by Application 2019 & 2032
- Table 74: South Korea Electrical Tapes Market Volume (Kiloton) Forecast, by Application 2019 & 2032
- Table 75: Rest of Asia Pacific Electrical Tapes Market Revenue (Million) Forecast, by Application 2019 & 2032
- Table 76: Rest of Asia Pacific Electrical Tapes Market Volume (Kiloton) Forecast, by Application 2019 & 2032
- Table 77: Global Electrical Tapes Market Revenue Million Forecast, by Resin 2019 & 2032
- Table 78: Global Electrical Tapes Market Volume Kiloton Forecast, by Resin 2019 & 2032
- Table 79: Global Electrical Tapes Market Revenue Million Forecast, by Technology 2019 & 2032
- Table 80: Global Electrical Tapes Market Volume Kiloton Forecast, by Technology 2019 & 2032
- Table 81: Global Electrical Tapes Market Revenue Million Forecast, by End-user Industry 2019 & 2032
- Table 82: Global Electrical Tapes Market Volume Kiloton Forecast, by End-user Industry 2019 & 2032
- Table 83: Global Electrical Tapes Market Revenue Million Forecast, by Country 2019 & 2032
- Table 84: Global Electrical Tapes Market Volume Kiloton Forecast, by Country 2019 & 2032
- Table 85: United States Electrical Tapes Market Revenue (Million) Forecast, by Application 2019 & 2032
- Table 86: United States Electrical Tapes Market Volume (Kiloton) Forecast, by Application 2019 & 2032
- Table 87: Canada Electrical Tapes Market Revenue (Million) Forecast, by Application 2019 & 2032
- Table 88: Canada Electrical Tapes Market Volume (Kiloton) Forecast, by Application 2019 & 2032
- Table 89: Mexico Electrical Tapes Market Revenue (Million) Forecast, by Application 2019 & 2032
- Table 90: Mexico Electrical Tapes Market Volume (Kiloton) Forecast, by Application 2019 & 2032
- Table 91: Global Electrical Tapes Market Revenue Million Forecast, by Resin 2019 & 2032
- Table 92: Global Electrical Tapes Market Volume Kiloton Forecast, by Resin 2019 & 2032
- Table 93: Global Electrical Tapes Market Revenue Million Forecast, by Technology 2019 & 2032
- Table 94: Global Electrical Tapes Market Volume Kiloton Forecast, by Technology 2019 & 2032
- Table 95: Global Electrical Tapes Market Revenue Million Forecast, by End-user Industry 2019 & 2032
- Table 96: Global Electrical Tapes Market Volume Kiloton Forecast, by End-user Industry 2019 & 2032
- Table 97: Global Electrical Tapes Market Revenue Million Forecast, by Country 2019 & 2032
- Table 98: Global Electrical Tapes Market Volume Kiloton Forecast, by Country 2019 & 2032
- Table 99: Germany Electrical Tapes Market Revenue (Million) Forecast, by Application 2019 & 2032
- Table 100: Germany Electrical Tapes Market Volume (Kiloton) Forecast, by Application 2019 & 2032
- Table 101: United Kingdom Electrical Tapes Market Revenue (Million) Forecast, by Application 2019 & 2032
- Table 102: United Kingdom Electrical Tapes Market Volume (Kiloton) Forecast, by Application 2019 & 2032
- Table 103: Italy Electrical Tapes Market Revenue (Million) Forecast, by Application 2019 & 2032
- Table 104: Italy Electrical Tapes Market Volume (Kiloton) Forecast, by Application 2019 & 2032
- Table 105: France Electrical Tapes Market Revenue (Million) Forecast, by Application 2019 & 2032
- Table 106: France Electrical Tapes Market Volume (Kiloton) Forecast, by Application 2019 & 2032
- Table 107: Rest of the Europe Electrical Tapes Market Revenue (Million) Forecast, by Application 2019 & 2032
- Table 108: Rest of the Europe Electrical Tapes Market Volume (Kiloton) Forecast, by Application 2019 & 2032
- Table 109: Global Electrical Tapes Market Revenue Million Forecast, by Resin 2019 & 2032
- Table 110: Global Electrical Tapes Market Volume Kiloton Forecast, by Resin 2019 & 2032
- Table 111: Global Electrical Tapes Market Revenue Million Forecast, by Technology 2019 & 2032
- Table 112: Global Electrical Tapes Market Volume Kiloton Forecast, by Technology 2019 & 2032
- Table 113: Global Electrical Tapes Market Revenue Million Forecast, by End-user Industry 2019 & 2032
- Table 114: Global Electrical Tapes Market Volume Kiloton Forecast, by End-user Industry 2019 & 2032
- Table 115: Global Electrical Tapes Market Revenue Million Forecast, by Country 2019 & 2032
- Table 116: Global Electrical Tapes Market Volume Kiloton Forecast, by Country 2019 & 2032
- Table 117: Brazil Electrical Tapes Market Revenue (Million) Forecast, by Application 2019 & 2032
- Table 118: Brazil Electrical Tapes Market Volume (Kiloton) Forecast, by Application 2019 & 2032
- Table 119: Argentina Electrical Tapes Market Revenue (Million) Forecast, by Application 2019 & 2032
- Table 120: Argentina Electrical Tapes Market Volume (Kiloton) Forecast, by Application 2019 & 2032
- Table 121: Rest of South America Electrical Tapes Market Revenue (Million) Forecast, by Application 2019 & 2032
- Table 122: Rest of South America Electrical Tapes Market Volume (Kiloton) Forecast, by Application 2019 & 2032
- Table 123: Global Electrical Tapes Market Revenue Million Forecast, by Resin 2019 & 2032
- Table 124: Global Electrical Tapes Market Volume Kiloton Forecast, by Resin 2019 & 2032
- Table 125: Global Electrical Tapes Market Revenue Million Forecast, by Technology 2019 & 2032
- Table 126: Global Electrical Tapes Market Volume Kiloton Forecast, by Technology 2019 & 2032
- Table 127: Global Electrical Tapes Market Revenue Million Forecast, by End-user Industry 2019 & 2032
- Table 128: Global Electrical Tapes Market Volume Kiloton Forecast, by End-user Industry 2019 & 2032
- Table 129: Global Electrical Tapes Market Revenue Million Forecast, by Country 2019 & 2032
- Table 130: Global Electrical Tapes Market Volume Kiloton Forecast, by Country 2019 & 2032
- Table 131: Saudi Arabia Electrical Tapes Market Revenue (Million) Forecast, by Application 2019 & 2032
- Table 132: Saudi Arabia Electrical Tapes Market Volume (Kiloton) Forecast, by Application 2019 & 2032
- Table 133: South Africa Electrical Tapes Market Revenue (Million) Forecast, by Application 2019 & 2032
- Table 134: South Africa Electrical Tapes Market Volume (Kiloton) Forecast, by Application 2019 & 2032
- Table 135: Rest of Middle East and Africa Electrical Tapes Market Revenue (Million) Forecast, by Application 2019 & 2032
- Table 136: Rest of Middle East and Africa Electrical Tapes Market Volume (Kiloton) Forecast, by Application 2019 & 2032
Frequently Asked Questions
1. What is the projected Compound Annual Growth Rate (CAGR) of the Electrical Tapes Market?
The projected CAGR is approximately > 4.00%.
2. Which companies are prominent players in the Electrical Tapes Market?
Key companies in the market include Henkel AG & Co KGaA, ORAFOL Europe GmbH, DuPont, SEKISUI CHEMICAL CO LTD, Schweitzer-Mauduit International Inc, Sika AG, LINTEC Corporation, OJI Holdings Corporation, Shurtape Technologies LLC, NITTO DENKO CORPORATION, Intertape Polymer Group, tesa SE - A Beiersdorf Company*List Not Exhaustive, HB Fuller Company, Berry Global Inc, 3M, Lohmanh GmbH & Co KG.
3. What are the main segments of the Electrical Tapes Market?
The market segments include Resin, Technology, End-user Industry.
4. Can you provide details about the market size?
The market size is estimated to be USD XX Million as of 2022.
5. What are some drivers contributing to market growth?
Rapidly Growing Demand from the Packaging Industry; Continuous Usage of Adhesive Tapes in Electric and Hybrid Vehicles.
6. What are the notable trends driving market growth?
Packaging Segment to Dominate the Market.
7. Are there any restraints impacting market growth?
Volatility in Prices of Raw Materials.
8. Can you provide examples of recent developments in the market?
In June 2022, Clearlake Capital Group, L.P. completed its acquisition of Intertape Polymer Group Inc.
9. What pricing options are available for accessing the report?
Pricing options include single-user, multi-user, and enterprise licenses priced at USD 4750, USD 5250, and USD 8750 respectively.
10. Is the market size provided in terms of value or volume?
The market size is provided in terms of value, measured in Million and volume, measured in Kiloton.
11. Are there any specific market keywords associated with the report?
Yes, the market keyword associated with the report is "Electrical Tapes Market," which aids in identifying and referencing the specific market segment covered.
12. How do I determine which pricing option suits my needs best?
The pricing options vary based on user requirements and access needs. Individual users may opt for single-user licenses, while businesses requiring broader access may choose multi-user or enterprise licenses for cost-effective access to the report.
13. Are there any additional resources or data provided in the Electrical Tapes Market report?
While the report offers comprehensive insights, it's advisable to review the specific contents or supplementary materials provided to ascertain if additional resources or data are available.
14. How can I stay updated on further developments or reports in the Electrical Tapes Market?
To stay informed about further developments, trends, and reports in the Electrical Tapes Market, consider subscribing to industry newsletters, following relevant companies and organizations, or regularly checking reputable industry news sources and publications.
Methodology
Step 1 - Identification of Relevant Samples Size from Population Database


Step 2 - Approaches for Defining Global Market Size (Value, Volume* & Price*)

Note*: In applicable scenarios
Step 3 - Data Sources
Primary Research
- Web Analytics
- Survey Reports
- Research Institute
- Latest Research Reports
- Opinion Leaders
Secondary Research
- Annual Reports
- White Paper
- Latest Press Release
- Industry Association
- Paid Database
- Investor Presentations

Step 4 - Data Triangulation
Involves using different sources of information in order to increase the validity of a study
These sources are likely to be stakeholders in a program - participants, other researchers, program staff, other community members, and so on.
Then we put all data in single framework & apply various statistical tools to find out the dynamic on the market.
During the analysis stage, feedback from the stakeholder groups would be compared to determine areas of agreement as well as areas of divergence


