
Key Insights
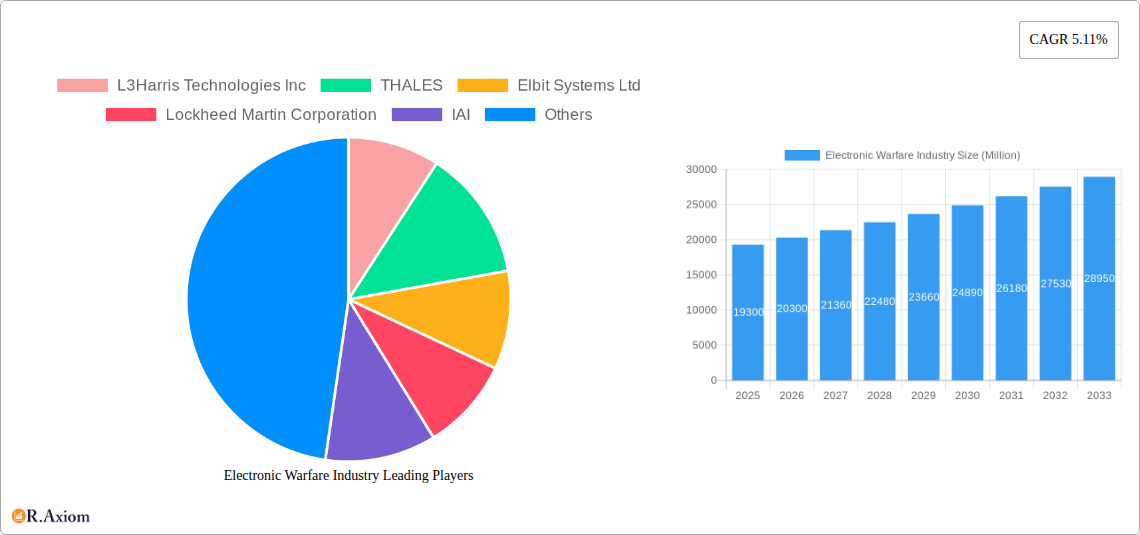
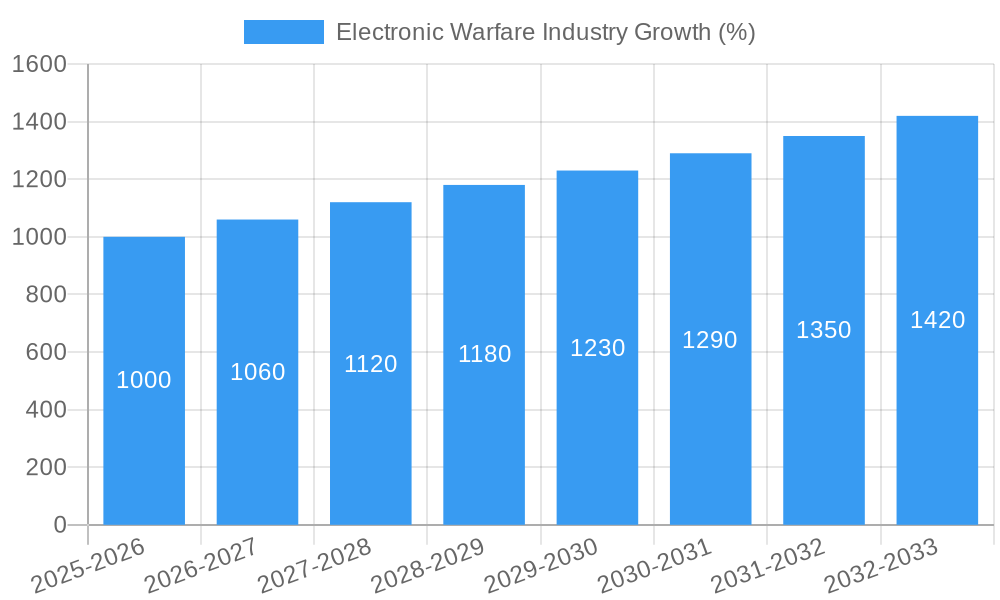
The Electronic Warfare (EW) market, valued at $19.30 billion in 2025, is projected to experience robust growth, driven by escalating geopolitical tensions, increasing defense budgets globally, and the continuous advancement of electronic technologies. The Compound Annual Growth Rate (CAGR) of 5.11% from 2025 to 2033 indicates a significant expansion of this market over the forecast period. Key drivers include the rising demand for sophisticated EW systems to counter emerging threats, such as advanced drones and cyber warfare capabilities. Furthermore, the integration of artificial intelligence (AI) and machine learning (ML) in EW systems is enhancing their effectiveness, leading to increased adoption across various platforms, including air, sea, land, and space. The market segmentation highlights strong demand across all platforms, with the air segment likely dominating due to its critical role in modern warfare. Growth is also propelled by the ongoing modernization of defense forces worldwide, particularly in regions experiencing heightened geopolitical instability. Competitive landscape analysis reveals major players like L3Harris Technologies, Thales, and Lockheed Martin dominating the market, fueling innovation and technological advancements within EW capabilities.
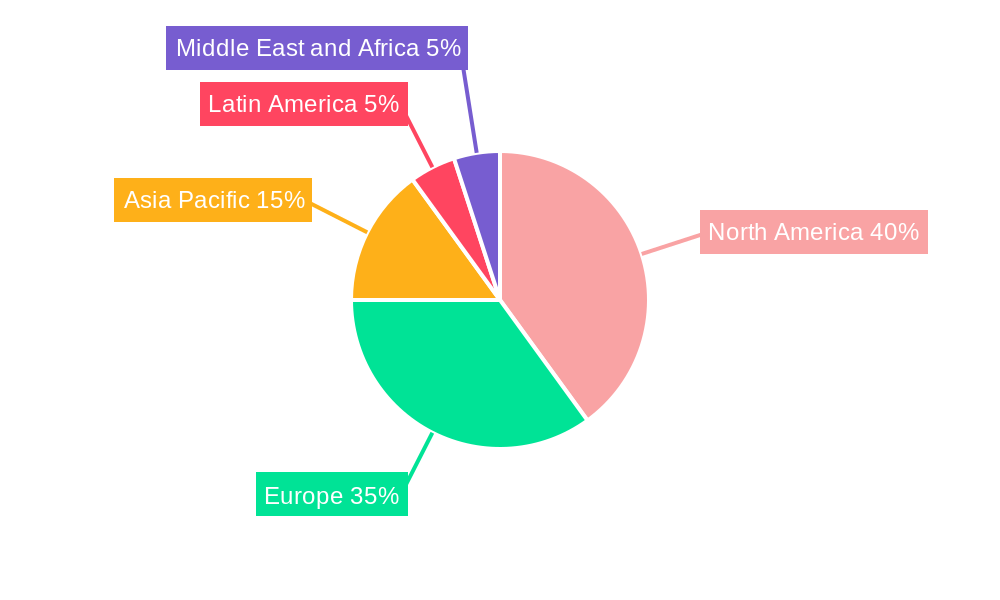
Significant restraining factors include the high cost of developing and deploying advanced EW systems, coupled with the need for continuous upgrades to maintain effectiveness against evolving countermeasures. However, the technological advancements in areas such as miniaturization, improved signal processing, and advanced algorithms are mitigating these challenges to a degree. The geographic distribution of the market shows a strong concentration in North America and Europe, reflecting the substantial defense budgets and technological prowess of these regions. However, the Asia-Pacific region is expected to witness significant growth due to increased military spending and modernization efforts in countries like China and India. This dynamic interplay of drivers, restraints, and regional variations ensures the EW market will remain a focal point for investment and technological innovation in the coming years.
Electronic Warfare Industry: A Comprehensive Market Analysis (2019-2033)
This comprehensive report provides an in-depth analysis of the Electronic Warfare (EW) industry, covering market size, growth drivers, technological advancements, competitive landscape, and future outlook. The study period spans from 2019 to 2033, with 2025 serving as both the base and estimated year. The report offers actionable insights for industry stakeholders, including manufacturers, suppliers, government agencies, and investors. The global Electronic Warfare market is projected to reach xx Million by 2033, exhibiting a CAGR of xx% during the forecast period (2025-2033).
Electronic Warfare Industry Market Concentration & Innovation
The Electronic Warfare industry exhibits a moderately concentrated market structure, with a few major players holding significant market share. L3Harris Technologies Inc, Thales, Lockheed Martin Corporation, and RTX Corporation are among the leading companies, collectively accounting for an estimated xx% of the global market in 2025. Market share dynamics are influenced by factors such as technological innovation, R&D investments, and strategic mergers and acquisitions (M&A). The value of M&A deals in the EW sector totalled approximately xx Million in 2024, reflecting a consolidation trend within the industry.
- Market Concentration: High, with top 5 players holding xx% market share in 2025.
- Innovation Drivers: Advancements in AI, machine learning, and miniaturization of EW systems.
- Regulatory Frameworks: Increasingly stringent regulations impacting technology export and cybersecurity.
- Product Substitutes: Limited direct substitutes, but competition from adjacent technologies (e.g., cybersecurity solutions).
- End-User Trends: Growing demand for advanced EW capabilities from military and defense organizations worldwide.
- M&A Activities: Significant M&A activity observed in recent years, with deal values exceeding xx Million in 2024.
Electronic Warfare Industry Industry Trends & Insights
The Electronic Warfare industry is experiencing robust growth driven by several key factors. The escalating geopolitical tensions and the increasing need for enhanced defense capabilities are significantly boosting demand for sophisticated EW systems. Technological advancements, such as the integration of artificial intelligence (AI) and machine learning (ML) algorithms, are improving the effectiveness and adaptability of these systems. Furthermore, the rising adoption of unmanned aerial vehicles (UAVs) and other autonomous platforms is creating new opportunities for EW technology integration. The market exhibits a competitive landscape with ongoing product development and strategic partnerships driving growth. The global EW market is anticipated to grow at a CAGR of xx% from 2025 to 2033, with significant penetration in the defense sector.
Dominant Markets & Segments in Electronic Warfare Industry
The North American region currently dominates the Electronic Warfare market, driven by substantial defense budgets and technological advancements. Within the capability segments, Electronic Attack holds the largest market share, followed by Electronic Protection and Electronic Support. Regarding platforms, the Air segment is the most prominent, driven by the increasing deployment of advanced fighter jets and UAVs.
- Leading Region: North America
- Leading Capability Segment: Electronic Attack
- Leading Platform Segment: Air
Key Drivers for North American Dominance:
- High defense spending.
- Robust technological infrastructure and R&D capabilities.
- Strong presence of major EW manufacturers.
Key Drivers for Electronic Attack Segment Dominance:
- Growing demand for offensive EW capabilities.
- Technological advancements in jamming and disruption technologies.
Key Drivers for Air Platform Segment Dominance:
- Increasing adoption of advanced fighter jets and UAVs.
- Growing focus on air superiority and dominance.
Electronic Warfare Industry Product Developments
Recent product innovations in the Electronic Warfare industry focus on enhancing system effectiveness, reducing size and weight, and improving integration with other defense systems. This includes the development of AI-powered EW systems for improved threat detection and response, miniaturized components for increased deployability, and advanced software-defined radios enabling greater flexibility and adaptability. These developments are enhancing the competitive advantages of leading manufacturers and expanding the market's overall capabilities.
Report Scope & Segmentation Analysis
This report comprehensively segments the Electronic Warfare market based on capability (Electronic Attack, Electronic Protection, Electronic Support) and platform (Air, Sea, Land, Space). Each segment's market size, growth projections, and competitive dynamics are analyzed in detail. The Electronic Attack segment is expected to witness the highest growth rate driven by increased demand for offensive EW capabilities, while the Air platform segment holds the largest market share owing to its extensive use in advanced fighter jets and unmanned aerial vehicles.
Key Drivers of Electronic Warfare Industry Growth
The Electronic Warfare industry's growth is propelled by escalating geopolitical tensions, increased defense budgets globally, technological advancements in AI, machine learning, and software-defined radios, and the rising demand for advanced EW capabilities in various military and civilian applications. The development and deployment of sophisticated EW systems are crucial for maintaining air and ground superiority, cyber defense, and information warfare advantages.
Challenges in the Electronic Warfare Industry Sector
The Electronic Warfare sector faces challenges such as stringent regulatory hurdles related to technology exports and cybersecurity concerns, complex and expensive supply chains, and intense competition among established players and emerging entrants. These factors can impact the industry's growth trajectory and necessitate strategic adaptation by market participants. The cost of developing and maintaining sophisticated EW systems can also pose a significant hurdle for smaller companies and less-developed nations.
Emerging Opportunities in Electronic Warfare Industry
Emerging opportunities exist in the development of AI-powered EW systems, the integration of EW capabilities into autonomous platforms like drones and robots, and expansion into new markets such as civilian applications, including protection against cyberattacks and securing critical infrastructure. Further development and implementation of anti-drone and anti-jamming technologies represent considerable future growth areas.
Leading Players in the Electronic Warfare Industry Market
- L3Harris Technologies Inc
- THALES
- Elbit Systems Ltd
- Lockheed Martin Corporation
- IAI
- RTX Corporation
- ASELSAN A S
- Leonardo S p A
- BAE Systems plc
- Northrop Grumman Corporation
- Saab AB
- HENSOLDT A
Key Developments in Electronic Warfare Industry Industry
- Jan 2023: Lockheed Martin announced a significant contract for the upgrade of its Electronic Warfare systems for a major military customer.
- July 2022: Thales unveiled a new generation of its Electronic Protection system featuring enhanced AI capabilities.
- Oct 2021: L3Harris Technologies and RTX Corporation announced a strategic partnership to develop next-generation Electronic Attack systems. (More details would be included in the full report with more key developments)
Strategic Outlook for Electronic Warfare Industry Market
The Electronic Warfare industry is poised for sustained growth, driven by escalating global security concerns, technological advancements, and increasing defense budgets. The integration of AI and ML, the development of more sophisticated jamming and counter-jamming technologies, and the expansion into new applications will shape the future market landscape. Companies that can successfully innovate and adapt to evolving technological and geopolitical dynamics will be well-positioned to capitalize on the significant opportunities within this dynamic sector.
Electronic Warfare Industry Segmentation
-
1. Capability
- 1.1. Electronic Attack
- 1.2. Electronic Protection
- 1.3. Electronic Support
-
2. Platform
- 2.1. Air
- 2.2. Sea
- 2.3. Land
- 2.4. Space
Electronic Warfare Industry Segmentation By Geography
-
1. North America
- 1.1. United States
- 1.2. Canda
-
2. Europe
- 2.1. United Kingdom
- 2.2. Germany
- 2.3. France
- 2.4. Russia
- 2.5. Rest of Europe
-
3. Asia Pacific
- 3.1. China
- 3.2. India
- 3.3. Japan
- 3.4. South Korea
- 3.5. Rest of Asia Pacific
-
4. Latin America
- 4.1. Brazil
- 4.2. Mexico
- 4.3. Rest of Latin America
-
5. Middle East and Africa
- 5.1. Saudi Arabia
- 5.2. United Arab Emirates
- 5.3. Rest of Middle East and Africa
Electronic Warfare Industry REPORT HIGHLIGHTS
| Aspects | Details |
|---|---|
| Study Period | 2019-2033 |
| Base Year | 2024 |
| Estimated Year | 2025 |
| Forecast Period | 2025-2033 |
| Historical Period | 2019-2024 |
| Growth Rate | CAGR of 5.11% from 2019-2033 |
| Segmentation |
|
Table of Contents
- 1. Introduction
- 1.1. Research Scope
- 1.2. Market Segmentation
- 1.3. Research Methodology
- 1.4. Definitions and Assumptions
- 2. Executive Summary
- 2.1. Introduction
- 3. Market Dynamics
- 3.1. Introduction
- 3.2. Market Drivers
- 3.2.1. Increase in Internet of Things (IoT) and Autonomous Systems; Rise in Demand for Military and Defense Satellite Communication Solutions
- 3.3. Market Restrains
- 3.3.1. Cybersecurity Threats to Satellite Communication; Interference in Transmission of Data
- 3.4. Market Trends
- 3.4.1. Sea Segment Will Showcase Remarkable Growth During the Forecast Period
- 4. Market Factor Analysis
- 4.1. Porters Five Forces
- 4.2. Supply/Value Chain
- 4.3. PESTEL analysis
- 4.4. Market Entropy
- 4.5. Patent/Trademark Analysis
- 5. Global Electronic Warfare Industry Analysis, Insights and Forecast, 2019-2031
- 5.1. Market Analysis, Insights and Forecast - by Capability
- 5.1.1. Electronic Attack
- 5.1.2. Electronic Protection
- 5.1.3. Electronic Support
- 5.2. Market Analysis, Insights and Forecast - by Platform
- 5.2.1. Air
- 5.2.2. Sea
- 5.2.3. Land
- 5.2.4. Space
- 5.3. Market Analysis, Insights and Forecast - by Region
- 5.3.1. North America
- 5.3.2. Europe
- 5.3.3. Asia Pacific
- 5.3.4. Latin America
- 5.3.5. Middle East and Africa
- 5.1. Market Analysis, Insights and Forecast - by Capability
- 6. North America Electronic Warfare Industry Analysis, Insights and Forecast, 2019-2031
- 6.1. Market Analysis, Insights and Forecast - by Capability
- 6.1.1. Electronic Attack
- 6.1.2. Electronic Protection
- 6.1.3. Electronic Support
- 6.2. Market Analysis, Insights and Forecast - by Platform
- 6.2.1. Air
- 6.2.2. Sea
- 6.2.3. Land
- 6.2.4. Space
- 6.1. Market Analysis, Insights and Forecast - by Capability
- 7. Europe Electronic Warfare Industry Analysis, Insights and Forecast, 2019-2031
- 7.1. Market Analysis, Insights and Forecast - by Capability
- 7.1.1. Electronic Attack
- 7.1.2. Electronic Protection
- 7.1.3. Electronic Support
- 7.2. Market Analysis, Insights and Forecast - by Platform
- 7.2.1. Air
- 7.2.2. Sea
- 7.2.3. Land
- 7.2.4. Space
- 7.1. Market Analysis, Insights and Forecast - by Capability
- 8. Asia Pacific Electronic Warfare Industry Analysis, Insights and Forecast, 2019-2031
- 8.1. Market Analysis, Insights and Forecast - by Capability
- 8.1.1. Electronic Attack
- 8.1.2. Electronic Protection
- 8.1.3. Electronic Support
- 8.2. Market Analysis, Insights and Forecast - by Platform
- 8.2.1. Air
- 8.2.2. Sea
- 8.2.3. Land
- 8.2.4. Space
- 8.1. Market Analysis, Insights and Forecast - by Capability
- 9. Latin America Electronic Warfare Industry Analysis, Insights and Forecast, 2019-2031
- 9.1. Market Analysis, Insights and Forecast - by Capability
- 9.1.1. Electronic Attack
- 9.1.2. Electronic Protection
- 9.1.3. Electronic Support
- 9.2. Market Analysis, Insights and Forecast - by Platform
- 9.2.1. Air
- 9.2.2. Sea
- 9.2.3. Land
- 9.2.4. Space
- 9.1. Market Analysis, Insights and Forecast - by Capability
- 10. Middle East and Africa Electronic Warfare Industry Analysis, Insights and Forecast, 2019-2031
- 10.1. Market Analysis, Insights and Forecast - by Capability
- 10.1.1. Electronic Attack
- 10.1.2. Electronic Protection
- 10.1.3. Electronic Support
- 10.2. Market Analysis, Insights and Forecast - by Platform
- 10.2.1. Air
- 10.2.2. Sea
- 10.2.3. Land
- 10.2.4. Space
- 10.1. Market Analysis, Insights and Forecast - by Capability
- 11. North America Electronic Warfare Industry Analysis, Insights and Forecast, 2019-2031
- 11.1. Market Analysis, Insights and Forecast - By Country/Sub-region
- 11.1.1 United States
- 11.1.2 Canda
- 12. Europe Electronic Warfare Industry Analysis, Insights and Forecast, 2019-2031
- 12.1. Market Analysis, Insights and Forecast - By Country/Sub-region
- 12.1.1 United Kingdom
- 12.1.2 Germany
- 12.1.3 France
- 12.1.4 Russia
- 12.1.5 Rest of Europe
- 13. Asia Pacific Electronic Warfare Industry Analysis, Insights and Forecast, 2019-2031
- 13.1. Market Analysis, Insights and Forecast - By Country/Sub-region
- 13.1.1 China
- 13.1.2 India
- 13.1.3 Japan
- 13.1.4 South Korea
- 13.1.5 Rest of Asia Pacific
- 14. Latin America Electronic Warfare Industry Analysis, Insights and Forecast, 2019-2031
- 14.1. Market Analysis, Insights and Forecast - By Country/Sub-region
- 14.1.1 Brazil
- 14.1.2 Mexico
- 14.1.3 Rest of Latin America
- 15. Middle East and Africa Electronic Warfare Industry Analysis, Insights and Forecast, 2019-2031
- 15.1. Market Analysis, Insights and Forecast - By Country/Sub-region
- 15.1.1 Saudi Arabia
- 15.1.2 United Arab Emirates
- 15.1.3 Rest of Middle East and Africa
- 16. Competitive Analysis
- 16.1. Global Market Share Analysis 2024
- 16.2. Company Profiles
- 16.2.1 L3Harris Technologies Inc
- 16.2.1.1. Overview
- 16.2.1.2. Products
- 16.2.1.3. SWOT Analysis
- 16.2.1.4. Recent Developments
- 16.2.1.5. Financials (Based on Availability)
- 16.2.2 THALES
- 16.2.2.1. Overview
- 16.2.2.2. Products
- 16.2.2.3. SWOT Analysis
- 16.2.2.4. Recent Developments
- 16.2.2.5. Financials (Based on Availability)
- 16.2.3 Elbit Systems Ltd
- 16.2.3.1. Overview
- 16.2.3.2. Products
- 16.2.3.3. SWOT Analysis
- 16.2.3.4. Recent Developments
- 16.2.3.5. Financials (Based on Availability)
- 16.2.4 Lockheed Martin Corporation
- 16.2.4.1. Overview
- 16.2.4.2. Products
- 16.2.4.3. SWOT Analysis
- 16.2.4.4. Recent Developments
- 16.2.4.5. Financials (Based on Availability)
- 16.2.5 IAI
- 16.2.5.1. Overview
- 16.2.5.2. Products
- 16.2.5.3. SWOT Analysis
- 16.2.5.4. Recent Developments
- 16.2.5.5. Financials (Based on Availability)
- 16.2.6 RTX Corporation
- 16.2.6.1. Overview
- 16.2.6.2. Products
- 16.2.6.3. SWOT Analysis
- 16.2.6.4. Recent Developments
- 16.2.6.5. Financials (Based on Availability)
- 16.2.7 ASELSAN A S
- 16.2.7.1. Overview
- 16.2.7.2. Products
- 16.2.7.3. SWOT Analysis
- 16.2.7.4. Recent Developments
- 16.2.7.5. Financials (Based on Availability)
- 16.2.8 Leonardo S p A
- 16.2.8.1. Overview
- 16.2.8.2. Products
- 16.2.8.3. SWOT Analysis
- 16.2.8.4. Recent Developments
- 16.2.8.5. Financials (Based on Availability)
- 16.2.9 BAE Systems plc
- 16.2.9.1. Overview
- 16.2.9.2. Products
- 16.2.9.3. SWOT Analysis
- 16.2.9.4. Recent Developments
- 16.2.9.5. Financials (Based on Availability)
- 16.2.10 Northrop Grumman Corporation
- 16.2.10.1. Overview
- 16.2.10.2. Products
- 16.2.10.3. SWOT Analysis
- 16.2.10.4. Recent Developments
- 16.2.10.5. Financials (Based on Availability)
- 16.2.11 Saab AB
- 16.2.11.1. Overview
- 16.2.11.2. Products
- 16.2.11.3. SWOT Analysis
- 16.2.11.4. Recent Developments
- 16.2.11.5. Financials (Based on Availability)
- 16.2.12 HENSOLDT A
- 16.2.12.1. Overview
- 16.2.12.2. Products
- 16.2.12.3. SWOT Analysis
- 16.2.12.4. Recent Developments
- 16.2.12.5. Financials (Based on Availability)
- 16.2.1 L3Harris Technologies Inc
List of Figures
- Figure 1: Global Electronic Warfare Industry Revenue Breakdown (Million, %) by Region 2024 & 2032
- Figure 2: North America Electronic Warfare Industry Revenue (Million), by Country 2024 & 2032
- Figure 3: North America Electronic Warfare Industry Revenue Share (%), by Country 2024 & 2032
- Figure 4: Europe Electronic Warfare Industry Revenue (Million), by Country 2024 & 2032
- Figure 5: Europe Electronic Warfare Industry Revenue Share (%), by Country 2024 & 2032
- Figure 6: Asia Pacific Electronic Warfare Industry Revenue (Million), by Country 2024 & 2032
- Figure 7: Asia Pacific Electronic Warfare Industry Revenue Share (%), by Country 2024 & 2032
- Figure 8: Latin America Electronic Warfare Industry Revenue (Million), by Country 2024 & 2032
- Figure 9: Latin America Electronic Warfare Industry Revenue Share (%), by Country 2024 & 2032
- Figure 10: Middle East and Africa Electronic Warfare Industry Revenue (Million), by Country 2024 & 2032
- Figure 11: Middle East and Africa Electronic Warfare Industry Revenue Share (%), by Country 2024 & 2032
- Figure 12: North America Electronic Warfare Industry Revenue (Million), by Capability 2024 & 2032
- Figure 13: North America Electronic Warfare Industry Revenue Share (%), by Capability 2024 & 2032
- Figure 14: North America Electronic Warfare Industry Revenue (Million), by Platform 2024 & 2032
- Figure 15: North America Electronic Warfare Industry Revenue Share (%), by Platform 2024 & 2032
- Figure 16: North America Electronic Warfare Industry Revenue (Million), by Country 2024 & 2032
- Figure 17: North America Electronic Warfare Industry Revenue Share (%), by Country 2024 & 2032
- Figure 18: Europe Electronic Warfare Industry Revenue (Million), by Capability 2024 & 2032
- Figure 19: Europe Electronic Warfare Industry Revenue Share (%), by Capability 2024 & 2032
- Figure 20: Europe Electronic Warfare Industry Revenue (Million), by Platform 2024 & 2032
- Figure 21: Europe Electronic Warfare Industry Revenue Share (%), by Platform 2024 & 2032
- Figure 22: Europe Electronic Warfare Industry Revenue (Million), by Country 2024 & 2032
- Figure 23: Europe Electronic Warfare Industry Revenue Share (%), by Country 2024 & 2032
- Figure 24: Asia Pacific Electronic Warfare Industry Revenue (Million), by Capability 2024 & 2032
- Figure 25: Asia Pacific Electronic Warfare Industry Revenue Share (%), by Capability 2024 & 2032
- Figure 26: Asia Pacific Electronic Warfare Industry Revenue (Million), by Platform 2024 & 2032
- Figure 27: Asia Pacific Electronic Warfare Industry Revenue Share (%), by Platform 2024 & 2032
- Figure 28: Asia Pacific Electronic Warfare Industry Revenue (Million), by Country 2024 & 2032
- Figure 29: Asia Pacific Electronic Warfare Industry Revenue Share (%), by Country 2024 & 2032
- Figure 30: Latin America Electronic Warfare Industry Revenue (Million), by Capability 2024 & 2032
- Figure 31: Latin America Electronic Warfare Industry Revenue Share (%), by Capability 2024 & 2032
- Figure 32: Latin America Electronic Warfare Industry Revenue (Million), by Platform 2024 & 2032
- Figure 33: Latin America Electronic Warfare Industry Revenue Share (%), by Platform 2024 & 2032
- Figure 34: Latin America Electronic Warfare Industry Revenue (Million), by Country 2024 & 2032
- Figure 35: Latin America Electronic Warfare Industry Revenue Share (%), by Country 2024 & 2032
- Figure 36: Middle East and Africa Electronic Warfare Industry Revenue (Million), by Capability 2024 & 2032
- Figure 37: Middle East and Africa Electronic Warfare Industry Revenue Share (%), by Capability 2024 & 2032
- Figure 38: Middle East and Africa Electronic Warfare Industry Revenue (Million), by Platform 2024 & 2032
- Figure 39: Middle East and Africa Electronic Warfare Industry Revenue Share (%), by Platform 2024 & 2032
- Figure 40: Middle East and Africa Electronic Warfare Industry Revenue (Million), by Country 2024 & 2032
- Figure 41: Middle East and Africa Electronic Warfare Industry Revenue Share (%), by Country 2024 & 2032
List of Tables
- Table 1: Global Electronic Warfare Industry Revenue Million Forecast, by Region 2019 & 2032
- Table 2: Global Electronic Warfare Industry Revenue Million Forecast, by Capability 2019 & 2032
- Table 3: Global Electronic Warfare Industry Revenue Million Forecast, by Platform 2019 & 2032
- Table 4: Global Electronic Warfare Industry Revenue Million Forecast, by Region 2019 & 2032
- Table 5: Global Electronic Warfare Industry Revenue Million Forecast, by Country 2019 & 2032
- Table 6: United States Electronic Warfare Industry Revenue (Million) Forecast, by Application 2019 & 2032
- Table 7: Canda Electronic Warfare Industry Revenue (Million) Forecast, by Application 2019 & 2032
- Table 8: Global Electronic Warfare Industry Revenue Million Forecast, by Country 2019 & 2032
- Table 9: United Kingdom Electronic Warfare Industry Revenue (Million) Forecast, by Application 2019 & 2032
- Table 10: Germany Electronic Warfare Industry Revenue (Million) Forecast, by Application 2019 & 2032
- Table 11: France Electronic Warfare Industry Revenue (Million) Forecast, by Application 2019 & 2032
- Table 12: Russia Electronic Warfare Industry Revenue (Million) Forecast, by Application 2019 & 2032
- Table 13: Rest of Europe Electronic Warfare Industry Revenue (Million) Forecast, by Application 2019 & 2032
- Table 14: Global Electronic Warfare Industry Revenue Million Forecast, by Country 2019 & 2032
- Table 15: China Electronic Warfare Industry Revenue (Million) Forecast, by Application 2019 & 2032
- Table 16: India Electronic Warfare Industry Revenue (Million) Forecast, by Application 2019 & 2032
- Table 17: Japan Electronic Warfare Industry Revenue (Million) Forecast, by Application 2019 & 2032
- Table 18: South Korea Electronic Warfare Industry Revenue (Million) Forecast, by Application 2019 & 2032
- Table 19: Rest of Asia Pacific Electronic Warfare Industry Revenue (Million) Forecast, by Application 2019 & 2032
- Table 20: Global Electronic Warfare Industry Revenue Million Forecast, by Country 2019 & 2032
- Table 21: Brazil Electronic Warfare Industry Revenue (Million) Forecast, by Application 2019 & 2032
- Table 22: Mexico Electronic Warfare Industry Revenue (Million) Forecast, by Application 2019 & 2032
- Table 23: Rest of Latin America Electronic Warfare Industry Revenue (Million) Forecast, by Application 2019 & 2032
- Table 24: Global Electronic Warfare Industry Revenue Million Forecast, by Country 2019 & 2032
- Table 25: Saudi Arabia Electronic Warfare Industry Revenue (Million) Forecast, by Application 2019 & 2032
- Table 26: United Arab Emirates Electronic Warfare Industry Revenue (Million) Forecast, by Application 2019 & 2032
- Table 27: Rest of Middle East and Africa Electronic Warfare Industry Revenue (Million) Forecast, by Application 2019 & 2032
- Table 28: Global Electronic Warfare Industry Revenue Million Forecast, by Capability 2019 & 2032
- Table 29: Global Electronic Warfare Industry Revenue Million Forecast, by Platform 2019 & 2032
- Table 30: Global Electronic Warfare Industry Revenue Million Forecast, by Country 2019 & 2032
- Table 31: United States Electronic Warfare Industry Revenue (Million) Forecast, by Application 2019 & 2032
- Table 32: Canda Electronic Warfare Industry Revenue (Million) Forecast, by Application 2019 & 2032
- Table 33: Global Electronic Warfare Industry Revenue Million Forecast, by Capability 2019 & 2032
- Table 34: Global Electronic Warfare Industry Revenue Million Forecast, by Platform 2019 & 2032
- Table 35: Global Electronic Warfare Industry Revenue Million Forecast, by Country 2019 & 2032
- Table 36: United Kingdom Electronic Warfare Industry Revenue (Million) Forecast, by Application 2019 & 2032
- Table 37: Germany Electronic Warfare Industry Revenue (Million) Forecast, by Application 2019 & 2032
- Table 38: France Electronic Warfare Industry Revenue (Million) Forecast, by Application 2019 & 2032
- Table 39: Russia Electronic Warfare Industry Revenue (Million) Forecast, by Application 2019 & 2032
- Table 40: Rest of Europe Electronic Warfare Industry Revenue (Million) Forecast, by Application 2019 & 2032
- Table 41: Global Electronic Warfare Industry Revenue Million Forecast, by Capability 2019 & 2032
- Table 42: Global Electronic Warfare Industry Revenue Million Forecast, by Platform 2019 & 2032
- Table 43: Global Electronic Warfare Industry Revenue Million Forecast, by Country 2019 & 2032
- Table 44: China Electronic Warfare Industry Revenue (Million) Forecast, by Application 2019 & 2032
- Table 45: India Electronic Warfare Industry Revenue (Million) Forecast, by Application 2019 & 2032
- Table 46: Japan Electronic Warfare Industry Revenue (Million) Forecast, by Application 2019 & 2032
- Table 47: South Korea Electronic Warfare Industry Revenue (Million) Forecast, by Application 2019 & 2032
- Table 48: Rest of Asia Pacific Electronic Warfare Industry Revenue (Million) Forecast, by Application 2019 & 2032
- Table 49: Global Electronic Warfare Industry Revenue Million Forecast, by Capability 2019 & 2032
- Table 50: Global Electronic Warfare Industry Revenue Million Forecast, by Platform 2019 & 2032
- Table 51: Global Electronic Warfare Industry Revenue Million Forecast, by Country 2019 & 2032
- Table 52: Brazil Electronic Warfare Industry Revenue (Million) Forecast, by Application 2019 & 2032
- Table 53: Mexico Electronic Warfare Industry Revenue (Million) Forecast, by Application 2019 & 2032
- Table 54: Rest of Latin America Electronic Warfare Industry Revenue (Million) Forecast, by Application 2019 & 2032
- Table 55: Global Electronic Warfare Industry Revenue Million Forecast, by Capability 2019 & 2032
- Table 56: Global Electronic Warfare Industry Revenue Million Forecast, by Platform 2019 & 2032
- Table 57: Global Electronic Warfare Industry Revenue Million Forecast, by Country 2019 & 2032
- Table 58: Saudi Arabia Electronic Warfare Industry Revenue (Million) Forecast, by Application 2019 & 2032
- Table 59: United Arab Emirates Electronic Warfare Industry Revenue (Million) Forecast, by Application 2019 & 2032
- Table 60: Rest of Middle East and Africa Electronic Warfare Industry Revenue (Million) Forecast, by Application 2019 & 2032
Frequently Asked Questions
1. What is the projected Compound Annual Growth Rate (CAGR) of the Electronic Warfare Industry?
The projected CAGR is approximately 5.11%.
2. Which companies are prominent players in the Electronic Warfare Industry?
Key companies in the market include L3Harris Technologies Inc, THALES, Elbit Systems Ltd, Lockheed Martin Corporation, IAI, RTX Corporation, ASELSAN A S, Leonardo S p A, BAE Systems plc, Northrop Grumman Corporation, Saab AB, HENSOLDT A.
3. What are the main segments of the Electronic Warfare Industry?
The market segments include Capability, Platform.
4. Can you provide details about the market size?
The market size is estimated to be USD 19.30 Million as of 2022.
5. What are some drivers contributing to market growth?
Increase in Internet of Things (IoT) and Autonomous Systems; Rise in Demand for Military and Defense Satellite Communication Solutions.
6. What are the notable trends driving market growth?
Sea Segment Will Showcase Remarkable Growth During the Forecast Period.
7. Are there any restraints impacting market growth?
Cybersecurity Threats to Satellite Communication; Interference in Transmission of Data.
8. Can you provide examples of recent developments in the market?
N/A
9. What pricing options are available for accessing the report?
Pricing options include single-user, multi-user, and enterprise licenses priced at USD 4750, USD 5250, and USD 8750 respectively.
10. Is the market size provided in terms of value or volume?
The market size is provided in terms of value, measured in Million.
11. Are there any specific market keywords associated with the report?
Yes, the market keyword associated with the report is "Electronic Warfare Industry," which aids in identifying and referencing the specific market segment covered.
12. How do I determine which pricing option suits my needs best?
The pricing options vary based on user requirements and access needs. Individual users may opt for single-user licenses, while businesses requiring broader access may choose multi-user or enterprise licenses for cost-effective access to the report.
13. Are there any additional resources or data provided in the Electronic Warfare Industry report?
While the report offers comprehensive insights, it's advisable to review the specific contents or supplementary materials provided to ascertain if additional resources or data are available.
14. How can I stay updated on further developments or reports in the Electronic Warfare Industry?
To stay informed about further developments, trends, and reports in the Electronic Warfare Industry, consider subscribing to industry newsletters, following relevant companies and organizations, or regularly checking reputable industry news sources and publications.
Methodology
Step 1 - Identification of Relevant Samples Size from Population Database


Step 2 - Approaches for Defining Global Market Size (Value, Volume* & Price*)

Note*: In applicable scenarios
Step 3 - Data Sources
Primary Research
- Web Analytics
- Survey Reports
- Research Institute
- Latest Research Reports
- Opinion Leaders
Secondary Research
- Annual Reports
- White Paper
- Latest Press Release
- Industry Association
- Paid Database
- Investor Presentations

Step 4 - Data Triangulation
Involves using different sources of information in order to increase the validity of a study
These sources are likely to be stakeholders in a program - participants, other researchers, program staff, other community members, and so on.
Then we put all data in single framework & apply various statistical tools to find out the dynamic on the market.
During the analysis stage, feedback from the stakeholder groups would be compared to determine areas of agreement as well as areas of divergence


