
Key Insights
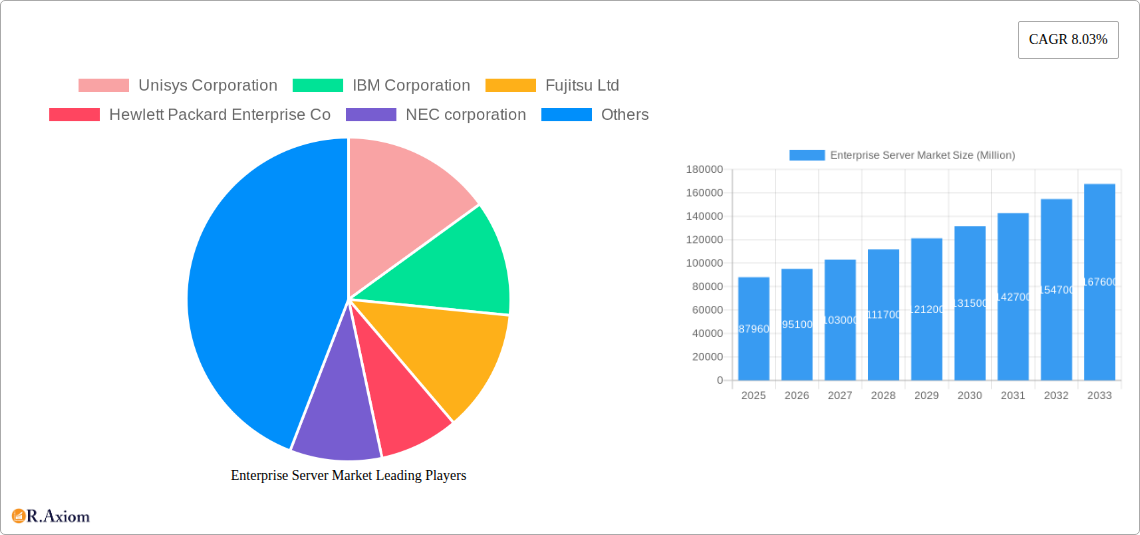
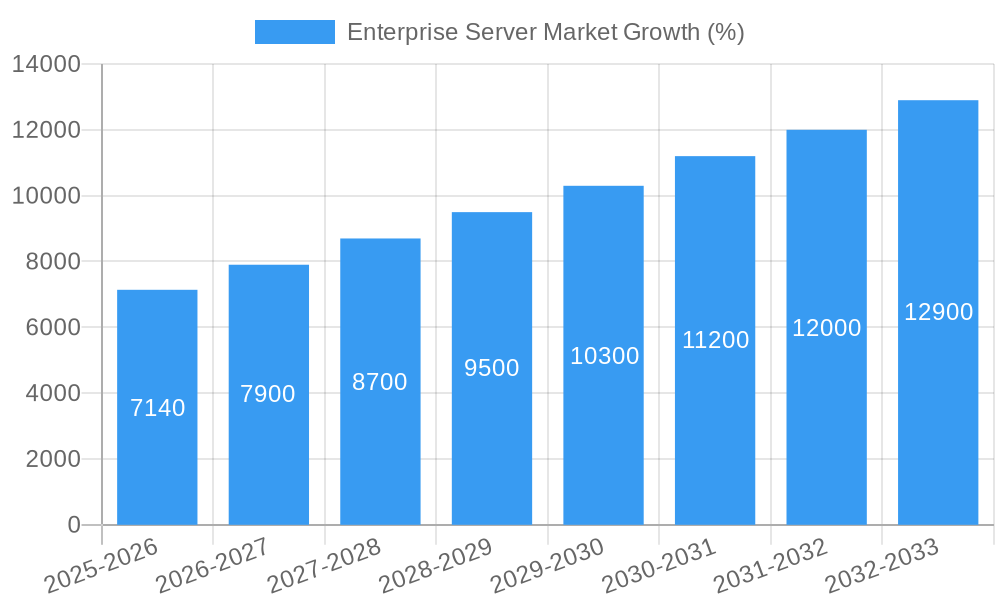
The global enterprise server market, valued at $87.96 billion in 2025, is projected to experience robust growth, driven by the increasing adoption of cloud computing, big data analytics, and artificial intelligence (AI). The compound annual growth rate (CAGR) of 8.03% from 2025 to 2033 signifies a significant expansion in market size, reaching an estimated $160 billion by 2033. This growth is fueled by the rising demand for high-performance computing across various end-user verticals, including IT and telecommunications, BFSI (Banking, Financial Services, and Insurance), manufacturing, and healthcare. The shift towards digital transformation initiatives and the need for enhanced data processing capabilities are key factors propelling market expansion. Furthermore, advancements in server technologies, such as the development of more energy-efficient and scalable blade and rack-optimized servers, are contributing to market growth. Competition among leading vendors like IBM, Hewlett Packard Enterprise, Dell Technologies, and Lenovo is driving innovation and fostering price competitiveness, making enterprise servers more accessible to a wider range of businesses.
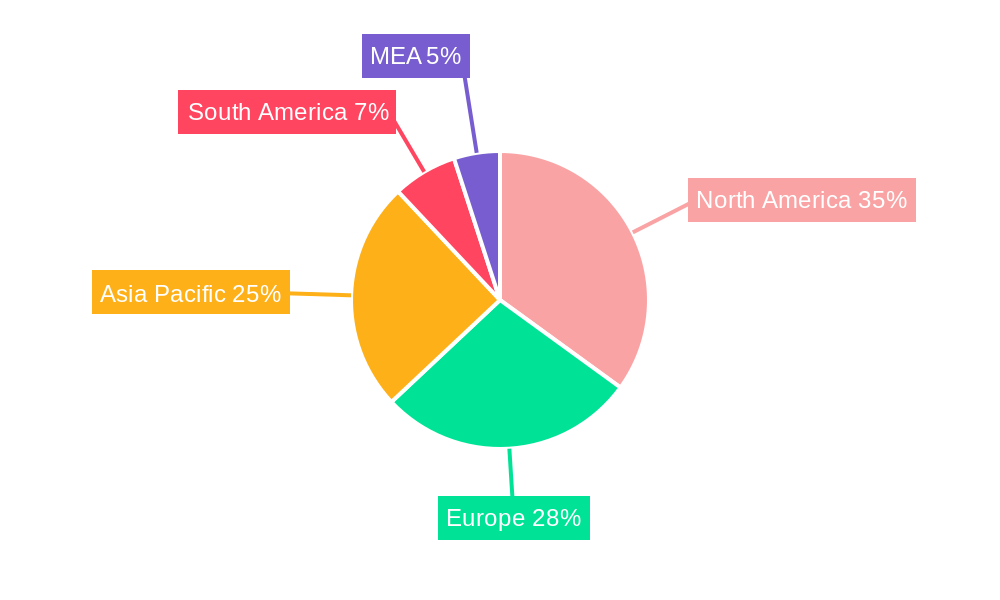
The market segmentation reveals a diverse landscape. The high-end server segment is expected to maintain a significant market share due to its ability to handle complex workloads and large datasets. However, the mid-range and volume server segments are experiencing growth, driven by the increasing adoption of virtualization and cloud-based solutions. Geographically, North America and Europe are currently the largest markets, but the Asia-Pacific region is projected to witness the fastest growth due to its rapidly expanding IT infrastructure and increasing digitalization efforts in countries like China and India. However, factors like the increasing cost of hardware and potential supply chain disruptions pose challenges to the market's continued growth. The market's evolution will likely be shaped by ongoing technological advancements, the increasing adoption of hybrid cloud models, and the need for robust cybersecurity solutions to protect critical data stored on enterprise servers.
Enterprise Server Market: A Comprehensive Report (2019-2033)
This detailed report provides a comprehensive analysis of the Enterprise Server Market, offering invaluable insights for industry stakeholders, investors, and strategic decision-makers. The study period covers 2019-2033, with 2025 serving as the base and estimated year. The report meticulously examines market dynamics, segmentation, key players, and future trends, offering actionable intelligence for navigating this evolving landscape. The total market size in 2025 is estimated at $XX Million.
Enterprise Server Market Market Concentration & Innovation
The Enterprise Server market exhibits a moderately concentrated landscape, with several major players holding significant market share. Companies like IBM Corporation, Hewlett Packard Enterprise Co, Dell Technologies Inc, and Lenovo Group Ltd dominate the market, although their individual market shares fluctuate based on product innovation and strategic partnerships. The market concentration ratio (CR4) for 2025 is estimated to be xx%. Innovation is a key driver, with continuous advancements in processing power, energy efficiency, and cloud-native architectures shaping market dynamics.
- Innovation Drivers: The increasing demand for high-performance computing, big data analytics, and artificial intelligence (AI) fuels innovation in server technologies. This includes the development of advanced processors, specialized accelerators (like GPUs), and optimized cooling systems.
- Regulatory Frameworks: Data privacy regulations (e.g., GDPR) and industry standards impact server design and deployment strategies, driving the adoption of secure and compliant solutions.
- Product Substitutes: Cloud computing services pose a significant challenge, offering alternative solutions to on-premise server deployments. However, dedicated enterprise servers continue to hold an edge in terms of security, control, and customization.
- End-User Trends: The shift towards digital transformation across various industries is a major growth driver, demanding increased server capacity and advanced functionalities.
- M&A Activities: The past five years have witnessed significant M&A activity in the enterprise server market, with deal values totaling an estimated $XX Million in 2024. These acquisitions aim to consolidate market share, expand product portfolios, and strengthen technological capabilities. Examples include (Specific examples of M&A deals with values would go here if data is available).
Enterprise Server Market Industry Trends & Insights
The Enterprise Server market is experiencing robust growth, fueled by several key factors. The compound annual growth rate (CAGR) for the forecast period (2025-2033) is projected to be xx%, driven by rising demand from diverse end-user verticals. Market penetration of cloud-native servers is increasing significantly, driven by the need for scalability, flexibility, and cost optimization. This trend is reshaping the competitive landscape, pushing traditional server vendors to adapt and innovate. Consumer preference is shifting toward environmentally friendly and energy-efficient solutions, pushing innovation in server design and cooling technologies.
Dominant Markets & Segments in Enterprise Server Market
Leading Regions/Countries: The North American and European markets currently dominate the enterprise server landscape, owing to strong technological advancements and high IT spending. However, the Asia-Pacific region is witnessing rapid growth, driven by increasing digitalization and infrastructure investments.
By Server Type: Rack-optimized servers constitute the largest segment in terms of market share and revenue (xx% of the market in 2025). This dominance is attributed to their cost-effectiveness, scalability, and suitability for data centers.
- Key Drivers for Rack-Optimized Servers:
- Growing demand for virtualization and cloud computing.
- Increasing adoption of data center infrastructure modernization initiatives.
- Cost optimization and high density requirements.
By End-user Vertical: The IT and Telecommunications sector represents a significant portion of the market, driven by the need for high-performance servers in cloud data centers and network infrastructure. The BFSI sector demonstrates strong growth, driven by the increasing demand for secure and reliable systems for financial transactions and data management.
By Operating System: Linux maintains a strong position in the market, driven by its open-source nature, flexibility, and suitability for various applications. Windows continues to hold a significant share, primarily in enterprise environments with legacy applications.
By Server Class: Mid-range servers hold the largest segment, driven by their balance of performance and cost-effectiveness across different applications.
Enterprise Server Market Product Developments
Recent product developments focus on enhanced processing power, improved energy efficiency, and advanced security features. Cloud-native architectures are gaining traction, with server vendors offering solutions optimized for cloud deployment models. The integration of AI and machine learning capabilities in servers is becoming increasingly common, enabling intelligent resource management and enhanced operational efficiency. The introduction of new processors, like those from Ampere, as showcased by HPE, reflects the trend toward higher core counts and optimized scale-out computing.
Report Scope & Segmentation Analysis
By Server Type: The report analyzes Blade, Multi-node, Tower, and Rack-Optimized servers, providing market size estimations and growth projections for each segment. Competitive dynamics within each segment are also assessed.
By End-user Vertical: The report covers IT and Telecommunication, BFSI, Manufacturing, Retail, Healthcare, Media and Entertainment, and Other End-user Verticals. Growth projections and market size for each sector are detailed.
By Operating System: The report analyses the market based on Linux, Windows, UNIX, and Other Operating Systems (i5/OS, z/OS, etc.), assessing their adoption rates and projected growth.
By Server Class: The report examines High-end, Mid-range, and Volume Servers, providing insights into their performance, pricing, and target markets.
Key Drivers of Enterprise Server Market Growth
Several factors contribute to the market's growth. Technological advancements such as the development of faster processors, increased memory capacity, and improved storage solutions drive demand. The increasing adoption of cloud computing and virtualization increases the need for efficient server infrastructure. Government initiatives promoting digital transformation and infrastructure development further fuel market growth.
Challenges in the Enterprise Server Market Sector
The market faces challenges like increasing competition from cloud service providers, fluctuating component costs impacting profitability, and the complexities associated with managing diverse hardware and software ecosystems. Supply chain disruptions and the global chip shortage have impacted production and availability of servers. Furthermore, security concerns and data breaches pose significant risks for both vendors and end-users, requiring constant investment in security features. These challenges, if not adequately addressed, could impact the overall market growth.
Emerging Opportunities in Enterprise Server Market
Emerging opportunities exist in the development and adoption of edge computing solutions, which address the need for low-latency processing closer to data sources. The increasing adoption of AI and machine learning applications requires specialized server hardware and software solutions. Growth in Internet of Things (IoT) applications fuels the demand for powerful, scalable servers capable of handling massive amounts of data.
Leading Players in the Enterprise Server Market Market
- Unisys Corporation
- IBM Corporation [IBM]
- Fujitsu Ltd [Fujitsu]
- Hewlett Packard Enterprise Co [HPE]
- NEC corporation [NEC]
- Hitachi Ltd [Hitachi]
- Cisco Systems Inc [Cisco]
- Toshiba Corporation [Toshiba]
- Oracle Corporation [Oracle]
- Dell Technologies Inc [Dell]
- Lenovo Group Ltd [Lenovo]
Key Developments in Enterprise Server Market Industry
June 2022: Hewlett Packard Enterprise announced its new line of cloud-native HPE ProLiant RL Gen 11 servers using Ampere processors, offering up to 128 cores per socket. This development significantly enhances scale-out computing capabilities, benefiting businesses with high-demand applications.
August 2022: Inspur Information integrated its AIStation platform with NVIDIA AI Enterprise, creating a unified AI computing resource platform for enterprise users. This enhances efficiency in leveraging AI resources and strengthens Inspur's position in the AI-driven server market.
Strategic Outlook for Enterprise Server Market Market
The Enterprise Server market is poised for continued growth, driven by sustained technological advancements, increasing digital transformation initiatives, and growing adoption of cloud-native solutions. The focus on AI, edge computing, and enhanced security features will shape future market developments. Companies that prioritize innovation, strategic partnerships, and a strong understanding of evolving customer needs are well-positioned to capitalize on the opportunities within this dynamic market.
Enterprise Server Market Segmentation
-
1. Operating System
- 1.1. Linux
- 1.2. Windows
- 1.3. UNIX
- 1.4. Other Operating Systems (i5/OS, z/OS, etc.)
-
2. Server Class
- 2.1. High-end Server
- 2.2. Mid-range Server
- 2.3. Volume Server
-
3. Server Type
- 3.1. Blade
- 3.2. Multi-node
- 3.3. Tower
- 3.4. Rack Optimized
-
4. End-user Vertical
- 4.1. IT and Telecommunication
- 4.2. BFSI
- 4.3. Manufacturing
- 4.4. Retail
- 4.5. Healthcare
- 4.6. Media and Entertainment
- 4.7. Other End-user Verticals
Enterprise Server Market Segmentation By Geography
- 1. North America
- 2. Europe
- 3. Asia Pacific
- 4. Latin America
- 5. Middle East and Africa
Enterprise Server Market REPORT HIGHLIGHTS
| Aspects | Details |
|---|---|
| Study Period | 2019-2033 |
| Base Year | 2024 |
| Estimated Year | 2025 |
| Forecast Period | 2025-2033 |
| Historical Period | 2019-2024 |
| Growth Rate | CAGR of 8.03% from 2019-2033 |
| Segmentation |
|
Table of Contents
- 1. Introduction
- 1.1. Research Scope
- 1.2. Market Segmentation
- 1.3. Research Methodology
- 1.4. Definitions and Assumptions
- 2. Executive Summary
- 2.1. Introduction
- 3. Market Dynamics
- 3.1. Introduction
- 3.2. Market Drivers
- 3.2.1. Increasing Adoption of Migration to the Cloud; Growth of Big Data
- 3.3. Market Restrains
- 3.3.1. Adoption of Server Virtualization
- 3.4. Market Trends
- 3.4.1. Rack Optimized Server Type to Witness High Growth
- 4. Market Factor Analysis
- 4.1. Porters Five Forces
- 4.2. Supply/Value Chain
- 4.3. PESTEL analysis
- 4.4. Market Entropy
- 4.5. Patent/Trademark Analysis
- 5. Global Enterprise Server Market Analysis, Insights and Forecast, 2019-2031
- 5.1. Market Analysis, Insights and Forecast - by Operating System
- 5.1.1. Linux
- 5.1.2. Windows
- 5.1.3. UNIX
- 5.1.4. Other Operating Systems (i5/OS, z/OS, etc.)
- 5.2. Market Analysis, Insights and Forecast - by Server Class
- 5.2.1. High-end Server
- 5.2.2. Mid-range Server
- 5.2.3. Volume Server
- 5.3. Market Analysis, Insights and Forecast - by Server Type
- 5.3.1. Blade
- 5.3.2. Multi-node
- 5.3.3. Tower
- 5.3.4. Rack Optimized
- 5.4. Market Analysis, Insights and Forecast - by End-user Vertical
- 5.4.1. IT and Telecommunication
- 5.4.2. BFSI
- 5.4.3. Manufacturing
- 5.4.4. Retail
- 5.4.5. Healthcare
- 5.4.6. Media and Entertainment
- 5.4.7. Other End-user Verticals
- 5.5. Market Analysis, Insights and Forecast - by Region
- 5.5.1. North America
- 5.5.2. Europe
- 5.5.3. Asia Pacific
- 5.5.4. Latin America
- 5.5.5. Middle East and Africa
- 5.1. Market Analysis, Insights and Forecast - by Operating System
- 6. North America Enterprise Server Market Analysis, Insights and Forecast, 2019-2031
- 6.1. Market Analysis, Insights and Forecast - by Operating System
- 6.1.1. Linux
- 6.1.2. Windows
- 6.1.3. UNIX
- 6.1.4. Other Operating Systems (i5/OS, z/OS, etc.)
- 6.2. Market Analysis, Insights and Forecast - by Server Class
- 6.2.1. High-end Server
- 6.2.2. Mid-range Server
- 6.2.3. Volume Server
- 6.3. Market Analysis, Insights and Forecast - by Server Type
- 6.3.1. Blade
- 6.3.2. Multi-node
- 6.3.3. Tower
- 6.3.4. Rack Optimized
- 6.4. Market Analysis, Insights and Forecast - by End-user Vertical
- 6.4.1. IT and Telecommunication
- 6.4.2. BFSI
- 6.4.3. Manufacturing
- 6.4.4. Retail
- 6.4.5. Healthcare
- 6.4.6. Media and Entertainment
- 6.4.7. Other End-user Verticals
- 6.1. Market Analysis, Insights and Forecast - by Operating System
- 7. Europe Enterprise Server Market Analysis, Insights and Forecast, 2019-2031
- 7.1. Market Analysis, Insights and Forecast - by Operating System
- 7.1.1. Linux
- 7.1.2. Windows
- 7.1.3. UNIX
- 7.1.4. Other Operating Systems (i5/OS, z/OS, etc.)
- 7.2. Market Analysis, Insights and Forecast - by Server Class
- 7.2.1. High-end Server
- 7.2.2. Mid-range Server
- 7.2.3. Volume Server
- 7.3. Market Analysis, Insights and Forecast - by Server Type
- 7.3.1. Blade
- 7.3.2. Multi-node
- 7.3.3. Tower
- 7.3.4. Rack Optimized
- 7.4. Market Analysis, Insights and Forecast - by End-user Vertical
- 7.4.1. IT and Telecommunication
- 7.4.2. BFSI
- 7.4.3. Manufacturing
- 7.4.4. Retail
- 7.4.5. Healthcare
- 7.4.6. Media and Entertainment
- 7.4.7. Other End-user Verticals
- 7.1. Market Analysis, Insights and Forecast - by Operating System
- 8. Asia Pacific Enterprise Server Market Analysis, Insights and Forecast, 2019-2031
- 8.1. Market Analysis, Insights and Forecast - by Operating System
- 8.1.1. Linux
- 8.1.2. Windows
- 8.1.3. UNIX
- 8.1.4. Other Operating Systems (i5/OS, z/OS, etc.)
- 8.2. Market Analysis, Insights and Forecast - by Server Class
- 8.2.1. High-end Server
- 8.2.2. Mid-range Server
- 8.2.3. Volume Server
- 8.3. Market Analysis, Insights and Forecast - by Server Type
- 8.3.1. Blade
- 8.3.2. Multi-node
- 8.3.3. Tower
- 8.3.4. Rack Optimized
- 8.4. Market Analysis, Insights and Forecast - by End-user Vertical
- 8.4.1. IT and Telecommunication
- 8.4.2. BFSI
- 8.4.3. Manufacturing
- 8.4.4. Retail
- 8.4.5. Healthcare
- 8.4.6. Media and Entertainment
- 8.4.7. Other End-user Verticals
- 8.1. Market Analysis, Insights and Forecast - by Operating System
- 9. Latin America Enterprise Server Market Analysis, Insights and Forecast, 2019-2031
- 9.1. Market Analysis, Insights and Forecast - by Operating System
- 9.1.1. Linux
- 9.1.2. Windows
- 9.1.3. UNIX
- 9.1.4. Other Operating Systems (i5/OS, z/OS, etc.)
- 9.2. Market Analysis, Insights and Forecast - by Server Class
- 9.2.1. High-end Server
- 9.2.2. Mid-range Server
- 9.2.3. Volume Server
- 9.3. Market Analysis, Insights and Forecast - by Server Type
- 9.3.1. Blade
- 9.3.2. Multi-node
- 9.3.3. Tower
- 9.3.4. Rack Optimized
- 9.4. Market Analysis, Insights and Forecast - by End-user Vertical
- 9.4.1. IT and Telecommunication
- 9.4.2. BFSI
- 9.4.3. Manufacturing
- 9.4.4. Retail
- 9.4.5. Healthcare
- 9.4.6. Media and Entertainment
- 9.4.7. Other End-user Verticals
- 9.1. Market Analysis, Insights and Forecast - by Operating System
- 10. Middle East and Africa Enterprise Server Market Analysis, Insights and Forecast, 2019-2031
- 10.1. Market Analysis, Insights and Forecast - by Operating System
- 10.1.1. Linux
- 10.1.2. Windows
- 10.1.3. UNIX
- 10.1.4. Other Operating Systems (i5/OS, z/OS, etc.)
- 10.2. Market Analysis, Insights and Forecast - by Server Class
- 10.2.1. High-end Server
- 10.2.2. Mid-range Server
- 10.2.3. Volume Server
- 10.3. Market Analysis, Insights and Forecast - by Server Type
- 10.3.1. Blade
- 10.3.2. Multi-node
- 10.3.3. Tower
- 10.3.4. Rack Optimized
- 10.4. Market Analysis, Insights and Forecast - by End-user Vertical
- 10.4.1. IT and Telecommunication
- 10.4.2. BFSI
- 10.4.3. Manufacturing
- 10.4.4. Retail
- 10.4.5. Healthcare
- 10.4.6. Media and Entertainment
- 10.4.7. Other End-user Verticals
- 10.1. Market Analysis, Insights and Forecast - by Operating System
- 11. North America Enterprise Server Market Analysis, Insights and Forecast, 2019-2031
- 11.1. Market Analysis, Insights and Forecast - By Country/Sub-region
- 11.1.1 United States
- 11.1.2 Canada
- 11.1.3 Mexico
- 12. Europe Enterprise Server Market Analysis, Insights and Forecast, 2019-2031
- 12.1. Market Analysis, Insights and Forecast - By Country/Sub-region
- 12.1.1 Germany
- 12.1.2 United Kingdom
- 12.1.3 France
- 12.1.4 Spain
- 12.1.5 Italy
- 12.1.6 Spain
- 12.1.7 Belgium
- 12.1.8 Netherland
- 12.1.9 Nordics
- 12.1.10 Rest of Europe
- 13. Asia Pacific Enterprise Server Market Analysis, Insights and Forecast, 2019-2031
- 13.1. Market Analysis, Insights and Forecast - By Country/Sub-region
- 13.1.1 China
- 13.1.2 Japan
- 13.1.3 India
- 13.1.4 South Korea
- 13.1.5 Southeast Asia
- 13.1.6 Australia
- 13.1.7 Indonesia
- 13.1.8 Phillipes
- 13.1.9 Singapore
- 13.1.10 Thailandc
- 13.1.11 Rest of Asia Pacific
- 14. South America Enterprise Server Market Analysis, Insights and Forecast, 2019-2031
- 14.1. Market Analysis, Insights and Forecast - By Country/Sub-region
- 14.1.1 Brazil
- 14.1.2 Argentina
- 14.1.3 Peru
- 14.1.4 Chile
- 14.1.5 Colombia
- 14.1.6 Ecuador
- 14.1.7 Venezuela
- 14.1.8 Rest of South America
- 15. North America Enterprise Server Market Analysis, Insights and Forecast, 2019-2031
- 15.1. Market Analysis, Insights and Forecast - By Country/Sub-region
- 15.1.1 United States
- 15.1.2 Canada
- 15.1.3 Mexico
- 16. MEA Enterprise Server Market Analysis, Insights and Forecast, 2019-2031
- 16.1. Market Analysis, Insights and Forecast - By Country/Sub-region
- 16.1.1 United Arab Emirates
- 16.1.2 Saudi Arabia
- 16.1.3 South Africa
- 16.1.4 Rest of Middle East and Africa
- 17. Competitive Analysis
- 17.1. Global Market Share Analysis 2024
- 17.2. Company Profiles
- 17.2.1 Unisys Corporation
- 17.2.1.1. Overview
- 17.2.1.2. Products
- 17.2.1.3. SWOT Analysis
- 17.2.1.4. Recent Developments
- 17.2.1.5. Financials (Based on Availability)
- 17.2.2 IBM Corporation
- 17.2.2.1. Overview
- 17.2.2.2. Products
- 17.2.2.3. SWOT Analysis
- 17.2.2.4. Recent Developments
- 17.2.2.5. Financials (Based on Availability)
- 17.2.3 Fujitsu Ltd
- 17.2.3.1. Overview
- 17.2.3.2. Products
- 17.2.3.3. SWOT Analysis
- 17.2.3.4. Recent Developments
- 17.2.3.5. Financials (Based on Availability)
- 17.2.4 Hewlett Packard Enterprise Co
- 17.2.4.1. Overview
- 17.2.4.2. Products
- 17.2.4.3. SWOT Analysis
- 17.2.4.4. Recent Developments
- 17.2.4.5. Financials (Based on Availability)
- 17.2.5 NEC corporation
- 17.2.5.1. Overview
- 17.2.5.2. Products
- 17.2.5.3. SWOT Analysis
- 17.2.5.4. Recent Developments
- 17.2.5.5. Financials (Based on Availability)
- 17.2.6 Hitachi Ltd
- 17.2.6.1. Overview
- 17.2.6.2. Products
- 17.2.6.3. SWOT Analysis
- 17.2.6.4. Recent Developments
- 17.2.6.5. Financials (Based on Availability)
- 17.2.7 Cisco Systems Inc
- 17.2.7.1. Overview
- 17.2.7.2. Products
- 17.2.7.3. SWOT Analysis
- 17.2.7.4. Recent Developments
- 17.2.7.5. Financials (Based on Availability)
- 17.2.8 Toshiba Corporation*List Not Exhaustive
- 17.2.8.1. Overview
- 17.2.8.2. Products
- 17.2.8.3. SWOT Analysis
- 17.2.8.4. Recent Developments
- 17.2.8.5. Financials (Based on Availability)
- 17.2.9 Oracle Corporation
- 17.2.9.1. Overview
- 17.2.9.2. Products
- 17.2.9.3. SWOT Analysis
- 17.2.9.4. Recent Developments
- 17.2.9.5. Financials (Based on Availability)
- 17.2.10 Dell Technologies Inc
- 17.2.10.1. Overview
- 17.2.10.2. Products
- 17.2.10.3. SWOT Analysis
- 17.2.10.4. Recent Developments
- 17.2.10.5. Financials (Based on Availability)
- 17.2.11 Lenovo Group Ltd
- 17.2.11.1. Overview
- 17.2.11.2. Products
- 17.2.11.3. SWOT Analysis
- 17.2.11.4. Recent Developments
- 17.2.11.5. Financials (Based on Availability)
- 17.2.1 Unisys Corporation
List of Figures
- Figure 1: Global Enterprise Server Market Revenue Breakdown (Million, %) by Region 2024 & 2032
- Figure 2: North America Enterprise Server Market Revenue (Million), by Country 2024 & 2032
- Figure 3: North America Enterprise Server Market Revenue Share (%), by Country 2024 & 2032
- Figure 4: Europe Enterprise Server Market Revenue (Million), by Country 2024 & 2032
- Figure 5: Europe Enterprise Server Market Revenue Share (%), by Country 2024 & 2032
- Figure 6: Asia Pacific Enterprise Server Market Revenue (Million), by Country 2024 & 2032
- Figure 7: Asia Pacific Enterprise Server Market Revenue Share (%), by Country 2024 & 2032
- Figure 8: South America Enterprise Server Market Revenue (Million), by Country 2024 & 2032
- Figure 9: South America Enterprise Server Market Revenue Share (%), by Country 2024 & 2032
- Figure 10: North America Enterprise Server Market Revenue (Million), by Country 2024 & 2032
- Figure 11: North America Enterprise Server Market Revenue Share (%), by Country 2024 & 2032
- Figure 12: MEA Enterprise Server Market Revenue (Million), by Country 2024 & 2032
- Figure 13: MEA Enterprise Server Market Revenue Share (%), by Country 2024 & 2032
- Figure 14: North America Enterprise Server Market Revenue (Million), by Operating System 2024 & 2032
- Figure 15: North America Enterprise Server Market Revenue Share (%), by Operating System 2024 & 2032
- Figure 16: North America Enterprise Server Market Revenue (Million), by Server Class 2024 & 2032
- Figure 17: North America Enterprise Server Market Revenue Share (%), by Server Class 2024 & 2032
- Figure 18: North America Enterprise Server Market Revenue (Million), by Server Type 2024 & 2032
- Figure 19: North America Enterprise Server Market Revenue Share (%), by Server Type 2024 & 2032
- Figure 20: North America Enterprise Server Market Revenue (Million), by End-user Vertical 2024 & 2032
- Figure 21: North America Enterprise Server Market Revenue Share (%), by End-user Vertical 2024 & 2032
- Figure 22: North America Enterprise Server Market Revenue (Million), by Country 2024 & 2032
- Figure 23: North America Enterprise Server Market Revenue Share (%), by Country 2024 & 2032
- Figure 24: Europe Enterprise Server Market Revenue (Million), by Operating System 2024 & 2032
- Figure 25: Europe Enterprise Server Market Revenue Share (%), by Operating System 2024 & 2032
- Figure 26: Europe Enterprise Server Market Revenue (Million), by Server Class 2024 & 2032
- Figure 27: Europe Enterprise Server Market Revenue Share (%), by Server Class 2024 & 2032
- Figure 28: Europe Enterprise Server Market Revenue (Million), by Server Type 2024 & 2032
- Figure 29: Europe Enterprise Server Market Revenue Share (%), by Server Type 2024 & 2032
- Figure 30: Europe Enterprise Server Market Revenue (Million), by End-user Vertical 2024 & 2032
- Figure 31: Europe Enterprise Server Market Revenue Share (%), by End-user Vertical 2024 & 2032
- Figure 32: Europe Enterprise Server Market Revenue (Million), by Country 2024 & 2032
- Figure 33: Europe Enterprise Server Market Revenue Share (%), by Country 2024 & 2032
- Figure 34: Asia Pacific Enterprise Server Market Revenue (Million), by Operating System 2024 & 2032
- Figure 35: Asia Pacific Enterprise Server Market Revenue Share (%), by Operating System 2024 & 2032
- Figure 36: Asia Pacific Enterprise Server Market Revenue (Million), by Server Class 2024 & 2032
- Figure 37: Asia Pacific Enterprise Server Market Revenue Share (%), by Server Class 2024 & 2032
- Figure 38: Asia Pacific Enterprise Server Market Revenue (Million), by Server Type 2024 & 2032
- Figure 39: Asia Pacific Enterprise Server Market Revenue Share (%), by Server Type 2024 & 2032
- Figure 40: Asia Pacific Enterprise Server Market Revenue (Million), by End-user Vertical 2024 & 2032
- Figure 41: Asia Pacific Enterprise Server Market Revenue Share (%), by End-user Vertical 2024 & 2032
- Figure 42: Asia Pacific Enterprise Server Market Revenue (Million), by Country 2024 & 2032
- Figure 43: Asia Pacific Enterprise Server Market Revenue Share (%), by Country 2024 & 2032
- Figure 44: Latin America Enterprise Server Market Revenue (Million), by Operating System 2024 & 2032
- Figure 45: Latin America Enterprise Server Market Revenue Share (%), by Operating System 2024 & 2032
- Figure 46: Latin America Enterprise Server Market Revenue (Million), by Server Class 2024 & 2032
- Figure 47: Latin America Enterprise Server Market Revenue Share (%), by Server Class 2024 & 2032
- Figure 48: Latin America Enterprise Server Market Revenue (Million), by Server Type 2024 & 2032
- Figure 49: Latin America Enterprise Server Market Revenue Share (%), by Server Type 2024 & 2032
- Figure 50: Latin America Enterprise Server Market Revenue (Million), by End-user Vertical 2024 & 2032
- Figure 51: Latin America Enterprise Server Market Revenue Share (%), by End-user Vertical 2024 & 2032
- Figure 52: Latin America Enterprise Server Market Revenue (Million), by Country 2024 & 2032
- Figure 53: Latin America Enterprise Server Market Revenue Share (%), by Country 2024 & 2032
- Figure 54: Middle East and Africa Enterprise Server Market Revenue (Million), by Operating System 2024 & 2032
- Figure 55: Middle East and Africa Enterprise Server Market Revenue Share (%), by Operating System 2024 & 2032
- Figure 56: Middle East and Africa Enterprise Server Market Revenue (Million), by Server Class 2024 & 2032
- Figure 57: Middle East and Africa Enterprise Server Market Revenue Share (%), by Server Class 2024 & 2032
- Figure 58: Middle East and Africa Enterprise Server Market Revenue (Million), by Server Type 2024 & 2032
- Figure 59: Middle East and Africa Enterprise Server Market Revenue Share (%), by Server Type 2024 & 2032
- Figure 60: Middle East and Africa Enterprise Server Market Revenue (Million), by End-user Vertical 2024 & 2032
- Figure 61: Middle East and Africa Enterprise Server Market Revenue Share (%), by End-user Vertical 2024 & 2032
- Figure 62: Middle East and Africa Enterprise Server Market Revenue (Million), by Country 2024 & 2032
- Figure 63: Middle East and Africa Enterprise Server Market Revenue Share (%), by Country 2024 & 2032
List of Tables
- Table 1: Global Enterprise Server Market Revenue Million Forecast, by Region 2019 & 2032
- Table 2: Global Enterprise Server Market Revenue Million Forecast, by Operating System 2019 & 2032
- Table 3: Global Enterprise Server Market Revenue Million Forecast, by Server Class 2019 & 2032
- Table 4: Global Enterprise Server Market Revenue Million Forecast, by Server Type 2019 & 2032
- Table 5: Global Enterprise Server Market Revenue Million Forecast, by End-user Vertical 2019 & 2032
- Table 6: Global Enterprise Server Market Revenue Million Forecast, by Region 2019 & 2032
- Table 7: Global Enterprise Server Market Revenue Million Forecast, by Country 2019 & 2032
- Table 8: United States Enterprise Server Market Revenue (Million) Forecast, by Application 2019 & 2032
- Table 9: Canada Enterprise Server Market Revenue (Million) Forecast, by Application 2019 & 2032
- Table 10: Mexico Enterprise Server Market Revenue (Million) Forecast, by Application 2019 & 2032
- Table 11: Global Enterprise Server Market Revenue Million Forecast, by Country 2019 & 2032
- Table 12: Germany Enterprise Server Market Revenue (Million) Forecast, by Application 2019 & 2032
- Table 13: United Kingdom Enterprise Server Market Revenue (Million) Forecast, by Application 2019 & 2032
- Table 14: France Enterprise Server Market Revenue (Million) Forecast, by Application 2019 & 2032
- Table 15: Spain Enterprise Server Market Revenue (Million) Forecast, by Application 2019 & 2032
- Table 16: Italy Enterprise Server Market Revenue (Million) Forecast, by Application 2019 & 2032
- Table 17: Spain Enterprise Server Market Revenue (Million) Forecast, by Application 2019 & 2032
- Table 18: Belgium Enterprise Server Market Revenue (Million) Forecast, by Application 2019 & 2032
- Table 19: Netherland Enterprise Server Market Revenue (Million) Forecast, by Application 2019 & 2032
- Table 20: Nordics Enterprise Server Market Revenue (Million) Forecast, by Application 2019 & 2032
- Table 21: Rest of Europe Enterprise Server Market Revenue (Million) Forecast, by Application 2019 & 2032
- Table 22: Global Enterprise Server Market Revenue Million Forecast, by Country 2019 & 2032
- Table 23: China Enterprise Server Market Revenue (Million) Forecast, by Application 2019 & 2032
- Table 24: Japan Enterprise Server Market Revenue (Million) Forecast, by Application 2019 & 2032
- Table 25: India Enterprise Server Market Revenue (Million) Forecast, by Application 2019 & 2032
- Table 26: South Korea Enterprise Server Market Revenue (Million) Forecast, by Application 2019 & 2032
- Table 27: Southeast Asia Enterprise Server Market Revenue (Million) Forecast, by Application 2019 & 2032
- Table 28: Australia Enterprise Server Market Revenue (Million) Forecast, by Application 2019 & 2032
- Table 29: Indonesia Enterprise Server Market Revenue (Million) Forecast, by Application 2019 & 2032
- Table 30: Phillipes Enterprise Server Market Revenue (Million) Forecast, by Application 2019 & 2032
- Table 31: Singapore Enterprise Server Market Revenue (Million) Forecast, by Application 2019 & 2032
- Table 32: Thailandc Enterprise Server Market Revenue (Million) Forecast, by Application 2019 & 2032
- Table 33: Rest of Asia Pacific Enterprise Server Market Revenue (Million) Forecast, by Application 2019 & 2032
- Table 34: Global Enterprise Server Market Revenue Million Forecast, by Country 2019 & 2032
- Table 35: Brazil Enterprise Server Market Revenue (Million) Forecast, by Application 2019 & 2032
- Table 36: Argentina Enterprise Server Market Revenue (Million) Forecast, by Application 2019 & 2032
- Table 37: Peru Enterprise Server Market Revenue (Million) Forecast, by Application 2019 & 2032
- Table 38: Chile Enterprise Server Market Revenue (Million) Forecast, by Application 2019 & 2032
- Table 39: Colombia Enterprise Server Market Revenue (Million) Forecast, by Application 2019 & 2032
- Table 40: Ecuador Enterprise Server Market Revenue (Million) Forecast, by Application 2019 & 2032
- Table 41: Venezuela Enterprise Server Market Revenue (Million) Forecast, by Application 2019 & 2032
- Table 42: Rest of South America Enterprise Server Market Revenue (Million) Forecast, by Application 2019 & 2032
- Table 43: Global Enterprise Server Market Revenue Million Forecast, by Country 2019 & 2032
- Table 44: United States Enterprise Server Market Revenue (Million) Forecast, by Application 2019 & 2032
- Table 45: Canada Enterprise Server Market Revenue (Million) Forecast, by Application 2019 & 2032
- Table 46: Mexico Enterprise Server Market Revenue (Million) Forecast, by Application 2019 & 2032
- Table 47: Global Enterprise Server Market Revenue Million Forecast, by Country 2019 & 2032
- Table 48: United Arab Emirates Enterprise Server Market Revenue (Million) Forecast, by Application 2019 & 2032
- Table 49: Saudi Arabia Enterprise Server Market Revenue (Million) Forecast, by Application 2019 & 2032
- Table 50: South Africa Enterprise Server Market Revenue (Million) Forecast, by Application 2019 & 2032
- Table 51: Rest of Middle East and Africa Enterprise Server Market Revenue (Million) Forecast, by Application 2019 & 2032
- Table 52: Global Enterprise Server Market Revenue Million Forecast, by Operating System 2019 & 2032
- Table 53: Global Enterprise Server Market Revenue Million Forecast, by Server Class 2019 & 2032
- Table 54: Global Enterprise Server Market Revenue Million Forecast, by Server Type 2019 & 2032
- Table 55: Global Enterprise Server Market Revenue Million Forecast, by End-user Vertical 2019 & 2032
- Table 56: Global Enterprise Server Market Revenue Million Forecast, by Country 2019 & 2032
- Table 57: Global Enterprise Server Market Revenue Million Forecast, by Operating System 2019 & 2032
- Table 58: Global Enterprise Server Market Revenue Million Forecast, by Server Class 2019 & 2032
- Table 59: Global Enterprise Server Market Revenue Million Forecast, by Server Type 2019 & 2032
- Table 60: Global Enterprise Server Market Revenue Million Forecast, by End-user Vertical 2019 & 2032
- Table 61: Global Enterprise Server Market Revenue Million Forecast, by Country 2019 & 2032
- Table 62: Global Enterprise Server Market Revenue Million Forecast, by Operating System 2019 & 2032
- Table 63: Global Enterprise Server Market Revenue Million Forecast, by Server Class 2019 & 2032
- Table 64: Global Enterprise Server Market Revenue Million Forecast, by Server Type 2019 & 2032
- Table 65: Global Enterprise Server Market Revenue Million Forecast, by End-user Vertical 2019 & 2032
- Table 66: Global Enterprise Server Market Revenue Million Forecast, by Country 2019 & 2032
- Table 67: Global Enterprise Server Market Revenue Million Forecast, by Operating System 2019 & 2032
- Table 68: Global Enterprise Server Market Revenue Million Forecast, by Server Class 2019 & 2032
- Table 69: Global Enterprise Server Market Revenue Million Forecast, by Server Type 2019 & 2032
- Table 70: Global Enterprise Server Market Revenue Million Forecast, by End-user Vertical 2019 & 2032
- Table 71: Global Enterprise Server Market Revenue Million Forecast, by Country 2019 & 2032
- Table 72: Global Enterprise Server Market Revenue Million Forecast, by Operating System 2019 & 2032
- Table 73: Global Enterprise Server Market Revenue Million Forecast, by Server Class 2019 & 2032
- Table 74: Global Enterprise Server Market Revenue Million Forecast, by Server Type 2019 & 2032
- Table 75: Global Enterprise Server Market Revenue Million Forecast, by End-user Vertical 2019 & 2032
- Table 76: Global Enterprise Server Market Revenue Million Forecast, by Country 2019 & 2032
Frequently Asked Questions
1. What is the projected Compound Annual Growth Rate (CAGR) of the Enterprise Server Market?
The projected CAGR is approximately 8.03%.
2. Which companies are prominent players in the Enterprise Server Market?
Key companies in the market include Unisys Corporation, IBM Corporation, Fujitsu Ltd, Hewlett Packard Enterprise Co, NEC corporation, Hitachi Ltd, Cisco Systems Inc, Toshiba Corporation*List Not Exhaustive, Oracle Corporation, Dell Technologies Inc, Lenovo Group Ltd.
3. What are the main segments of the Enterprise Server Market?
The market segments include Operating System, Server Class, Server Type, End-user Vertical.
4. Can you provide details about the market size?
The market size is estimated to be USD 87.96 Million as of 2022.
5. What are some drivers contributing to market growth?
Increasing Adoption of Migration to the Cloud; Growth of Big Data.
6. What are the notable trends driving market growth?
Rack Optimized Server Type to Witness High Growth.
7. Are there any restraints impacting market growth?
Adoption of Server Virtualization.
8. Can you provide examples of recent developments in the market?
August 2022: Inspur Information, an IT infrastructure solutions provider, is combining AIStation, its unified management and scheduling AI computing resource platform, with NVIDIA AI Enterprise, a cloud-native suite of AI and data analytics software, to provide enterprise users with an efficient platform for utilizing AI computing resources.
9. What pricing options are available for accessing the report?
Pricing options include single-user, multi-user, and enterprise licenses priced at USD 4750, USD 5250, and USD 8750 respectively.
10. Is the market size provided in terms of value or volume?
The market size is provided in terms of value, measured in Million.
11. Are there any specific market keywords associated with the report?
Yes, the market keyword associated with the report is "Enterprise Server Market," which aids in identifying and referencing the specific market segment covered.
12. How do I determine which pricing option suits my needs best?
The pricing options vary based on user requirements and access needs. Individual users may opt for single-user licenses, while businesses requiring broader access may choose multi-user or enterprise licenses for cost-effective access to the report.
13. Are there any additional resources or data provided in the Enterprise Server Market report?
While the report offers comprehensive insights, it's advisable to review the specific contents or supplementary materials provided to ascertain if additional resources or data are available.
14. How can I stay updated on further developments or reports in the Enterprise Server Market?
To stay informed about further developments, trends, and reports in the Enterprise Server Market, consider subscribing to industry newsletters, following relevant companies and organizations, or regularly checking reputable industry news sources and publications.
Methodology
Step 1 - Identification of Relevant Samples Size from Population Database


Step 2 - Approaches for Defining Global Market Size (Value, Volume* & Price*)

Note*: In applicable scenarios
Step 3 - Data Sources
Primary Research
- Web Analytics
- Survey Reports
- Research Institute
- Latest Research Reports
- Opinion Leaders
Secondary Research
- Annual Reports
- White Paper
- Latest Press Release
- Industry Association
- Paid Database
- Investor Presentations

Step 4 - Data Triangulation
Involves using different sources of information in order to increase the validity of a study
These sources are likely to be stakeholders in a program - participants, other researchers, program staff, other community members, and so on.
Then we put all data in single framework & apply various statistical tools to find out the dynamic on the market.
During the analysis stage, feedback from the stakeholder groups would be compared to determine areas of agreement as well as areas of divergence


