
Key Insights
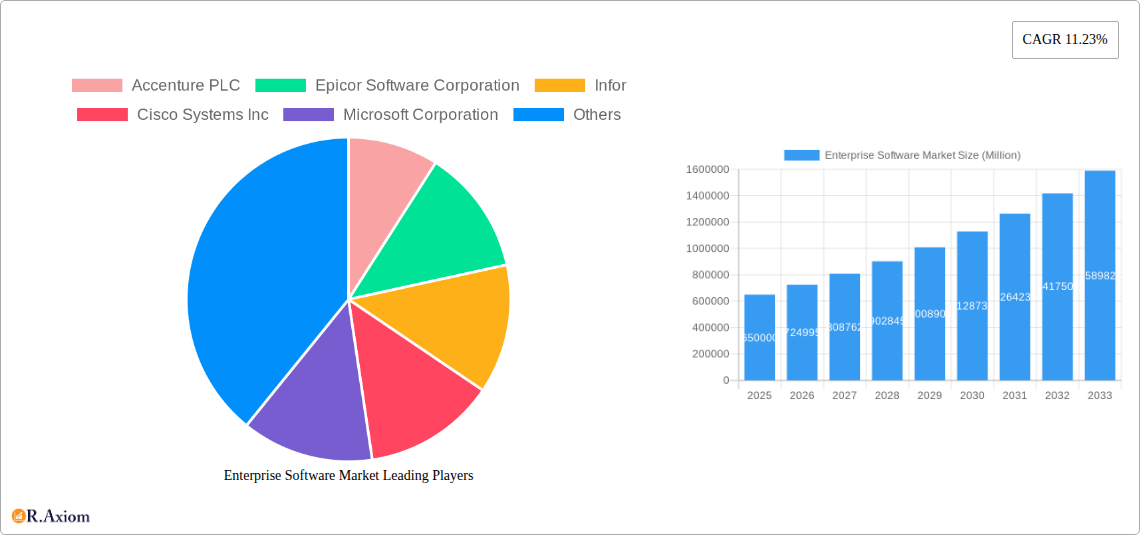
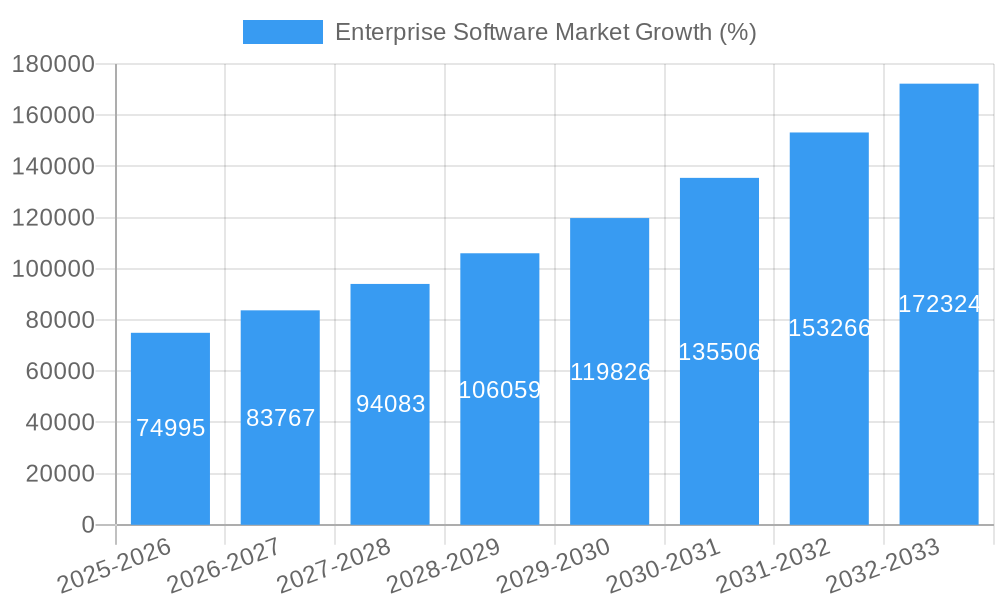
The global enterprise software market, currently valued at $0.65 trillion in 2025, is projected to experience robust growth, boasting a Compound Annual Growth Rate (CAGR) of 11.23% from 2025 to 2033. This expansion is driven by several key factors. The increasing adoption of cloud-based solutions offers businesses enhanced scalability, flexibility, and cost-effectiveness, fueling market growth significantly. Furthermore, the growing need for data-driven decision-making is boosting demand for Business Intelligence (BI) and analytics software. Automation across various business processes, facilitated by Enterprise Resource Planning (ERP) and Customer Relationship Management (CRM) systems, is another crucial driver. The expanding digital transformation initiatives across industries like BFSI (Banking, Financial Services, and Insurance), healthcare, and retail are further propelling the market forward. Specific software segments like cloud-based ERP and CRM solutions are demonstrating particularly high growth rates due to their adaptability and ease of integration.
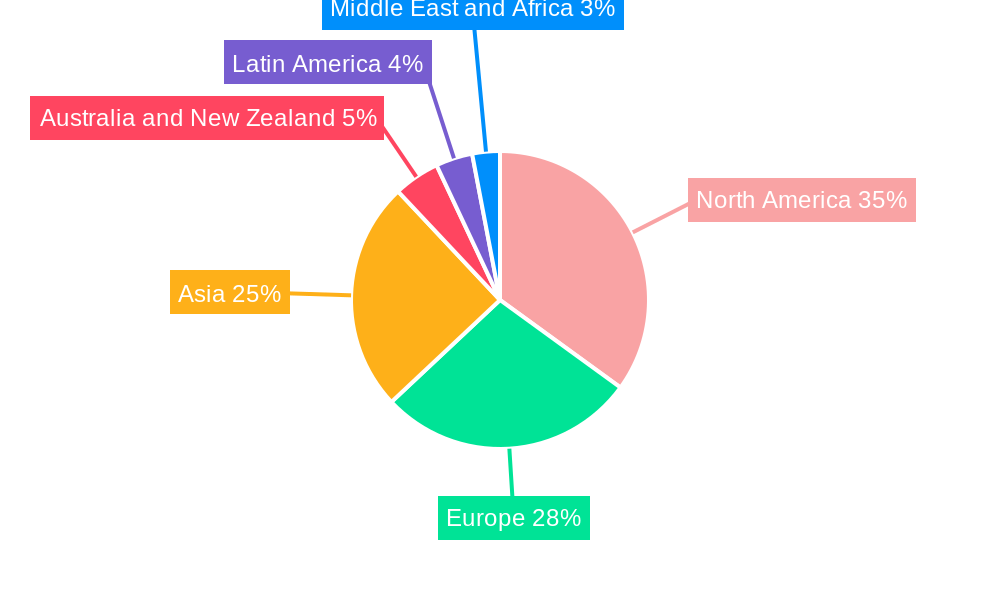
However, the market also faces certain challenges. High implementation and maintenance costs associated with some enterprise software solutions can act as a restraint, particularly for smaller businesses. Data security and privacy concerns, especially with the increasing reliance on cloud-based systems, also pose a significant hurdle. Competition among established players like SAP, Oracle, and Microsoft, alongside emerging niche players, is intense, leading to price pressures and the need for continuous innovation to maintain a competitive edge. Despite these challenges, the long-term outlook remains positive, driven by the ongoing digital transformation across all sectors and the continuous evolution of enterprise software to meet evolving business needs. The market's segmentation by software type (ERP, CRM, BI, Supply Chain), deployment (cloud, on-premise), and end-user vertical allows for a granular understanding of growth trajectories within specific niches. North America is expected to maintain a significant market share due to early adoption and strong technological infrastructure. However, Asia-Pacific is anticipated to witness the fastest growth owing to its expanding digital economy and increasing investments in technology.
Enterprise Software Market: A Comprehensive Report (2019-2033)
This in-depth report provides a comprehensive analysis of the Enterprise Software Market, encompassing market size, segmentation, growth drivers, challenges, and key players. The study period spans from 2019 to 2033, with 2025 serving as the base and estimated year. The report offers actionable insights for stakeholders across the enterprise software ecosystem, including vendors, investors, and technology professionals. The market is segmented by software type (ERP, CRM, BI, Supply Chain), deployment (Cloud, On-Premise), and end-user vertical (BFSI, Healthcare, Public & Institutions, Retail, Transportation, Manufacturing, and Others).
Enterprise Software Market Concentration & Innovation
The Enterprise Software Market exhibits a moderately concentrated landscape, dominated by established players like SAP SE, Oracle Corporation, Microsoft Corporation, and IBM. However, the market also features numerous niche players and emerging startups driving innovation. Market share dynamics are influenced by factors like technological advancements, strategic partnerships, and mergers & acquisitions (M&A). While precise market share figures require detailed analysis within the full report, a few key observations can be noted. SAP and Oracle likely hold significant market share in the ERP segment, while Salesforce and Microsoft are major players in CRM.
Innovation Drivers:
- Cloud computing and SaaS adoption.
- AI and machine learning integration.
- Increased demand for data analytics and BI tools.
- Growing focus on cybersecurity and data privacy.
Regulatory Frameworks: Data privacy regulations (like GDPR) and cybersecurity standards significantly impact market dynamics.
M&A Activities: The Enterprise Software Market witnesses considerable M&A activity, with deal values fluctuating based on market conditions. Larger players frequently acquire smaller companies to expand their product portfolios and technological capabilities. While specific deal values are not readily available, the report will offer more detailed analysis of significant M&A deals.
Product Substitutes: Open-source alternatives and custom-developed solutions pose a competitive threat to traditional enterprise software vendors.
End-User Trends: Businesses increasingly favor cloud-based solutions for their scalability, cost-effectiveness, and accessibility. The demand for integrated software solutions and improved user experience also influences market trends.
Enterprise Software Market Industry Trends & Insights
The Enterprise Software Market is experiencing robust growth, driven by increasing digital transformation initiatives across various industries. The global market is projected to reach xx Million by 2033, exhibiting a Compound Annual Growth Rate (CAGR) of xx% during the forecast period (2025-2033). This growth is fueled by several factors including:
Technological Disruptions: The adoption of cloud computing, AI, and IoT continues to reshape the market landscape, creating new opportunities and challenges for existing players. The shift towards cloud-based solutions is a major driver, with cloud penetration exceeding xx% in many segments.
Market Growth Drivers: Businesses are increasingly recognizing the importance of enterprise software for improving operational efficiency, enhancing customer experiences, and gaining a competitive edge. This has led to high demand across diverse sectors.
Consumer Preferences: Businesses now prioritize user-friendly, intuitive software solutions that integrate seamlessly with existing systems. This focus on user experience and ease of implementation is influencing product development.
Competitive Dynamics: The market features intense competition among established players and emerging startups. This competitive environment drives innovation and fosters pricing pressures.
Dominant Markets & Segments in Enterprise Software Market
The North American region currently holds a dominant position in the Enterprise Software Market, followed by Europe and Asia-Pacific. However, the Asia-Pacific region is witnessing the fastest growth rate due to increasing digital adoption.
Dominant Segments:
By Software Type: ERP software remains the largest segment, followed by CRM and supply chain management solutions. The BI segment is also showing substantial growth.
By Deployment: Cloud-based deployment is the fastest-growing segment, driven by its scalability, cost-effectiveness, and flexibility. However, on-premise deployments remain significant in certain sectors due to data security and regulatory requirements.
By End-User Vertical: The BFSI (Banking, Financial Services, and Insurance) sector currently constitutes a significant portion of the market, followed by manufacturing and healthcare. However, the retail and transportation sectors are also witnessing rapid growth in software adoption.
Key Drivers of Segment Dominance:
- Economic Policies: Government initiatives promoting digitalization and technology adoption significantly influence market growth in different regions.
- Infrastructure Development: Robust IT infrastructure facilitates the adoption of cloud-based solutions and advanced enterprise software.
- Industry-Specific Needs: Unique technological and operational needs within various industries drive specific software adoption patterns. For instance, the BFSI sector's reliance on robust security systems and data management tools influences software selection.
Enterprise Software Market Product Developments
Recent product innovations focus on incorporating AI, machine learning, and cloud-native technologies to enhance functionality and user experience. New product offerings emphasize improved integration capabilities, enhanced security features, and advanced analytics dashboards. These developments help enterprise software vendors gain a competitive edge by addressing evolving customer needs and optimizing operational efficiency.
Report Scope & Segmentation Analysis
This report provides a detailed analysis of the Enterprise Software Market across various segments, including:
By Software Type: ERP, CRM, BI, and Supply Chain software, with market size and growth projections for each segment. Competitive dynamics will be analyzed within each segment.
By Deployment: Cloud and On-Premise deployments, including comparative analysis of their adoption rates, cost structures, and security implications.
By End-User Vertical: BFSI, Healthcare, Public & Institutions, Retail, Transportation, Manufacturing, and Other End-User Verticals (Telecom, Defense, etc.), with analysis of industry-specific software adoption trends and market sizes.
Key Drivers of Enterprise Software Market Growth
Technological advancements, economic growth, and supportive regulatory frameworks are driving the expansion of the Enterprise Software Market. The increasing adoption of cloud computing, AI, and big data analytics are primary factors. Furthermore, government policies promoting digitalization and investments in IT infrastructure contribute to market growth.
Challenges in the Enterprise Software Market Sector
Challenges include the high cost of implementation, integration complexities, security concerns, and the need for skilled IT professionals. The competitive landscape, coupled with the continuous evolution of technology, presents further hurdles for both vendors and users. Vendor lock-in and the need for ongoing maintenance and upgrades also contribute to challenges within the sector.
Emerging Opportunities in Enterprise Software Market
Emerging opportunities exist in areas like AI-powered enterprise software, IoT integration, and the expansion of cloud-based services to underserved markets. The adoption of low-code/no-code platforms and the growth of specialized solutions for specific industry needs represent significant potential.
Leading Players in the Enterprise Software Market Market
- Accenture PLC (Accenture)
- Epicor Software Corporation (Epicor)
- Infor (Infor)
- Cisco Systems Inc (Cisco)
- Microsoft Corporation (Microsoft)
- International Business Machines Corporation (IBM)
- NetSuite Inc (NetSuite)
- Oracle Corporation (Oracle)
- Deltek Inc (Deltek)
- SAP SE (SAP)
Key Developments in Enterprise Software Market Industry
March 2023: Cisco Systems Inc and Telenor Group expanded their partnership to focus on ESG initiatives, as-a-service innovations, cybersecurity, and multi-cloud solutions. This collaboration aims to accelerate the availability of flexible and reliable cybersecurity solutions.
March 2023: Epicor Software Corporation reported significant growth in cloud adoption in Asia, fueled by strategic investments in markets like China, Indonesia, the Philippines, and Vietnam. This expansion reflects growing demand for cloud-based enterprise software in the region.
Strategic Outlook for Enterprise Software Market Market
The Enterprise Software Market is poised for continued growth driven by the ongoing digital transformation and the increasing adoption of cloud-based solutions. Future market potential lies in the integration of emerging technologies like AI, IoT, and blockchain. Companies that effectively adapt to these trends and address evolving customer needs will be well-positioned for success in this dynamic market.
Enterprise Software Market Segmentation
-
1. Software Type
- 1.1. ERP Software
- 1.2. CRM Software
- 1.3. BI Software
- 1.4. Supply chain Software
-
2. Deployment
- 2.1. Cloud
- 2.2. On-Premise
-
3. End-User Vertical
- 3.1. BFSI
- 3.2. Healthcare
- 3.3. Public & Institutions
- 3.4. Retail
- 3.5. Transportation
- 3.6. Manufacturing
- 3.7. Other End-User Verticals (Telecom, Defense, etc.)
Enterprise Software Market Segmentation By Geography
- 1. North America
- 2. Europe
- 3. Asia
- 4. Australia and New Zealand
- 5. Latin America
- 6. Middle East and Africa
Enterprise Software Market REPORT HIGHLIGHTS
| Aspects | Details |
|---|---|
| Study Period | 2019-2033 |
| Base Year | 2024 |
| Estimated Year | 2025 |
| Forecast Period | 2025-2033 |
| Historical Period | 2019-2024 |
| Growth Rate | CAGR of 11.23% from 2019-2033 |
| Segmentation |
|
Table of Contents
- 1. Introduction
- 1.1. Research Scope
- 1.2. Market Segmentation
- 1.3. Research Methodology
- 1.4. Definitions and Assumptions
- 2. Executive Summary
- 2.1. Introduction
- 3. Market Dynamics
- 3.1. Introduction
- 3.2. Market Drivers
- 3.2.1. Cloud & Networking-Based Advancements; Growing Demand from SMEs
- 3.3. Market Restrains
- 3.3.1. Security Vulnerability of Transaction Across the Insurance Platform using Blockchain Technology; Lack of Awareness about Blockchain in the Industry Professionals
- 3.4. Market Trends
- 3.4.1. Cloud is Expected to Hold Significant Share
- 4. Market Factor Analysis
- 4.1. Porters Five Forces
- 4.2. Supply/Value Chain
- 4.3. PESTEL analysis
- 4.4. Market Entropy
- 4.5. Patent/Trademark Analysis
- 5. Global Enterprise Software Market Analysis, Insights and Forecast, 2019-2031
- 5.1. Market Analysis, Insights and Forecast - by Software Type
- 5.1.1. ERP Software
- 5.1.2. CRM Software
- 5.1.3. BI Software
- 5.1.4. Supply chain Software
- 5.2. Market Analysis, Insights and Forecast - by Deployment
- 5.2.1. Cloud
- 5.2.2. On-Premise
- 5.3. Market Analysis, Insights and Forecast - by End-User Vertical
- 5.3.1. BFSI
- 5.3.2. Healthcare
- 5.3.3. Public & Institutions
- 5.3.4. Retail
- 5.3.5. Transportation
- 5.3.6. Manufacturing
- 5.3.7. Other End-User Verticals (Telecom, Defense, etc.)
- 5.4. Market Analysis, Insights and Forecast - by Region
- 5.4.1. North America
- 5.4.2. Europe
- 5.4.3. Asia
- 5.4.4. Australia and New Zealand
- 5.4.5. Latin America
- 5.4.6. Middle East and Africa
- 5.1. Market Analysis, Insights and Forecast - by Software Type
- 6. North America Enterprise Software Market Analysis, Insights and Forecast, 2019-2031
- 6.1. Market Analysis, Insights and Forecast - by Software Type
- 6.1.1. ERP Software
- 6.1.2. CRM Software
- 6.1.3. BI Software
- 6.1.4. Supply chain Software
- 6.2. Market Analysis, Insights and Forecast - by Deployment
- 6.2.1. Cloud
- 6.2.2. On-Premise
- 6.3. Market Analysis, Insights and Forecast - by End-User Vertical
- 6.3.1. BFSI
- 6.3.2. Healthcare
- 6.3.3. Public & Institutions
- 6.3.4. Retail
- 6.3.5. Transportation
- 6.3.6. Manufacturing
- 6.3.7. Other End-User Verticals (Telecom, Defense, etc.)
- 6.1. Market Analysis, Insights and Forecast - by Software Type
- 7. Europe Enterprise Software Market Analysis, Insights and Forecast, 2019-2031
- 7.1. Market Analysis, Insights and Forecast - by Software Type
- 7.1.1. ERP Software
- 7.1.2. CRM Software
- 7.1.3. BI Software
- 7.1.4. Supply chain Software
- 7.2. Market Analysis, Insights and Forecast - by Deployment
- 7.2.1. Cloud
- 7.2.2. On-Premise
- 7.3. Market Analysis, Insights and Forecast - by End-User Vertical
- 7.3.1. BFSI
- 7.3.2. Healthcare
- 7.3.3. Public & Institutions
- 7.3.4. Retail
- 7.3.5. Transportation
- 7.3.6. Manufacturing
- 7.3.7. Other End-User Verticals (Telecom, Defense, etc.)
- 7.1. Market Analysis, Insights and Forecast - by Software Type
- 8. Asia Enterprise Software Market Analysis, Insights and Forecast, 2019-2031
- 8.1. Market Analysis, Insights and Forecast - by Software Type
- 8.1.1. ERP Software
- 8.1.2. CRM Software
- 8.1.3. BI Software
- 8.1.4. Supply chain Software
- 8.2. Market Analysis, Insights and Forecast - by Deployment
- 8.2.1. Cloud
- 8.2.2. On-Premise
- 8.3. Market Analysis, Insights and Forecast - by End-User Vertical
- 8.3.1. BFSI
- 8.3.2. Healthcare
- 8.3.3. Public & Institutions
- 8.3.4. Retail
- 8.3.5. Transportation
- 8.3.6. Manufacturing
- 8.3.7. Other End-User Verticals (Telecom, Defense, etc.)
- 8.1. Market Analysis, Insights and Forecast - by Software Type
- 9. Australia and New Zealand Enterprise Software Market Analysis, Insights and Forecast, 2019-2031
- 9.1. Market Analysis, Insights and Forecast - by Software Type
- 9.1.1. ERP Software
- 9.1.2. CRM Software
- 9.1.3. BI Software
- 9.1.4. Supply chain Software
- 9.2. Market Analysis, Insights and Forecast - by Deployment
- 9.2.1. Cloud
- 9.2.2. On-Premise
- 9.3. Market Analysis, Insights and Forecast - by End-User Vertical
- 9.3.1. BFSI
- 9.3.2. Healthcare
- 9.3.3. Public & Institutions
- 9.3.4. Retail
- 9.3.5. Transportation
- 9.3.6. Manufacturing
- 9.3.7. Other End-User Verticals (Telecom, Defense, etc.)
- 9.1. Market Analysis, Insights and Forecast - by Software Type
- 10. Latin America Enterprise Software Market Analysis, Insights and Forecast, 2019-2031
- 10.1. Market Analysis, Insights and Forecast - by Software Type
- 10.1.1. ERP Software
- 10.1.2. CRM Software
- 10.1.3. BI Software
- 10.1.4. Supply chain Software
- 10.2. Market Analysis, Insights and Forecast - by Deployment
- 10.2.1. Cloud
- 10.2.2. On-Premise
- 10.3. Market Analysis, Insights and Forecast - by End-User Vertical
- 10.3.1. BFSI
- 10.3.2. Healthcare
- 10.3.3. Public & Institutions
- 10.3.4. Retail
- 10.3.5. Transportation
- 10.3.6. Manufacturing
- 10.3.7. Other End-User Verticals (Telecom, Defense, etc.)
- 10.1. Market Analysis, Insights and Forecast - by Software Type
- 11. Middle East and Africa Enterprise Software Market Analysis, Insights and Forecast, 2019-2031
- 11.1. Market Analysis, Insights and Forecast - by Software Type
- 11.1.1. ERP Software
- 11.1.2. CRM Software
- 11.1.3. BI Software
- 11.1.4. Supply chain Software
- 11.2. Market Analysis, Insights and Forecast - by Deployment
- 11.2.1. Cloud
- 11.2.2. On-Premise
- 11.3. Market Analysis, Insights and Forecast - by End-User Vertical
- 11.3.1. BFSI
- 11.3.2. Healthcare
- 11.3.3. Public & Institutions
- 11.3.4. Retail
- 11.3.5. Transportation
- 11.3.6. Manufacturing
- 11.3.7. Other End-User Verticals (Telecom, Defense, etc.)
- 11.1. Market Analysis, Insights and Forecast - by Software Type
- 12. North America Enterprise Software Market Analysis, Insights and Forecast, 2019-2031
- 12.1. Market Analysis, Insights and Forecast - By Country/Sub-region
- 12.1.1.
- 13. Europe Enterprise Software Market Analysis, Insights and Forecast, 2019-2031
- 13.1. Market Analysis, Insights and Forecast - By Country/Sub-region
- 13.1.1.
- 14. Asia Enterprise Software Market Analysis, Insights and Forecast, 2019-2031
- 14.1. Market Analysis, Insights and Forecast - By Country/Sub-region
- 14.1.1.
- 15. Australia and New Zealand Enterprise Software Market Analysis, Insights and Forecast, 2019-2031
- 15.1. Market Analysis, Insights and Forecast - By Country/Sub-region
- 15.1.1.
- 16. Latin America Enterprise Software Market Analysis, Insights and Forecast, 2019-2031
- 16.1. Market Analysis, Insights and Forecast - By Country/Sub-region
- 16.1.1.
- 17. Middle East and Africa Enterprise Software Market Analysis, Insights and Forecast, 2019-2031
- 17.1. Market Analysis, Insights and Forecast - By Country/Sub-region
- 17.1.1.
- 18. Competitive Analysis
- 18.1. Global Market Share Analysis 2024
- 18.2. Company Profiles
- 18.2.1 Accenture PLC
- 18.2.1.1. Overview
- 18.2.1.2. Products
- 18.2.1.3. SWOT Analysis
- 18.2.1.4. Recent Developments
- 18.2.1.5. Financials (Based on Availability)
- 18.2.2 Epicor Software Corporation
- 18.2.2.1. Overview
- 18.2.2.2. Products
- 18.2.2.3. SWOT Analysis
- 18.2.2.4. Recent Developments
- 18.2.2.5. Financials (Based on Availability)
- 18.2.3 Infor
- 18.2.3.1. Overview
- 18.2.3.2. Products
- 18.2.3.3. SWOT Analysis
- 18.2.3.4. Recent Developments
- 18.2.3.5. Financials (Based on Availability)
- 18.2.4 Cisco Systems Inc
- 18.2.4.1. Overview
- 18.2.4.2. Products
- 18.2.4.3. SWOT Analysis
- 18.2.4.4. Recent Developments
- 18.2.4.5. Financials (Based on Availability)
- 18.2.5 Microsoft Corporation
- 18.2.5.1. Overview
- 18.2.5.2. Products
- 18.2.5.3. SWOT Analysis
- 18.2.5.4. Recent Developments
- 18.2.5.5. Financials (Based on Availability)
- 18.2.6 International Business Machines Corporation
- 18.2.6.1. Overview
- 18.2.6.2. Products
- 18.2.6.3. SWOT Analysis
- 18.2.6.4. Recent Developments
- 18.2.6.5. Financials (Based on Availability)
- 18.2.7 NetSuite Inc
- 18.2.7.1. Overview
- 18.2.7.2. Products
- 18.2.7.3. SWOT Analysis
- 18.2.7.4. Recent Developments
- 18.2.7.5. Financials (Based on Availability)
- 18.2.8 Oracle Corporation
- 18.2.8.1. Overview
- 18.2.8.2. Products
- 18.2.8.3. SWOT Analysis
- 18.2.8.4. Recent Developments
- 18.2.8.5. Financials (Based on Availability)
- 18.2.9 Deltek Inc *List Not Exhaustive
- 18.2.9.1. Overview
- 18.2.9.2. Products
- 18.2.9.3. SWOT Analysis
- 18.2.9.4. Recent Developments
- 18.2.9.5. Financials (Based on Availability)
- 18.2.10 SAP SE
- 18.2.10.1. Overview
- 18.2.10.2. Products
- 18.2.10.3. SWOT Analysis
- 18.2.10.4. Recent Developments
- 18.2.10.5. Financials (Based on Availability)
- 18.2.1 Accenture PLC
List of Figures
- Figure 1: Global Enterprise Software Market Revenue Breakdown (Million, %) by Region 2024 & 2032
- Figure 2: North America Enterprise Software Market Revenue (Million), by Country 2024 & 2032
- Figure 3: North America Enterprise Software Market Revenue Share (%), by Country 2024 & 2032
- Figure 4: Europe Enterprise Software Market Revenue (Million), by Country 2024 & 2032
- Figure 5: Europe Enterprise Software Market Revenue Share (%), by Country 2024 & 2032
- Figure 6: Asia Enterprise Software Market Revenue (Million), by Country 2024 & 2032
- Figure 7: Asia Enterprise Software Market Revenue Share (%), by Country 2024 & 2032
- Figure 8: Australia and New Zealand Enterprise Software Market Revenue (Million), by Country 2024 & 2032
- Figure 9: Australia and New Zealand Enterprise Software Market Revenue Share (%), by Country 2024 & 2032
- Figure 10: Latin America Enterprise Software Market Revenue (Million), by Country 2024 & 2032
- Figure 11: Latin America Enterprise Software Market Revenue Share (%), by Country 2024 & 2032
- Figure 12: Middle East and Africa Enterprise Software Market Revenue (Million), by Country 2024 & 2032
- Figure 13: Middle East and Africa Enterprise Software Market Revenue Share (%), by Country 2024 & 2032
- Figure 14: North America Enterprise Software Market Revenue (Million), by Software Type 2024 & 2032
- Figure 15: North America Enterprise Software Market Revenue Share (%), by Software Type 2024 & 2032
- Figure 16: North America Enterprise Software Market Revenue (Million), by Deployment 2024 & 2032
- Figure 17: North America Enterprise Software Market Revenue Share (%), by Deployment 2024 & 2032
- Figure 18: North America Enterprise Software Market Revenue (Million), by End-User Vertical 2024 & 2032
- Figure 19: North America Enterprise Software Market Revenue Share (%), by End-User Vertical 2024 & 2032
- Figure 20: North America Enterprise Software Market Revenue (Million), by Country 2024 & 2032
- Figure 21: North America Enterprise Software Market Revenue Share (%), by Country 2024 & 2032
- Figure 22: Europe Enterprise Software Market Revenue (Million), by Software Type 2024 & 2032
- Figure 23: Europe Enterprise Software Market Revenue Share (%), by Software Type 2024 & 2032
- Figure 24: Europe Enterprise Software Market Revenue (Million), by Deployment 2024 & 2032
- Figure 25: Europe Enterprise Software Market Revenue Share (%), by Deployment 2024 & 2032
- Figure 26: Europe Enterprise Software Market Revenue (Million), by End-User Vertical 2024 & 2032
- Figure 27: Europe Enterprise Software Market Revenue Share (%), by End-User Vertical 2024 & 2032
- Figure 28: Europe Enterprise Software Market Revenue (Million), by Country 2024 & 2032
- Figure 29: Europe Enterprise Software Market Revenue Share (%), by Country 2024 & 2032
- Figure 30: Asia Enterprise Software Market Revenue (Million), by Software Type 2024 & 2032
- Figure 31: Asia Enterprise Software Market Revenue Share (%), by Software Type 2024 & 2032
- Figure 32: Asia Enterprise Software Market Revenue (Million), by Deployment 2024 & 2032
- Figure 33: Asia Enterprise Software Market Revenue Share (%), by Deployment 2024 & 2032
- Figure 34: Asia Enterprise Software Market Revenue (Million), by End-User Vertical 2024 & 2032
- Figure 35: Asia Enterprise Software Market Revenue Share (%), by End-User Vertical 2024 & 2032
- Figure 36: Asia Enterprise Software Market Revenue (Million), by Country 2024 & 2032
- Figure 37: Asia Enterprise Software Market Revenue Share (%), by Country 2024 & 2032
- Figure 38: Australia and New Zealand Enterprise Software Market Revenue (Million), by Software Type 2024 & 2032
- Figure 39: Australia and New Zealand Enterprise Software Market Revenue Share (%), by Software Type 2024 & 2032
- Figure 40: Australia and New Zealand Enterprise Software Market Revenue (Million), by Deployment 2024 & 2032
- Figure 41: Australia and New Zealand Enterprise Software Market Revenue Share (%), by Deployment 2024 & 2032
- Figure 42: Australia and New Zealand Enterprise Software Market Revenue (Million), by End-User Vertical 2024 & 2032
- Figure 43: Australia and New Zealand Enterprise Software Market Revenue Share (%), by End-User Vertical 2024 & 2032
- Figure 44: Australia and New Zealand Enterprise Software Market Revenue (Million), by Country 2024 & 2032
- Figure 45: Australia and New Zealand Enterprise Software Market Revenue Share (%), by Country 2024 & 2032
- Figure 46: Latin America Enterprise Software Market Revenue (Million), by Software Type 2024 & 2032
- Figure 47: Latin America Enterprise Software Market Revenue Share (%), by Software Type 2024 & 2032
- Figure 48: Latin America Enterprise Software Market Revenue (Million), by Deployment 2024 & 2032
- Figure 49: Latin America Enterprise Software Market Revenue Share (%), by Deployment 2024 & 2032
- Figure 50: Latin America Enterprise Software Market Revenue (Million), by End-User Vertical 2024 & 2032
- Figure 51: Latin America Enterprise Software Market Revenue Share (%), by End-User Vertical 2024 & 2032
- Figure 52: Latin America Enterprise Software Market Revenue (Million), by Country 2024 & 2032
- Figure 53: Latin America Enterprise Software Market Revenue Share (%), by Country 2024 & 2032
- Figure 54: Middle East and Africa Enterprise Software Market Revenue (Million), by Software Type 2024 & 2032
- Figure 55: Middle East and Africa Enterprise Software Market Revenue Share (%), by Software Type 2024 & 2032
- Figure 56: Middle East and Africa Enterprise Software Market Revenue (Million), by Deployment 2024 & 2032
- Figure 57: Middle East and Africa Enterprise Software Market Revenue Share (%), by Deployment 2024 & 2032
- Figure 58: Middle East and Africa Enterprise Software Market Revenue (Million), by End-User Vertical 2024 & 2032
- Figure 59: Middle East and Africa Enterprise Software Market Revenue Share (%), by End-User Vertical 2024 & 2032
- Figure 60: Middle East and Africa Enterprise Software Market Revenue (Million), by Country 2024 & 2032
- Figure 61: Middle East and Africa Enterprise Software Market Revenue Share (%), by Country 2024 & 2032
List of Tables
- Table 1: Global Enterprise Software Market Revenue Million Forecast, by Region 2019 & 2032
- Table 2: Global Enterprise Software Market Revenue Million Forecast, by Software Type 2019 & 2032
- Table 3: Global Enterprise Software Market Revenue Million Forecast, by Deployment 2019 & 2032
- Table 4: Global Enterprise Software Market Revenue Million Forecast, by End-User Vertical 2019 & 2032
- Table 5: Global Enterprise Software Market Revenue Million Forecast, by Region 2019 & 2032
- Table 6: Global Enterprise Software Market Revenue Million Forecast, by Country 2019 & 2032
- Table 7: Enterprise Software Market Revenue (Million) Forecast, by Application 2019 & 2032
- Table 8: Global Enterprise Software Market Revenue Million Forecast, by Country 2019 & 2032
- Table 9: Enterprise Software Market Revenue (Million) Forecast, by Application 2019 & 2032
- Table 10: Global Enterprise Software Market Revenue Million Forecast, by Country 2019 & 2032
- Table 11: Enterprise Software Market Revenue (Million) Forecast, by Application 2019 & 2032
- Table 12: Global Enterprise Software Market Revenue Million Forecast, by Country 2019 & 2032
- Table 13: Enterprise Software Market Revenue (Million) Forecast, by Application 2019 & 2032
- Table 14: Global Enterprise Software Market Revenue Million Forecast, by Country 2019 & 2032
- Table 15: Enterprise Software Market Revenue (Million) Forecast, by Application 2019 & 2032
- Table 16: Global Enterprise Software Market Revenue Million Forecast, by Country 2019 & 2032
- Table 17: Enterprise Software Market Revenue (Million) Forecast, by Application 2019 & 2032
- Table 18: Global Enterprise Software Market Revenue Million Forecast, by Software Type 2019 & 2032
- Table 19: Global Enterprise Software Market Revenue Million Forecast, by Deployment 2019 & 2032
- Table 20: Global Enterprise Software Market Revenue Million Forecast, by End-User Vertical 2019 & 2032
- Table 21: Global Enterprise Software Market Revenue Million Forecast, by Country 2019 & 2032
- Table 22: Global Enterprise Software Market Revenue Million Forecast, by Software Type 2019 & 2032
- Table 23: Global Enterprise Software Market Revenue Million Forecast, by Deployment 2019 & 2032
- Table 24: Global Enterprise Software Market Revenue Million Forecast, by End-User Vertical 2019 & 2032
- Table 25: Global Enterprise Software Market Revenue Million Forecast, by Country 2019 & 2032
- Table 26: Global Enterprise Software Market Revenue Million Forecast, by Software Type 2019 & 2032
- Table 27: Global Enterprise Software Market Revenue Million Forecast, by Deployment 2019 & 2032
- Table 28: Global Enterprise Software Market Revenue Million Forecast, by End-User Vertical 2019 & 2032
- Table 29: Global Enterprise Software Market Revenue Million Forecast, by Country 2019 & 2032
- Table 30: Global Enterprise Software Market Revenue Million Forecast, by Software Type 2019 & 2032
- Table 31: Global Enterprise Software Market Revenue Million Forecast, by Deployment 2019 & 2032
- Table 32: Global Enterprise Software Market Revenue Million Forecast, by End-User Vertical 2019 & 2032
- Table 33: Global Enterprise Software Market Revenue Million Forecast, by Country 2019 & 2032
- Table 34: Global Enterprise Software Market Revenue Million Forecast, by Software Type 2019 & 2032
- Table 35: Global Enterprise Software Market Revenue Million Forecast, by Deployment 2019 & 2032
- Table 36: Global Enterprise Software Market Revenue Million Forecast, by End-User Vertical 2019 & 2032
- Table 37: Global Enterprise Software Market Revenue Million Forecast, by Country 2019 & 2032
- Table 38: Global Enterprise Software Market Revenue Million Forecast, by Software Type 2019 & 2032
- Table 39: Global Enterprise Software Market Revenue Million Forecast, by Deployment 2019 & 2032
- Table 40: Global Enterprise Software Market Revenue Million Forecast, by End-User Vertical 2019 & 2032
- Table 41: Global Enterprise Software Market Revenue Million Forecast, by Country 2019 & 2032
Frequently Asked Questions
1. What is the projected Compound Annual Growth Rate (CAGR) of the Enterprise Software Market?
The projected CAGR is approximately 11.23%.
2. Which companies are prominent players in the Enterprise Software Market?
Key companies in the market include Accenture PLC, Epicor Software Corporation, Infor, Cisco Systems Inc, Microsoft Corporation, International Business Machines Corporation, NetSuite Inc, Oracle Corporation, Deltek Inc *List Not Exhaustive, SAP SE.
3. What are the main segments of the Enterprise Software Market?
The market segments include Software Type, Deployment, End-User Vertical.
4. Can you provide details about the market size?
The market size is estimated to be USD 0.65 Million as of 2022.
5. What are some drivers contributing to market growth?
Cloud & Networking-Based Advancements; Growing Demand from SMEs.
6. What are the notable trends driving market growth?
Cloud is Expected to Hold Significant Share.
7. Are there any restraints impacting market growth?
Security Vulnerability of Transaction Across the Insurance Platform using Blockchain Technology; Lack of Awareness about Blockchain in the Industry Professionals.
8. Can you provide examples of recent developments in the market?
March 2023: Cisco Systems Inc and Telenor Group announced an expanded relationship through the fifth iteration of their Joint Purpose Agreement (JPA) to advance strategic priorities that benefit markets in which the companies jointly operate. The focus areas of this collaboration include environmental, social, and governance (ESG) initiatives, as well as innovations related to as-a-service and automation. Additionally, the partnership will prioritize cybersecurity and the development of multi-cloud-as-a-service solutions. Cisco and Telenor plan to accelerate the availability of flexible, scalable, and reliable cybersecurity solutions as-a-service for both business and consumer customers.
9. What pricing options are available for accessing the report?
Pricing options include single-user, multi-user, and enterprise licenses priced at USD 4750, USD 5250, and USD 8750 respectively.
10. Is the market size provided in terms of value or volume?
The market size is provided in terms of value, measured in Million.
11. Are there any specific market keywords associated with the report?
Yes, the market keyword associated with the report is "Enterprise Software Market," which aids in identifying and referencing the specific market segment covered.
12. How do I determine which pricing option suits my needs best?
The pricing options vary based on user requirements and access needs. Individual users may opt for single-user licenses, while businesses requiring broader access may choose multi-user or enterprise licenses for cost-effective access to the report.
13. Are there any additional resources or data provided in the Enterprise Software Market report?
While the report offers comprehensive insights, it's advisable to review the specific contents or supplementary materials provided to ascertain if additional resources or data are available.
14. How can I stay updated on further developments or reports in the Enterprise Software Market?
To stay informed about further developments, trends, and reports in the Enterprise Software Market, consider subscribing to industry newsletters, following relevant companies and organizations, or regularly checking reputable industry news sources and publications.
Methodology
Step 1 - Identification of Relevant Samples Size from Population Database


Step 2 - Approaches for Defining Global Market Size (Value, Volume* & Price*)

Note*: In applicable scenarios
Step 3 - Data Sources
Primary Research
- Web Analytics
- Survey Reports
- Research Institute
- Latest Research Reports
- Opinion Leaders
Secondary Research
- Annual Reports
- White Paper
- Latest Press Release
- Industry Association
- Paid Database
- Investor Presentations

Step 4 - Data Triangulation
Involves using different sources of information in order to increase the validity of a study
These sources are likely to be stakeholders in a program - participants, other researchers, program staff, other community members, and so on.
Then we put all data in single framework & apply various statistical tools to find out the dynamic on the market.
During the analysis stage, feedback from the stakeholder groups would be compared to determine areas of agreement as well as areas of divergence


