
Key Insights
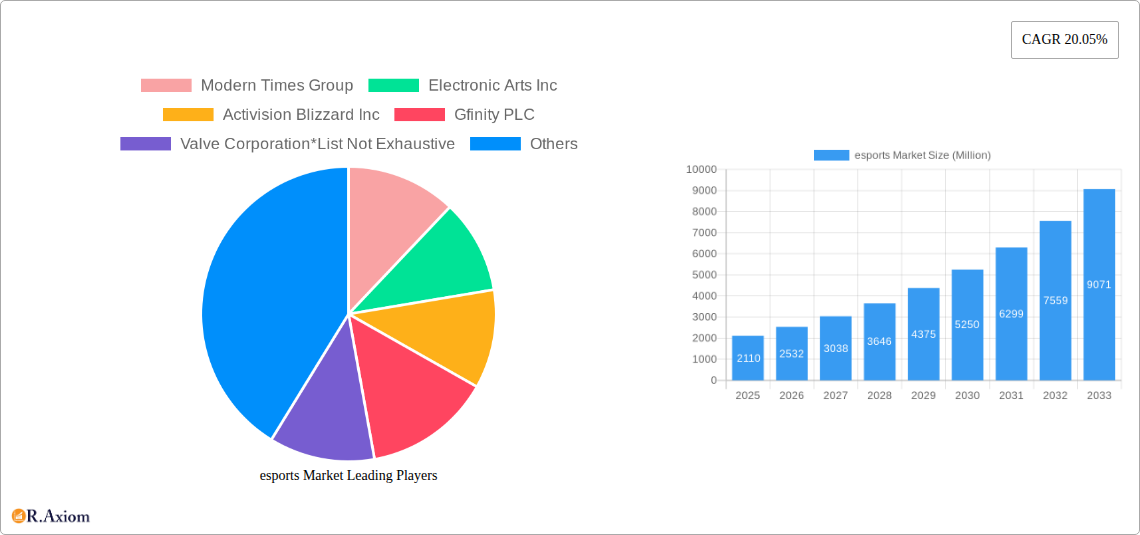
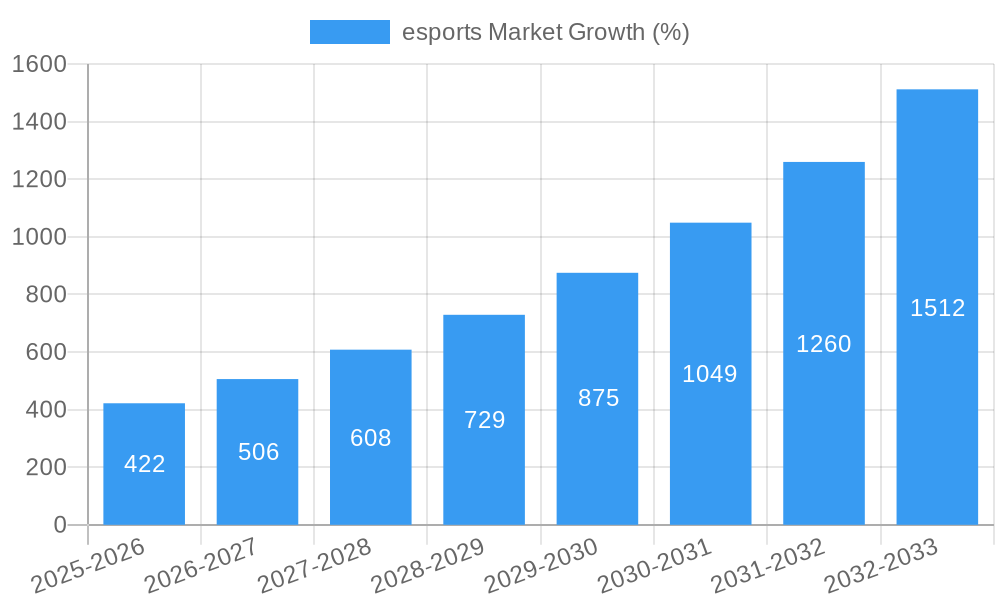
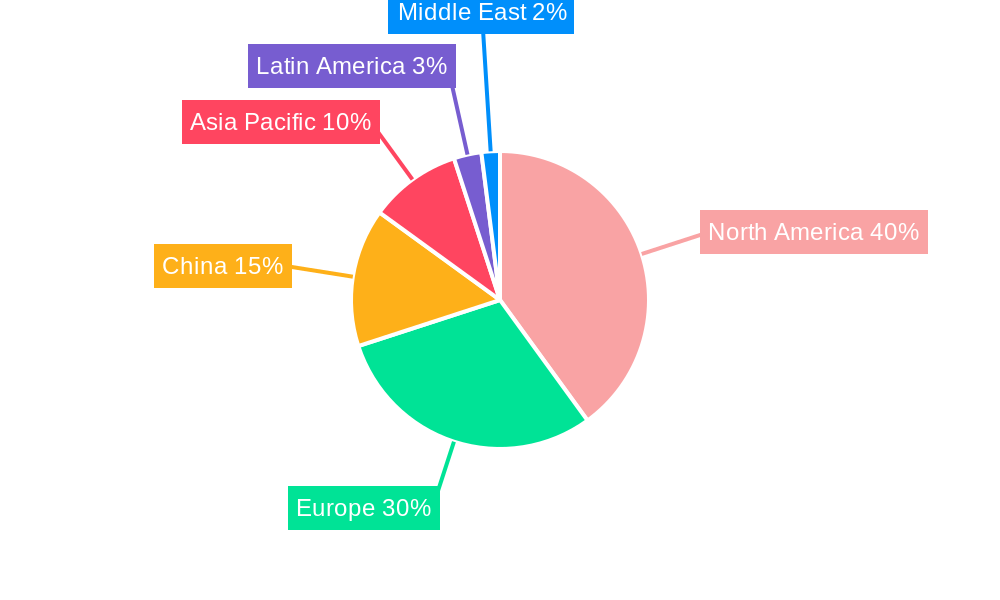
The esports market is experiencing explosive growth, projected to reach $2.11 billion in 2025 and exhibiting a remarkable Compound Annual Growth Rate (CAGR) of 20.05%. This expansion is fueled by several key factors. Increasing viewership and engagement across platforms like Twitch and YouTube are driving significant revenue streams from media rights, advertising, and sponsorships. The rise of mobile gaming and the expanding accessibility of high-speed internet are broadening the esports audience, particularly in emerging markets within Asia Pacific and Latin America. Furthermore, the professionalization of esports, with the emergence of established leagues, teams, and players, is attracting substantial investment and fostering a more structured and sustainable ecosystem. This professionalization is further evidenced by the involvement of major players like Electronic Arts, Activision Blizzard, and Tencent, signifying the industry's legitimacy and long-term growth potential.
However, challenges remain. Maintaining audience engagement and combating issues like player burnout and game toxicity are crucial for long-term sustainability. The intense competition within the industry, particularly among streaming platforms, requires continuous innovation and strategic partnerships to stay ahead. Furthermore, regulatory uncertainties and concerns regarding fair play and competitive integrity need careful consideration to ensure the long-term health of the esports ecosystem. Geographic diversification will also be key, tapping into the potential of regions such as Asia Pacific and Latin America, which are expected to exhibit above-average growth rates. The continued development of robust infrastructure, coupled with strategic investments in talent development and community building, will be essential for realizing the full potential of this dynamic industry.
Esports Market: A Comprehensive Report (2019-2033)
This comprehensive report provides an in-depth analysis of the esports market, covering the period from 2019 to 2033. It delves into market dynamics, key players, emerging trends, and future growth projections, offering actionable insights for industry stakeholders. With a base year of 2025 and a forecast period spanning 2025-2033, this report is an essential resource for understanding the current state and future trajectory of the rapidly expanding esports ecosystem. The global esports market is expected to reach xx Million by 2033.
Esports Market Concentration & Innovation
This section analyzes the competitive landscape of the esports market, examining market concentration, innovation drivers, regulatory frameworks, product substitutes, end-user trends, and mergers & acquisitions (M&A) activities. The analysis spans the period from 2019-2024 and projects trends through to 2033.
Market Concentration: The esports market exhibits a moderately concentrated structure, with a few major players holding significant market share. While precise figures fluctuate, a small number of companies (e.g., Tencent Holdings Ltd through Riot Games, Activision Blizzard, Electronic Arts) control a substantial portion of revenue streams through game development, publishing, and tournament organization. This concentration is partially offset by a large number of smaller, specialized companies focused on streaming, sponsorship, or specific game titles.
Innovation Drivers: Key innovation drivers include advancements in game technology (e.g., NVIDIA Reflex), the emergence of new esports titles, and the continuous evolution of streaming platforms and viewing experiences. Investments in VR/AR technologies also promise to significantly reshape gameplay and viewing experiences in the coming years.
Regulatory Frameworks: The regulatory landscape varies considerably across different jurisdictions, impacting aspects such as data privacy, gambling regulations, and the classification of esports as a sport. These regulations influence market entry, operations, and revenue streams.
Product Substitutes: While direct substitutes for esports are limited, other forms of entertainment, including traditional sports and other online gaming experiences, compete for consumer attention and spending.
End-User Trends: The esports audience is evolving, becoming more diverse and encompassing broader demographics. This necessitates a nuanced understanding of evolving consumer preferences regarding viewing habits, preferred platforms, and types of content.
M&A Activities: The esports industry has seen significant M&A activity in recent years, with larger companies acquiring smaller entities to expand their reach and capabilities. Deal values have varied considerably, with some transactions exceeding xx Million. Such activities directly affect market concentration and competitive dynamics.
Esports Market Industry Trends & Insights
The global esports market exhibits strong growth, driven by several key factors. Technological advancements, notably in streaming technology and gaming hardware, continuously enhance the viewer experience. The increasing popularity of mobile gaming expands accessibility and attracts a wider audience. Furthermore, the professionalization of esports, with the rise of franchised leagues and established tournament structures, lends credibility and attracts greater investment and media attention. The esports market is expected to grow at a Compound Annual Growth Rate (CAGR) of xx% during the forecast period. This growth is evident across various aspects of the market.
Market penetration is also increasing with the wider adoption of streaming platforms and the rising popularity of esports among casual gamers. The continuous release of new, engaging games contributes to the growth, alongside evolving sponsorship models that attract greater investment from traditional sports sponsors and brands. The rise of influencer marketing further amplifies market growth by generating widespread engagement and awareness. The competitive dynamics are shaped by the rivalry between established game publishers, the constant innovation in game mechanics, and the competition for talent and viewership.
Dominant Markets & Segments in Esports Market
This section analyzes the leading segments and regions within the esports market.
By Revenue Model:
- Media Rights: This segment is a major revenue generator, with contracts for broadcasting rights to tournaments and leagues generating substantial income. The growth of dedicated esports channels and streaming partnerships contributes significantly to this revenue stream.
- Advertising and Sponsorships: This segment has experienced explosive growth, with major brands investing heavily in esports sponsorships to tap into the engaged and growing audience. This is further fueled by the sophisticated analytics available to measure advertising impact.
- Merchandise and Tickets: The sale of merchandise and tickets to live esports events generates significant revenue, particularly in regions with well-established esports cultures and venues.
- Other Revenue Models: This includes revenue from in-game purchases, virtual goods, and other ancillary revenue streams associated with gaming and esports events.
By Streaming Platform:
- Twitch: Twitch remains the dominant streaming platform for esports, boasting a significant market share due to its dedicated features and large user base. The platform's established ecosystem and audience make it the preferred choice for many esports organizations and players.
- YouTube: YouTube Gaming continues to capture a significant portion of the esports viewership market, competing directly with Twitch and offering various monetization options for streamers and content creators.
- Other Streaming Platforms (DouYu and Huya): These platforms, while having strong regional dominance (primarily in China), contribute to the overall market diversification and provide alternative viewing options. Their growth is driven by localized content and features.
The North American and Asian regions currently dominate the esports market, driven by factors such as high internet penetration, strong gaming cultures, substantial investment in esports infrastructure, and supportive economic policies. Europe also plays a significant role, with growing investments and viewership.
Esports Market Product Developments
Recent product innovations emphasize enhanced gaming experiences, particularly focusing on lower latency and improved visual fidelity. The introduction of 1440p NVIDIA G-SYNC esports screens and NVIDIA Reflex technology highlights this trend, directly addressing the needs of professional and casual gamers. These technological advancements directly translate to a more immersive and competitive gaming environment, bolstering market growth and appeal. The market fit is strong, evident in the rapid adoption by professional gamers and the integration into several top-tier competitive games.
Report Scope & Segmentation Analysis
This report segments the esports market by revenue model (Media Rights, Advertising and Sponsorships, Merchandise and Tickets, Other Revenue Models) and by streaming platform (Twitch, YouTube, Other Streaming Platforms). Each segment is analyzed in detail, with growth projections provided for each. The competitive dynamics within each segment are also assessed, considering factors such as market concentration and the presence of key players. Market sizes are estimated for each segment, with detailed breakdowns provided for the historical period (2019-2024), the base year (2025), and the forecast period (2025-2033).
Key Drivers of esports Market Growth
Several factors drive the growth of the esports market. Technological advancements, like improved streaming capabilities and gaming hardware (as illustrated by NVIDIA Reflex), enhance the viewing and playing experiences. The rise of mobile gaming expands the accessibility of esports, allowing for broader participation. Increased investment from major corporations and brands, demonstrated through sponsorships and M&A activity, fuels market expansion. Furthermore, the professionalization of esports with the establishment of leagues and tournaments adds legitimacy, attracting both viewers and players. Government initiatives promoting gaming and esports in certain regions also contribute to the overall growth.
Challenges in the esports Market Sector
Despite significant growth, the esports market faces challenges. Regulatory uncertainties related to gambling and data privacy create hurdles for market expansion. Supply chain disruptions, particularly impacting gaming hardware, can limit market growth and potentially impact the quality of gameplay. Intense competition among game publishers, streaming platforms, and esports organizations creates pressure on margins and necessitates continual innovation. Furthermore, ensuring equitable competition and addressing issues of player burnout are crucial for long-term sustainability.
Emerging Opportunities in esports Market
The esports market presents several emerging opportunities. The growth of virtual and augmented reality (VR/AR) technologies promises new gaming and viewing experiences. Expansion into new geographic markets, particularly in developing regions with growing internet penetration, presents significant potential. The diversification of revenue streams, such as exploring new sponsorship models and integrating NFTs, will create further growth potential. Finally, the continued development of more inclusive and accessible esports experiences will be key to attracting new players and broadening the market.
Leading Players in the esports Market Market
- Modern Times Group
- Electronic Arts Inc
- Activision Blizzard Inc
- Gfinity PLC
- Valve Corporation
- Riot Games Inc ( Tencent Holdings Ltd)
- Faceit
- Epic Games Inc
- Capcom Co Ltd
Key Developments in esports Market Industry
- January 2022: Launch of 1440p NVIDIA G-SYNC esports screens and expansion of the NVIDIA Reflex low-latency ecosystem across multiple top-tier games. This development significantly improved gameplay experience, boosting market engagement.
- February 2022: Nintendo's Direct event showcased several new and remade games for the Switch, potentially expanding the esports market's game portfolio and attracting new audiences.
Strategic Outlook for esports Market Market
The esports market is poised for continued growth, driven by technological advancements, expanding viewership, and increasing investment. Future opportunities lie in exploring new revenue models, expanding into emerging markets, and leveraging the potential of VR/AR technologies. Strategic partnerships and collaborations will be critical in maintaining market leadership. The focus on ensuring player well-being and fostering a sustainable and inclusive esports ecosystem will be paramount for future success.
esports Market Segmentation
-
1. Revenue Model
- 1.1. Media Rights
- 1.2. Advertising and Sponsorships
- 1.3. Merchandise and Tickets
- 1.4. Other Revenue Models
-
2. Streaming Platform
- 2.1. Twitch
- 2.2. YouTube
- 2.3. Other Streaming Platforms ( DouYu and Hayu )
esports Market Segmentation By Geography
-
1. North America
- 1.1. United States
- 1.2. Canada
- 1.3. Rest of North America
-
2. Europe
- 2.1. Germany
- 2.2. United Kingdom
- 2.3. France
- 2.4. Rest of Europe
- 3. China
- 4. Asia Pacific
-
5. Japan
- 5.1. India
- 5.2. South Korea
- 5.3. Rest of Asia Pacific
- 6. Latin America
- 7. Middle East
esports Market REPORT HIGHLIGHTS
| Aspects | Details |
|---|---|
| Study Period | 2019-2033 |
| Base Year | 2024 |
| Estimated Year | 2025 |
| Forecast Period | 2025-2033 |
| Historical Period | 2019-2024 |
| Growth Rate | CAGR of 20.05% from 2019-2033 |
| Segmentation |
|
Table of Contents
- 1. Introduction
- 1.1. Research Scope
- 1.2. Market Segmentation
- 1.3. Research Methodology
- 1.4. Definitions and Assumptions
- 2. Executive Summary
- 2.1. Introduction
- 3. Market Dynamics
- 3.1. Introduction
- 3.2. Market Drivers
- 3.2.1. Increasing Popularity of Video Games; Growing Awareness about eSports
- 3.3. Market Restrains
- 3.3.1 Issues Such as Piracy
- 3.3.2 Laws and Regulations
- 3.3.3 and Concerns Relating to Fraud During Gaming Transactions
- 3.4. Market Trends
- 3.4.1. Advertising to be the Largest Sources of eSports Revenue
- 4. Market Factor Analysis
- 4.1. Porters Five Forces
- 4.2. Supply/Value Chain
- 4.3. PESTEL analysis
- 4.4. Market Entropy
- 4.5. Patent/Trademark Analysis
- 5. Global esports Market Analysis, Insights and Forecast, 2019-2031
- 5.1. Market Analysis, Insights and Forecast - by Revenue Model
- 5.1.1. Media Rights
- 5.1.2. Advertising and Sponsorships
- 5.1.3. Merchandise and Tickets
- 5.1.4. Other Revenue Models
- 5.2. Market Analysis, Insights and Forecast - by Streaming Platform
- 5.2.1. Twitch
- 5.2.2. YouTube
- 5.2.3. Other Streaming Platforms ( DouYu and Hayu )
- 5.3. Market Analysis, Insights and Forecast - by Region
- 5.3.1. North America
- 5.3.2. Europe
- 5.3.3. China
- 5.3.4. Asia Pacific
- 5.3.5. Japan
- 5.3.6. Latin America
- 5.3.7. Middle East
- 5.1. Market Analysis, Insights and Forecast - by Revenue Model
- 6. North America esports Market Analysis, Insights and Forecast, 2019-2031
- 6.1. Market Analysis, Insights and Forecast - by Revenue Model
- 6.1.1. Media Rights
- 6.1.2. Advertising and Sponsorships
- 6.1.3. Merchandise and Tickets
- 6.1.4. Other Revenue Models
- 6.2. Market Analysis, Insights and Forecast - by Streaming Platform
- 6.2.1. Twitch
- 6.2.2. YouTube
- 6.2.3. Other Streaming Platforms ( DouYu and Hayu )
- 6.1. Market Analysis, Insights and Forecast - by Revenue Model
- 7. Europe esports Market Analysis, Insights and Forecast, 2019-2031
- 7.1. Market Analysis, Insights and Forecast - by Revenue Model
- 7.1.1. Media Rights
- 7.1.2. Advertising and Sponsorships
- 7.1.3. Merchandise and Tickets
- 7.1.4. Other Revenue Models
- 7.2. Market Analysis, Insights and Forecast - by Streaming Platform
- 7.2.1. Twitch
- 7.2.2. YouTube
- 7.2.3. Other Streaming Platforms ( DouYu and Hayu )
- 7.1. Market Analysis, Insights and Forecast - by Revenue Model
- 8. China esports Market Analysis, Insights and Forecast, 2019-2031
- 8.1. Market Analysis, Insights and Forecast - by Revenue Model
- 8.1.1. Media Rights
- 8.1.2. Advertising and Sponsorships
- 8.1.3. Merchandise and Tickets
- 8.1.4. Other Revenue Models
- 8.2. Market Analysis, Insights and Forecast - by Streaming Platform
- 8.2.1. Twitch
- 8.2.2. YouTube
- 8.2.3. Other Streaming Platforms ( DouYu and Hayu )
- 8.1. Market Analysis, Insights and Forecast - by Revenue Model
- 9. Asia Pacific esports Market Analysis, Insights and Forecast, 2019-2031
- 9.1. Market Analysis, Insights and Forecast - by Revenue Model
- 9.1.1. Media Rights
- 9.1.2. Advertising and Sponsorships
- 9.1.3. Merchandise and Tickets
- 9.1.4. Other Revenue Models
- 9.2. Market Analysis, Insights and Forecast - by Streaming Platform
- 9.2.1. Twitch
- 9.2.2. YouTube
- 9.2.3. Other Streaming Platforms ( DouYu and Hayu )
- 9.1. Market Analysis, Insights and Forecast - by Revenue Model
- 10. Japan esports Market Analysis, Insights and Forecast, 2019-2031
- 10.1. Market Analysis, Insights and Forecast - by Revenue Model
- 10.1.1. Media Rights
- 10.1.2. Advertising and Sponsorships
- 10.1.3. Merchandise and Tickets
- 10.1.4. Other Revenue Models
- 10.2. Market Analysis, Insights and Forecast - by Streaming Platform
- 10.2.1. Twitch
- 10.2.2. YouTube
- 10.2.3. Other Streaming Platforms ( DouYu and Hayu )
- 10.1. Market Analysis, Insights and Forecast - by Revenue Model
- 11. Latin America esports Market Analysis, Insights and Forecast, 2019-2031
- 11.1. Market Analysis, Insights and Forecast - by Revenue Model
- 11.1.1. Media Rights
- 11.1.2. Advertising and Sponsorships
- 11.1.3. Merchandise and Tickets
- 11.1.4. Other Revenue Models
- 11.2. Market Analysis, Insights and Forecast - by Streaming Platform
- 11.2.1. Twitch
- 11.2.2. YouTube
- 11.2.3. Other Streaming Platforms ( DouYu and Hayu )
- 11.1. Market Analysis, Insights and Forecast - by Revenue Model
- 12. Middle East esports Market Analysis, Insights and Forecast, 2019-2031
- 12.1. Market Analysis, Insights and Forecast - by Revenue Model
- 12.1.1. Media Rights
- 12.1.2. Advertising and Sponsorships
- 12.1.3. Merchandise and Tickets
- 12.1.4. Other Revenue Models
- 12.2. Market Analysis, Insights and Forecast - by Streaming Platform
- 12.2.1. Twitch
- 12.2.2. YouTube
- 12.2.3. Other Streaming Platforms ( DouYu and Hayu )
- 12.1. Market Analysis, Insights and Forecast - by Revenue Model
- 13. North America esports Market Analysis, Insights and Forecast, 2019-2031
- 13.1. Market Analysis, Insights and Forecast - By Country/Sub-region
- 13.1.1 United States
- 13.1.2 Canada
- 13.1.3 Rest of North America
- 14. Europe esports Market Analysis, Insights and Forecast, 2019-2031
- 14.1. Market Analysis, Insights and Forecast - By Country/Sub-region
- 14.1.1 Germany
- 14.1.2 United Kingdom
- 14.1.3 France
- 14.1.4 Rest of Europe
- 15. China esports Market Analysis, Insights and Forecast, 2019-2031
- 15.1. Market Analysis, Insights and Forecast - By Country/Sub-region
- 15.1.1.
- 16. Asia Pacific esports Market Analysis, Insights and Forecast, 2019-2031
- 16.1. Market Analysis, Insights and Forecast - By Country/Sub-region
- 16.1.1.
- 17. Japan esports Market Analysis, Insights and Forecast, 2019-2031
- 17.1. Market Analysis, Insights and Forecast - By Country/Sub-region
- 17.1.1 India
- 17.1.2 South Korea
- 17.1.3 Rest of Asia Pacific
- 18. Latin America esports Market Analysis, Insights and Forecast, 2019-2031
- 18.1. Market Analysis, Insights and Forecast - By Country/Sub-region
- 18.1.1.
- 19. Middle East esports Market Analysis, Insights and Forecast, 2019-2031
- 19.1. Market Analysis, Insights and Forecast - By Country/Sub-region
- 19.1.1.
- 20. Competitive Analysis
- 20.1. Global Market Share Analysis 2024
- 20.2. Company Profiles
- 20.2.1 Modern Times Group
- 20.2.1.1. Overview
- 20.2.1.2. Products
- 20.2.1.3. SWOT Analysis
- 20.2.1.4. Recent Developments
- 20.2.1.5. Financials (Based on Availability)
- 20.2.2 Electronic Arts Inc
- 20.2.2.1. Overview
- 20.2.2.2. Products
- 20.2.2.3. SWOT Analysis
- 20.2.2.4. Recent Developments
- 20.2.2.5. Financials (Based on Availability)
- 20.2.3 Activision Blizzard Inc
- 20.2.3.1. Overview
- 20.2.3.2. Products
- 20.2.3.3. SWOT Analysis
- 20.2.3.4. Recent Developments
- 20.2.3.5. Financials (Based on Availability)
- 20.2.4 Gfinity PLC
- 20.2.4.1. Overview
- 20.2.4.2. Products
- 20.2.4.3. SWOT Analysis
- 20.2.4.4. Recent Developments
- 20.2.4.5. Financials (Based on Availability)
- 20.2.5 Valve Corporation*List Not Exhaustive
- 20.2.5.1. Overview
- 20.2.5.2. Products
- 20.2.5.3. SWOT Analysis
- 20.2.5.4. Recent Developments
- 20.2.5.5. Financials (Based on Availability)
- 20.2.6 Riot Games Inc ( Tencent Holdings Ltd)
- 20.2.6.1. Overview
- 20.2.6.2. Products
- 20.2.6.3. SWOT Analysis
- 20.2.6.4. Recent Developments
- 20.2.6.5. Financials (Based on Availability)
- 20.2.7 Faceit
- 20.2.7.1. Overview
- 20.2.7.2. Products
- 20.2.7.3. SWOT Analysis
- 20.2.7.4. Recent Developments
- 20.2.7.5. Financials (Based on Availability)
- 20.2.8 Epic Games Inc
- 20.2.8.1. Overview
- 20.2.8.2. Products
- 20.2.8.3. SWOT Analysis
- 20.2.8.4. Recent Developments
- 20.2.8.5. Financials (Based on Availability)
- 20.2.9 Capcom Co Ltd
- 20.2.9.1. Overview
- 20.2.9.2. Products
- 20.2.9.3. SWOT Analysis
- 20.2.9.4. Recent Developments
- 20.2.9.5. Financials (Based on Availability)
- 20.2.1 Modern Times Group
List of Figures
- Figure 1: Global esports Market Revenue Breakdown (Million, %) by Region 2024 & 2032
- Figure 2: North America esports Market Revenue (Million), by Country 2024 & 2032
- Figure 3: North America esports Market Revenue Share (%), by Country 2024 & 2032
- Figure 4: Europe esports Market Revenue (Million), by Country 2024 & 2032
- Figure 5: Europe esports Market Revenue Share (%), by Country 2024 & 2032
- Figure 6: China esports Market Revenue (Million), by Country 2024 & 2032
- Figure 7: China esports Market Revenue Share (%), by Country 2024 & 2032
- Figure 8: Asia Pacific esports Market Revenue (Million), by Country 2024 & 2032
- Figure 9: Asia Pacific esports Market Revenue Share (%), by Country 2024 & 2032
- Figure 10: Japan esports Market Revenue (Million), by Country 2024 & 2032
- Figure 11: Japan esports Market Revenue Share (%), by Country 2024 & 2032
- Figure 12: Latin America esports Market Revenue (Million), by Country 2024 & 2032
- Figure 13: Latin America esports Market Revenue Share (%), by Country 2024 & 2032
- Figure 14: Middle East esports Market Revenue (Million), by Country 2024 & 2032
- Figure 15: Middle East esports Market Revenue Share (%), by Country 2024 & 2032
- Figure 16: North America esports Market Revenue (Million), by Revenue Model 2024 & 2032
- Figure 17: North America esports Market Revenue Share (%), by Revenue Model 2024 & 2032
- Figure 18: North America esports Market Revenue (Million), by Streaming Platform 2024 & 2032
- Figure 19: North America esports Market Revenue Share (%), by Streaming Platform 2024 & 2032
- Figure 20: North America esports Market Revenue (Million), by Country 2024 & 2032
- Figure 21: North America esports Market Revenue Share (%), by Country 2024 & 2032
- Figure 22: Europe esports Market Revenue (Million), by Revenue Model 2024 & 2032
- Figure 23: Europe esports Market Revenue Share (%), by Revenue Model 2024 & 2032
- Figure 24: Europe esports Market Revenue (Million), by Streaming Platform 2024 & 2032
- Figure 25: Europe esports Market Revenue Share (%), by Streaming Platform 2024 & 2032
- Figure 26: Europe esports Market Revenue (Million), by Country 2024 & 2032
- Figure 27: Europe esports Market Revenue Share (%), by Country 2024 & 2032
- Figure 28: China esports Market Revenue (Million), by Revenue Model 2024 & 2032
- Figure 29: China esports Market Revenue Share (%), by Revenue Model 2024 & 2032
- Figure 30: China esports Market Revenue (Million), by Streaming Platform 2024 & 2032
- Figure 31: China esports Market Revenue Share (%), by Streaming Platform 2024 & 2032
- Figure 32: China esports Market Revenue (Million), by Country 2024 & 2032
- Figure 33: China esports Market Revenue Share (%), by Country 2024 & 2032
- Figure 34: Asia Pacific esports Market Revenue (Million), by Revenue Model 2024 & 2032
- Figure 35: Asia Pacific esports Market Revenue Share (%), by Revenue Model 2024 & 2032
- Figure 36: Asia Pacific esports Market Revenue (Million), by Streaming Platform 2024 & 2032
- Figure 37: Asia Pacific esports Market Revenue Share (%), by Streaming Platform 2024 & 2032
- Figure 38: Asia Pacific esports Market Revenue (Million), by Country 2024 & 2032
- Figure 39: Asia Pacific esports Market Revenue Share (%), by Country 2024 & 2032
- Figure 40: Japan esports Market Revenue (Million), by Revenue Model 2024 & 2032
- Figure 41: Japan esports Market Revenue Share (%), by Revenue Model 2024 & 2032
- Figure 42: Japan esports Market Revenue (Million), by Streaming Platform 2024 & 2032
- Figure 43: Japan esports Market Revenue Share (%), by Streaming Platform 2024 & 2032
- Figure 44: Japan esports Market Revenue (Million), by Country 2024 & 2032
- Figure 45: Japan esports Market Revenue Share (%), by Country 2024 & 2032
- Figure 46: Latin America esports Market Revenue (Million), by Revenue Model 2024 & 2032
- Figure 47: Latin America esports Market Revenue Share (%), by Revenue Model 2024 & 2032
- Figure 48: Latin America esports Market Revenue (Million), by Streaming Platform 2024 & 2032
- Figure 49: Latin America esports Market Revenue Share (%), by Streaming Platform 2024 & 2032
- Figure 50: Latin America esports Market Revenue (Million), by Country 2024 & 2032
- Figure 51: Latin America esports Market Revenue Share (%), by Country 2024 & 2032
- Figure 52: Middle East esports Market Revenue (Million), by Revenue Model 2024 & 2032
- Figure 53: Middle East esports Market Revenue Share (%), by Revenue Model 2024 & 2032
- Figure 54: Middle East esports Market Revenue (Million), by Streaming Platform 2024 & 2032
- Figure 55: Middle East esports Market Revenue Share (%), by Streaming Platform 2024 & 2032
- Figure 56: Middle East esports Market Revenue (Million), by Country 2024 & 2032
- Figure 57: Middle East esports Market Revenue Share (%), by Country 2024 & 2032
List of Tables
- Table 1: Global esports Market Revenue Million Forecast, by Region 2019 & 2032
- Table 2: Global esports Market Revenue Million Forecast, by Revenue Model 2019 & 2032
- Table 3: Global esports Market Revenue Million Forecast, by Streaming Platform 2019 & 2032
- Table 4: Global esports Market Revenue Million Forecast, by Region 2019 & 2032
- Table 5: Global esports Market Revenue Million Forecast, by Country 2019 & 2032
- Table 6: United States esports Market Revenue (Million) Forecast, by Application 2019 & 2032
- Table 7: Canada esports Market Revenue (Million) Forecast, by Application 2019 & 2032
- Table 8: Rest of North America esports Market Revenue (Million) Forecast, by Application 2019 & 2032
- Table 9: Global esports Market Revenue Million Forecast, by Country 2019 & 2032
- Table 10: Germany esports Market Revenue (Million) Forecast, by Application 2019 & 2032
- Table 11: United Kingdom esports Market Revenue (Million) Forecast, by Application 2019 & 2032
- Table 12: France esports Market Revenue (Million) Forecast, by Application 2019 & 2032
- Table 13: Rest of Europe esports Market Revenue (Million) Forecast, by Application 2019 & 2032
- Table 14: Global esports Market Revenue Million Forecast, by Country 2019 & 2032
- Table 15: esports Market Revenue (Million) Forecast, by Application 2019 & 2032
- Table 16: Global esports Market Revenue Million Forecast, by Country 2019 & 2032
- Table 17: esports Market Revenue (Million) Forecast, by Application 2019 & 2032
- Table 18: Global esports Market Revenue Million Forecast, by Country 2019 & 2032
- Table 19: India esports Market Revenue (Million) Forecast, by Application 2019 & 2032
- Table 20: South Korea esports Market Revenue (Million) Forecast, by Application 2019 & 2032
- Table 21: Rest of Asia Pacific esports Market Revenue (Million) Forecast, by Application 2019 & 2032
- Table 22: Global esports Market Revenue Million Forecast, by Country 2019 & 2032
- Table 23: esports Market Revenue (Million) Forecast, by Application 2019 & 2032
- Table 24: Global esports Market Revenue Million Forecast, by Country 2019 & 2032
- Table 25: esports Market Revenue (Million) Forecast, by Application 2019 & 2032
- Table 26: Global esports Market Revenue Million Forecast, by Revenue Model 2019 & 2032
- Table 27: Global esports Market Revenue Million Forecast, by Streaming Platform 2019 & 2032
- Table 28: Global esports Market Revenue Million Forecast, by Country 2019 & 2032
- Table 29: United States esports Market Revenue (Million) Forecast, by Application 2019 & 2032
- Table 30: Canada esports Market Revenue (Million) Forecast, by Application 2019 & 2032
- Table 31: Rest of North America esports Market Revenue (Million) Forecast, by Application 2019 & 2032
- Table 32: Global esports Market Revenue Million Forecast, by Revenue Model 2019 & 2032
- Table 33: Global esports Market Revenue Million Forecast, by Streaming Platform 2019 & 2032
- Table 34: Global esports Market Revenue Million Forecast, by Country 2019 & 2032
- Table 35: Germany esports Market Revenue (Million) Forecast, by Application 2019 & 2032
- Table 36: United Kingdom esports Market Revenue (Million) Forecast, by Application 2019 & 2032
- Table 37: France esports Market Revenue (Million) Forecast, by Application 2019 & 2032
- Table 38: Rest of Europe esports Market Revenue (Million) Forecast, by Application 2019 & 2032
- Table 39: Global esports Market Revenue Million Forecast, by Revenue Model 2019 & 2032
- Table 40: Global esports Market Revenue Million Forecast, by Streaming Platform 2019 & 2032
- Table 41: Global esports Market Revenue Million Forecast, by Country 2019 & 2032
- Table 42: Global esports Market Revenue Million Forecast, by Revenue Model 2019 & 2032
- Table 43: Global esports Market Revenue Million Forecast, by Streaming Platform 2019 & 2032
- Table 44: Global esports Market Revenue Million Forecast, by Country 2019 & 2032
- Table 45: Global esports Market Revenue Million Forecast, by Revenue Model 2019 & 2032
- Table 46: Global esports Market Revenue Million Forecast, by Streaming Platform 2019 & 2032
- Table 47: Global esports Market Revenue Million Forecast, by Country 2019 & 2032
- Table 48: India esports Market Revenue (Million) Forecast, by Application 2019 & 2032
- Table 49: South Korea esports Market Revenue (Million) Forecast, by Application 2019 & 2032
- Table 50: Rest of Asia Pacific esports Market Revenue (Million) Forecast, by Application 2019 & 2032
- Table 51: Global esports Market Revenue Million Forecast, by Revenue Model 2019 & 2032
- Table 52: Global esports Market Revenue Million Forecast, by Streaming Platform 2019 & 2032
- Table 53: Global esports Market Revenue Million Forecast, by Country 2019 & 2032
- Table 54: Global esports Market Revenue Million Forecast, by Revenue Model 2019 & 2032
- Table 55: Global esports Market Revenue Million Forecast, by Streaming Platform 2019 & 2032
- Table 56: Global esports Market Revenue Million Forecast, by Country 2019 & 2032
Frequently Asked Questions
1. What is the projected Compound Annual Growth Rate (CAGR) of the esports Market?
The projected CAGR is approximately 20.05%.
2. Which companies are prominent players in the esports Market?
Key companies in the market include Modern Times Group, Electronic Arts Inc, Activision Blizzard Inc, Gfinity PLC, Valve Corporation*List Not Exhaustive, Riot Games Inc ( Tencent Holdings Ltd), Faceit, Epic Games Inc, Capcom Co Ltd.
3. What are the main segments of the esports Market?
The market segments include Revenue Model, Streaming Platform.
4. Can you provide details about the market size?
The market size is estimated to be USD 2.11 Million as of 2022.
5. What are some drivers contributing to market growth?
Increasing Popularity of Video Games; Growing Awareness about eSports.
6. What are the notable trends driving market growth?
Advertising to be the Largest Sources of eSports Revenue.
7. Are there any restraints impacting market growth?
Issues Such as Piracy. Laws and Regulations. and Concerns Relating to Fraud During Gaming Transactions.
8. Can you provide examples of recent developments in the market?
January 2022 - A new category of 1440p NVIDIA G-SYNC esports screens and seven new games benefit from low latency thanks to NVIDIA Reflex. Since reducing system latency is recognized by gamers and game developers as essential to a quality gaming experience, the NVIDIA Reflex low latency ecosystem has grown significantly over the past year. Eight top-ten competitive shooters, including Apex Legends, Valorant, and Fortnite, support Reflex. Each month, more than 20 million GeForce gamers battle with Reflex ON. More than 50 mouse and screens support their Reflex Analyzer, enabling players to assess system latency quickly. Such developments are expected to flourish the esports market in the forecast period.
9. What pricing options are available for accessing the report?
Pricing options include single-user, multi-user, and enterprise licenses priced at USD 4750, USD 5250, and USD 8750 respectively.
10. Is the market size provided in terms of value or volume?
The market size is provided in terms of value, measured in Million.
11. Are there any specific market keywords associated with the report?
Yes, the market keyword associated with the report is "esports Market," which aids in identifying and referencing the specific market segment covered.
12. How do I determine which pricing option suits my needs best?
The pricing options vary based on user requirements and access needs. Individual users may opt for single-user licenses, while businesses requiring broader access may choose multi-user or enterprise licenses for cost-effective access to the report.
13. Are there any additional resources or data provided in the esports Market report?
While the report offers comprehensive insights, it's advisable to review the specific contents or supplementary materials provided to ascertain if additional resources or data are available.
14. How can I stay updated on further developments or reports in the esports Market?
To stay informed about further developments, trends, and reports in the esports Market, consider subscribing to industry newsletters, following relevant companies and organizations, or regularly checking reputable industry news sources and publications.
Methodology
Step 1 - Identification of Relevant Samples Size from Population Database


Step 2 - Approaches for Defining Global Market Size (Value, Volume* & Price*)

Note*: In applicable scenarios
Step 3 - Data Sources
Primary Research
- Web Analytics
- Survey Reports
- Research Institute
- Latest Research Reports
- Opinion Leaders
Secondary Research
- Annual Reports
- White Paper
- Latest Press Release
- Industry Association
- Paid Database
- Investor Presentations

Step 4 - Data Triangulation
Involves using different sources of information in order to increase the validity of a study
These sources are likely to be stakeholders in a program - participants, other researchers, program staff, other community members, and so on.
Then we put all data in single framework & apply various statistical tools to find out the dynamic on the market.
During the analysis stage, feedback from the stakeholder groups would be compared to determine areas of agreement as well as areas of divergence


