

Key Insights
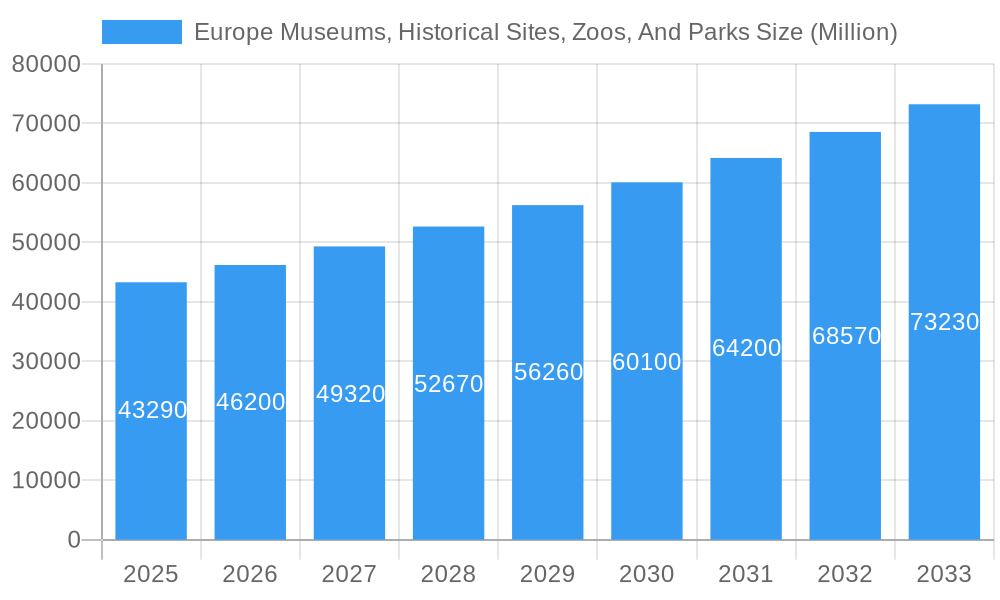
The European museums, historical sites, zoos, and parks market exhibits robust growth, projected at a Compound Annual Growth Rate (CAGR) of 6.66% from 2025 to 2033. In 2025, the market size is estimated at €43.29 billion. This expansion is fueled by several key drivers. Increased disposable incomes across Europe, coupled with a growing interest in cultural experiences and ecotourism, are significantly boosting visitor numbers. Furthermore, innovative marketing strategies, including immersive technologies and enhanced online booking systems, are improving accessibility and attracting a wider audience. The rising popularity of sustainable tourism practices also contributes to the sector's growth, with a focus on responsible travel and environmental conservation becoming increasingly important to visitors. Segment-wise, the "Tickets" revenue source dominates, followed by "Food and Beverages," indicating significant potential for ancillary revenue generation. While factors such as economic downturns and seasonality pose potential restraints, the overall market outlook remains positive, with consistent growth projected across all major segments and countries within Europe. Germany, France, the United Kingdom, and Italy constitute the largest national markets, benefiting from strong tourism infrastructure and a rich historical and cultural heritage.
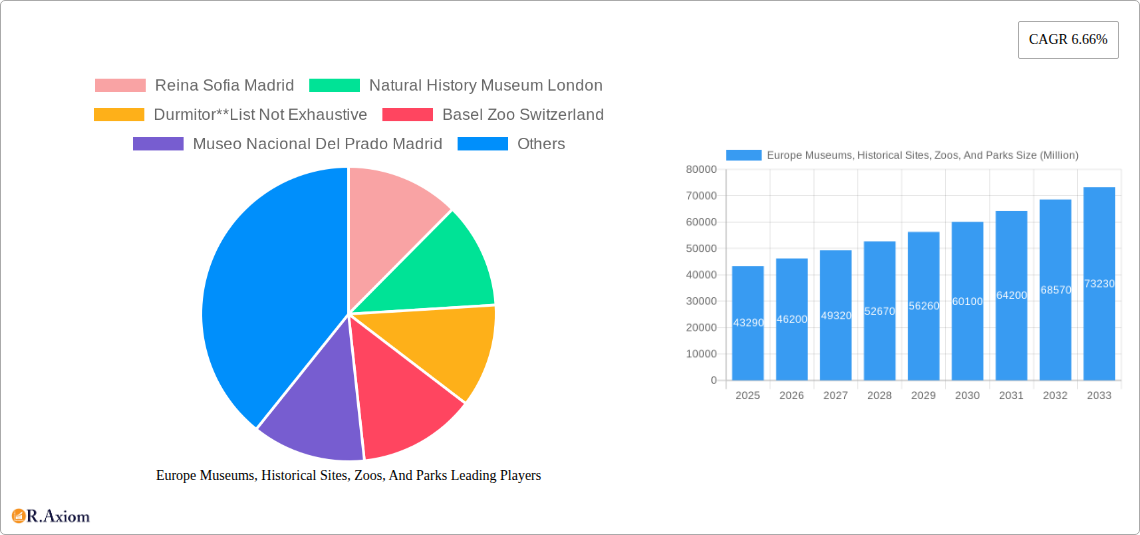
Europe Museums, Historical Sites, Zoos, And Parks Market Size (In Billion)
The market's segmentation reveals further insights. The "Museums and Historical Sites" segment likely holds the largest market share, driven by the enduring appeal of historical landmarks and cultural institutions. However, the "Zoos and Botanical Gardens" and "Nature Parks" segments are also experiencing strong growth, reflecting a shift towards nature-based tourism and the increasing recognition of the importance of biodiversity conservation. The "Other Similar Institutions" segment, encompassing smaller, specialized institutions, presents an opportunity for niche growth. Competition within the market is intense, with prominent players such as the Louvre, the British Museum, and various national zoos across Europe vying for market share. Successful operators are continuously investing in infrastructure improvements, engaging visitor experiences, and effective marketing to maintain competitiveness. The continued growth of the European tourism sector, combined with innovative strategies employed by the industry, suggests a bright future for this dynamic market.
Europe Museums, Historical Sites, Zoos, And Parks Company Market Share
Europe Museums, Historical Sites, Zoos, and Parks Market Report: 2019-2033
This comprehensive report provides a detailed analysis of the European Museums, Historical Sites, Zoos, and Parks market, offering invaluable insights for industry stakeholders. The study period covers 2019-2033, with a base year of 2025 and a forecast period of 2025-2033. The report leverages extensive data from the historical period (2019-2024) to project future market trends and growth opportunities. The market is segmented by type, revenue source, and country, with a focus on key players and emerging trends. The report incorporates data on total market value in Millions (M) where available.
Europe Museums, Historical Sites, Zoos, And Parks Market Concentration & Innovation
The European Museums, Historical Sites, Zoos, and Parks market exhibits a moderately concentrated structure, with a few dominant players commanding significant market share. The Louvre Museum in Paris and the British Museum in London, for example, consistently attract millions of visitors annually, contributing substantially to overall revenue. However, a large number of smaller, specialized institutions also contribute significantly to the market's diversity and overall value, estimated at xx Million in 2025.
Innovation in this sector is driven by several factors, including technological advancements (virtual reality tours, interactive exhibits), evolving visitor expectations (personalized experiences, accessibility), and the need for enhanced operational efficiency. Regulatory frameworks, such as heritage preservation laws and safety regulations, heavily influence operations. Substitute products, such as online entertainment and virtual experiences, pose a competitive challenge, requiring continuous innovation to maintain market share. End-user trends indicate a growing preference for experiential tourism, fostering the growth of unique and immersive attractions.
Mergers and acquisitions (M&A) activities within the sector are moderate but significant. Recent deals, while not publicly disclosed with precise values in all instances, often focus on expanding geographic reach or enhancing operational capabilities. For example, the potential value of acquisitions in the sector in 2024 was estimated to be xx Million. Market share data for individual players is available upon request.
Europe Museums, Historical Sites, Zoos, And Parks Industry Trends & Insights
The European Museums, Historical Sites, Zoos, and Parks market is experiencing robust growth, driven by several factors. Increased disposable incomes, a rise in leisure travel, and the growing popularity of experiential tourism are all contributing to the sector's expansion. The compound annual growth rate (CAGR) during the forecast period (2025-2033) is projected at xx%, reaching a total market size of xx Million by 2033. Market penetration of digital technologies is rapidly increasing, with institutions adopting online ticketing, virtual tours, and interactive exhibits to enhance the visitor experience and improve operational efficiency.
Consumer preferences are evolving, with a growing demand for sustainable and ethical tourism practices. This is influencing operational strategies, with many institutions focusing on environmental sustainability initiatives and community engagement programs. Competitive dynamics are characterized by both collaboration and competition, with institutions seeking strategic partnerships to enhance their offerings and attract a wider audience. The emergence of new types of attractions, like interactive science centers and immersive art installations is further reshaping market dynamics.
Dominant Markets & Segments in Europe Museums, Historical Sites, Zoos, And Parks
-
By Type: Museums continue to be the highest revenue-generating segment, followed closely by historical sites. Zoos and botanical gardens, along with nature parks, also contribute significantly to the overall market. The strong performance of museums is largely due to their universal appeal, the presence of world-renowned institutions in major European cities, and their ability to attract diverse visitor demographics.
-
By Revenue Source: While ticket sales remain the cornerstone of revenue generation, ancillary services like food and beverage, retail merchandising, educational programs, and venue rentals are increasingly vital. The industry is actively exploring and implementing innovative revenue diversification strategies to enhance financial sustainability and reduce dependence on admissions.
-
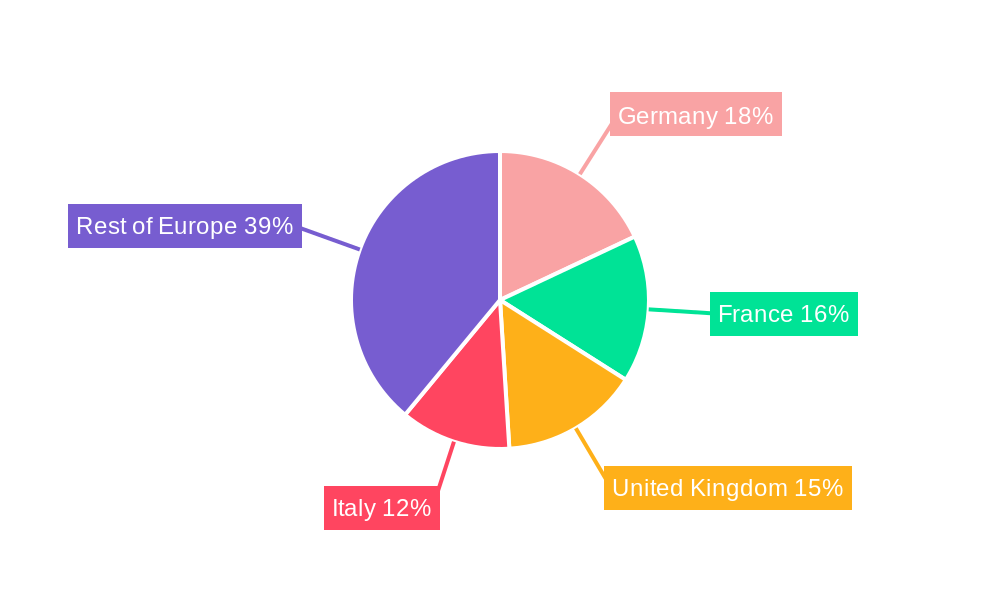
By Country: The United Kingdom, France, and Germany are the undisputed leaders in the European market for museums, historical sites, zoos, and parks. This dominance is fueled by robust tourism economies, sophisticated infrastructure, and the sheer volume of prominent attractions. Italy and the broader European region also represent substantial and growing markets. Key drivers for each region include:
- UK: Exceptional tourism infrastructure, a wealth of historically significant sites, and a strong domestic visitor base.
- France: Consistently high international tourist numbers, iconic landmarks that are globally recognized, and a deeply ingrained cultural heritage.
- Germany: A powerful domestic market, highly developed infrastructure, and a diverse array of attractions catering to varied interests.
- Italy: An unparalleled abundance of historical sites and artistic treasures, making it a magnet for global tourism.
- Rest of Europe: A burgeoning tourism sector in many countries, coupled with rising disposable incomes, is driving increased visitor numbers and spending.
Europe Museums, Historical Sites, Zoos, And Parks Product Developments
The sector is witnessing significant product innovation, with a focus on enhancing visitor experience through technological advancements. Virtual and augmented reality technologies are being integrated into exhibits to provide immersive experiences. Interactive exhibits, personalized tours, and educational programs cater to diverse visitor interests. These innovations improve visitor engagement, expand accessibility, and provide competitive advantages, attracting larger audiences and increasing revenue generation.
Report Scope & Segmentation Analysis
This report segments the European Museums, Historical Sites, Zoos, and Parks market by:
Type: Museums (including art, history, science museums), Historical Sites (castles, ruins, ancient cities), Zoos and Botanical Gardens, Nature Parks, and Other Similar Institutions (e.g., aquariums, planetariums). Each segment presents unique growth opportunities and challenges, with varying market sizes and competitive dynamics. Growth projections vary significantly by type.
Revenue Source: Ticket sales, food and beverage revenue, and other revenue streams (gift shops, memberships, educational programs). The revenue mix varies based on institutional type and location.
Country: France, Germany, United Kingdom, Italy, and Rest of Europe. Each country exhibits varying market sizes and growth prospects due to differing economic conditions and tourism trends.
Key Drivers of Europe Museums, Historical Sites, Zoos, And Parks Growth
The growth of this market is fueled by several key factors: increasing tourism, rising disposable incomes, technological advancements leading to engaging experiences, supportive government policies promoting cultural heritage, and the growing popularity of experiential travel. Investments in infrastructure and marketing efforts further propel sector expansion.
Challenges in the Europe Museums, Historical Sites, Zoos, And Parks Sector
The sector faces challenges including seasonality, economic downturns impacting visitor numbers, intense competition from other leisure activities, and the need for continuous investment in infrastructure maintenance and innovation. Regulatory compliance and maintaining safety standards add to operational costs. Further challenges include the impact of climate change and managing increasing visitor numbers sustainably.
Emerging Opportunities in Europe Museums, Historical Sites, Zoos, And Parks
The landscape for European museums, historical sites, zoos, and parks is ripe with emerging opportunities. A significant focus is on developing and promoting sustainable tourism practices to ensure long-term viability and environmental responsibility. Leveraging cutting-edge technology to create personalized and immersive visitor experiences is another key area. Expanding collaborations with local communities fosters deeper engagement and unique offerings. The creation of niche and themed attractions designed to capture evolving visitor interests is also a promising avenue. Furthermore, exploring novel revenue models, such as hosting corporate events, expanding educational outreach, and developing specialized visitor packages, presents substantial growth potential. A continued emphasis on enhancing accessibility and inclusivity will broaden market reach and appeal to a wider audience.
Leading Players in the Europe Museums, Historical Sites, Zoos, And Parks Market
- Louvre Paris
- British Museum London
- Vatican Museums Vatican
- State Hermitage St Petersburg
- Museo Nacional Del Prado Madrid
- Reina Sofia Madrid
- Centre Pompidou Paris
- State Tretyakov Gallery Moscow
- Natural History Museum London
- Schonbrunner Zoo Vienna
- Zoologischer Garten Berlin AG
- Chester Zoo England
- Pairi Daiza Zoo Southern Belgium
- Basel Zoo Switzerland
- Plitvice Lakes National Park
- Durmitor (List Not Exhaustive)
Key Developments in Europe Museums, Historical Sites, Zoos, And Parks Industry
-
September 2022: The innovative Museum of Homelessness (MoH) in London announced its ambitious plans for a new opening, highlighting its commitment to community engagement and social impact, setting a precedent for socially conscious cultural institutions.
-
March 2023: The unveiling of the Young V&A in London marks a significant investment in engaging younger audiences and fostering cultural education. This development is anticipated to have a considerable influence on family-oriented tourism and the creation of child-centric visitor experiences.
Strategic Outlook for Europe Museums, Historical Sites, Zoos, And Parks Market
The future trajectory for the European Museums, Historical Sites, Zoos, and Parks market appears exceptionally promising, with substantial growth potential on the horizon. This optimism is underpinned by ongoing technological advancements, a strategic pivot towards experiential tourism that prioritizes engagement over passive observation, and increased investment in both physical infrastructure and targeted marketing campaigns. The sector's long-term prosperity is intrinsically linked to its ability to champion and implement sustainable practices, ensuring the preservation of its valuable assets for future generations. Cultivating truly captivating and memorable experiences for visitors of all ages and backgrounds will be paramount to success. Continued expansion is expected to be propelled by strategic investments in marketing initiatives and the further enhancement of digital capabilities, creating seamless and enriching visitor journeys.
Europe Museums, Historical Sites, Zoos, And Parks Segmentation
-
1. Type
- 1.1. Museums
- 1.2. Historical Sites
- 1.3. Zoos And Botanical Gardens
- 1.4. Nature Parks
- 1.5. Other Similar Institutions
-
2. Revenue Source
- 2.1. Tickets
- 2.2. Food And Beverages
- 2.3. Other Revenue Souces
Europe Museums, Historical Sites, Zoos, And Parks Segmentation By Geography
-
1. Europe
- 1.1. United Kingdom
- 1.2. Germany
- 1.3. France
- 1.4. Italy
- 1.5. Spain
- 1.6. Netherlands
- 1.7. Belgium
- 1.8. Sweden
- 1.9. Norway
- 1.10. Poland
- 1.11. Denmark
Europe Museums, Historical Sites, Zoos, And Parks Regional Market Share
Geographic Coverage of Europe Museums, Historical Sites, Zoos, And Parks
Europe Museums, Historical Sites, Zoos, And Parks REPORT HIGHLIGHTS
| Aspects | Details |
|---|---|
| Study Period | 2020-2034 |
| Base Year | 2025 |
| Estimated Year | 2026 |
| Forecast Period | 2026-2034 |
| Historical Period | 2020-2025 |
| Growth Rate | CAGR of 6.66% from 2020-2034 |
| Segmentation |
|
Table of Contents
- 1. Introduction
- 1.1. Research Scope
- 1.2. Market Segmentation
- 1.3. Research Objective
- 1.4. Definitions and Assumptions
- 2. Executive Summary
- 2.1. Market Snapshot
- 3. Market Dynamics
- 3.1. Market Drivers
- 3.2. Market Restrains
- 3.3. Market Trends
- 3.4. Market Opportunities
- 4. Market Factor Analysis
- 4.1. Porters Five Forces
- 4.1.1. Bargaining Power of Suppliers
- 4.1.2. Bargaining Power of Buyers
- 4.1.3. Threat of New Entrants
- 4.1.4. Threat of Substitutes
- 4.1.5. Competitive Rivalry
- 4.2. PESTEL analysis
- 4.3. BCG Analysis
- 4.3.1. Stars (High Growth, High Market Share)
- 4.3.2. Cash Cows (Low Growth, High Market Share)
- 4.3.3. Question Mark (High Growth, Low Market Share)
- 4.3.4. Dogs (Low Growth, Low Market Share)
- 4.4. Ansoff Matrix Analysis
- 4.5. Supply Chain Analysis
- 4.6. Regulatory Landscape
- 4.7. Current Market Potential and Opportunity Assessment (TAM–SAM–SOM Framework)
- 4.8. RAX Analyst Note
- 4.1. Porters Five Forces
- 5. Market Analysis, Insights and Forecast 2021-2033
- 5.1. Market Analysis, Insights and Forecast - by Type
- 5.1.1. Museums
- 5.1.2. Historical Sites
- 5.1.3. Zoos And Botanical Gardens
- 5.1.4. Nature Parks
- 5.1.5. Other Similar Institutions
- 5.2. Market Analysis, Insights and Forecast - by Revenue Source
- 5.2.1. Tickets
- 5.2.2. Food And Beverages
- 5.2.3. Other Revenue Souces
- 5.3. Market Analysis, Insights and Forecast - by Region
- 5.3.1. Europe
- 5.1. Market Analysis, Insights and Forecast - by Type
- 6. Europe Museums, Historical Sites, Zoos, And Parks Analysis, Insights and Forecast, 2021-2033
- 6.1. Market Analysis, Insights and Forecast - by Type
- 6.1.1. Museums
- 6.1.2. Historical Sites
- 6.1.3. Zoos And Botanical Gardens
- 6.1.4. Nature Parks
- 6.1.5. Other Similar Institutions
- 6.2. Market Analysis, Insights and Forecast - by Revenue Source
- 6.2.1. Tickets
- 6.2.2. Food And Beverages
- 6.2.3. Other Revenue Souces
- 6.1. Market Analysis, Insights and Forecast - by Type
- 7. Competitive Analysis
- 7.1. Company Profiles
- 7.1.1 Reina Sofia Madrid
- 7.1.1.1. Company Overview
- 7.1.1.2. Products
- 7.1.1.3. Company Financials
- 7.1.1.4. SWOT Analysis
- 7.1.2 Natural History Museum London
- 7.1.2.1. Company Overview
- 7.1.2.2. Products
- 7.1.2.3. Company Financials
- 7.1.2.4. SWOT Analysis
- 7.1.3 Durmitor**List Not Exhaustive
- 7.1.3.1. Company Overview
- 7.1.3.2. Products
- 7.1.3.3. Company Financials
- 7.1.3.4. SWOT Analysis
- 7.1.4 Basel Zoo Switzerland
- 7.1.4.1. Company Overview
- 7.1.4.2. Products
- 7.1.4.3. Company Financials
- 7.1.4.4. SWOT Analysis
- 7.1.5 Museo Nacional Del Prado Madrid
- 7.1.5.1. Company Overview
- 7.1.5.2. Products
- 7.1.5.3. Company Financials
- 7.1.5.4. SWOT Analysis
- 7.1.6 State Tretyakov Gallery Moscow
- 7.1.6.1. Company Overview
- 7.1.6.2. Products
- 7.1.6.3. Company Financials
- 7.1.6.4. SWOT Analysis
- 7.1.7 Centre Pompidou Paris
- 7.1.7.1. Company Overview
- 7.1.7.2. Products
- 7.1.7.3. Company Financials
- 7.1.7.4. SWOT Analysis
- 7.1.8 Chester Zoo England
- 7.1.8.1. Company Overview
- 7.1.8.2. Products
- 7.1.8.3. Company Financials
- 7.1.8.4. SWOT Analysis
- 7.1.9 Plitvice Lakes National Park
- 7.1.9.1. Company Overview
- 7.1.9.2. Products
- 7.1.9.3. Company Financials
- 7.1.9.4. SWOT Analysis
- 7.1.10 State Hermitage St Petersburg
- 7.1.10.1. Company Overview
- 7.1.10.2. Products
- 7.1.10.3. Company Financials
- 7.1.10.4. SWOT Analysis
- 7.1.11 British Museum London
- 7.1.11.1. Company Overview
- 7.1.11.2. Products
- 7.1.11.3. Company Financials
- 7.1.11.4. SWOT Analysis
- 7.1.12 Pairi Daiza Zoo Southern Belgium
- 7.1.12.1. Company Overview
- 7.1.12.2. Products
- 7.1.12.3. Company Financials
- 7.1.12.4. SWOT Analysis
- 7.1.13 Zoologischer Garten Berlin AG
- 7.1.13.1. Company Overview
- 7.1.13.2. Products
- 7.1.13.3. Company Financials
- 7.1.13.4. SWOT Analysis
- 7.1.14 Schonbrunner Zoo Vienna
- 7.1.14.1. Company Overview
- 7.1.14.2. Products
- 7.1.14.3. Company Financials
- 7.1.14.4. SWOT Analysis
- 7.1.15 Vatican Museums Vatican
- 7.1.15.1. Company Overview
- 7.1.15.2. Products
- 7.1.15.3. Company Financials
- 7.1.15.4. SWOT Analysis
- 7.1.16 Louvre Paris
- 7.1.16.1. Company Overview
- 7.1.16.2. Products
- 7.1.16.3. Company Financials
- 7.1.16.4. SWOT Analysis
- 7.1.1 Reina Sofia Madrid
- 7.2. Market Entropy
- 7.2.1 Company's Key Areas Served
- 7.2.2 Recent Developments
- 7.3. Company Market Share Analysis 2025
- 7.3.1 Top 5 Companies Market Share Analysis
- 7.3.2 Top 3 Companies Market Share Analysis
- 7.4. List of Potential Customers
- 8. Research Methodology
List of Figures
- Figure 1: Europe Museums, Historical Sites, Zoos, And Parks Revenue Breakdown (Million, %) by Product 2025 & 2033
- Figure 2: Europe Museums, Historical Sites, Zoos, And Parks Share (%) by Company 2025
List of Tables
- Table 1: Europe Museums, Historical Sites, Zoos, And Parks Revenue Million Forecast, by Type 2020 & 2033
- Table 2: Europe Museums, Historical Sites, Zoos, And Parks Revenue Million Forecast, by Revenue Source 2020 & 2033
- Table 3: Europe Museums, Historical Sites, Zoos, And Parks Revenue Million Forecast, by Region 2020 & 2033
- Table 4: Europe Museums, Historical Sites, Zoos, And Parks Revenue Million Forecast, by Type 2020 & 2033
- Table 5: Europe Museums, Historical Sites, Zoos, And Parks Revenue Million Forecast, by Revenue Source 2020 & 2033
- Table 6: Europe Museums, Historical Sites, Zoos, And Parks Revenue Million Forecast, by Country 2020 & 2033
- Table 7: United Kingdom Europe Museums, Historical Sites, Zoos, And Parks Revenue (Million) Forecast, by Application 2020 & 2033
- Table 8: Germany Europe Museums, Historical Sites, Zoos, And Parks Revenue (Million) Forecast, by Application 2020 & 2033
- Table 9: France Europe Museums, Historical Sites, Zoos, And Parks Revenue (Million) Forecast, by Application 2020 & 2033
- Table 10: Italy Europe Museums, Historical Sites, Zoos, And Parks Revenue (Million) Forecast, by Application 2020 & 2033
- Table 11: Spain Europe Museums, Historical Sites, Zoos, And Parks Revenue (Million) Forecast, by Application 2020 & 2033
- Table 12: Netherlands Europe Museums, Historical Sites, Zoos, And Parks Revenue (Million) Forecast, by Application 2020 & 2033
- Table 13: Belgium Europe Museums, Historical Sites, Zoos, And Parks Revenue (Million) Forecast, by Application 2020 & 2033
- Table 14: Sweden Europe Museums, Historical Sites, Zoos, And Parks Revenue (Million) Forecast, by Application 2020 & 2033
- Table 15: Norway Europe Museums, Historical Sites, Zoos, And Parks Revenue (Million) Forecast, by Application 2020 & 2033
- Table 16: Poland Europe Museums, Historical Sites, Zoos, And Parks Revenue (Million) Forecast, by Application 2020 & 2033
- Table 17: Denmark Europe Museums, Historical Sites, Zoos, And Parks Revenue (Million) Forecast, by Application 2020 & 2033
Frequently Asked Questions
1. What is the projected Compound Annual Growth Rate (CAGR) of the Europe Museums, Historical Sites, Zoos, And Parks?
The projected CAGR is approximately 6.66%.
2. Which companies are prominent players in the Europe Museums, Historical Sites, Zoos, And Parks?
Key companies in the market include Reina Sofia Madrid, Natural History Museum London, Durmitor**List Not Exhaustive, Basel Zoo Switzerland, Museo Nacional Del Prado Madrid, State Tretyakov Gallery Moscow, Centre Pompidou Paris, Chester Zoo England, Plitvice Lakes National Park, State Hermitage St Petersburg, British Museum London, Pairi Daiza Zoo Southern Belgium, Zoologischer Garten Berlin AG, Schonbrunner Zoo Vienna, Vatican Museums Vatican, Louvre Paris.
3. What are the main segments of the Europe Museums, Historical Sites, Zoos, And Parks?
The market segments include Type, Revenue Source.
4. Can you provide details about the market size?
The market size is estimated to be USD 43.29 Million as of 2022.
5. What are some drivers contributing to market growth?
Rise in the Number of Visitors to Museums is Driving the Market; Digitalization is Driving the Market.
6. What are the notable trends driving market growth?
Rise in the Number of Visitors to Museums is Driving the Market.
7. Are there any restraints impacting market growth?
Maintenance and Preservation Costs; Changing Visitor Preferences.
8. Can you provide examples of recent developments in the market?
March 2023: Young V&A will open its doors in Bethnal Green for the summer holidays after a project that has seen it be transformed from its former iteration as the V&A Museum of Childhood.
9. What pricing options are available for accessing the report?
Pricing options include single-user, multi-user, and enterprise licenses priced at USD 4750, USD 5250, and USD 8750 respectively.
10. Is the market size provided in terms of value or volume?
The market size is provided in terms of value, measured in Million.
11. Are there any specific market keywords associated with the report?
Yes, the market keyword associated with the report is "Europe Museums, Historical Sites, Zoos, And Parks," which aids in identifying and referencing the specific market segment covered.
12. How do I determine which pricing option suits my needs best?
The pricing options vary based on user requirements and access needs. Individual users may opt for single-user licenses, while businesses requiring broader access may choose multi-user or enterprise licenses for cost-effective access to the report.
13. Are there any additional resources or data provided in the Europe Museums, Historical Sites, Zoos, And Parks report?
While the report offers comprehensive insights, it's advisable to review the specific contents or supplementary materials provided to ascertain if additional resources or data are available.
14. How can I stay updated on further developments or reports in the Europe Museums, Historical Sites, Zoos, And Parks?
To stay informed about further developments, trends, and reports in the Europe Museums, Historical Sites, Zoos, And Parks, consider subscribing to industry newsletters, following relevant companies and organizations, or regularly checking reputable industry news sources and publications.
Methodology
Step 1 - Identification of Relevant Samples Size from Population Database


Step 2 - Approaches for Defining Global Market Size (Value, Volume* & Price*)

Note*: In applicable scenarios
Step 3 - Data Sources
Primary Research
- Web Analytics
- Survey Reports
- Research Institute
- Latest Research Reports
- Opinion Leaders
Secondary Research
- Annual Reports
- White Paper
- Latest Press Release
- Industry Association
- Paid Database
- Investor Presentations

Step 4 - Data Triangulation
Involves using different sources of information in order to increase the validity of a study
These sources are likely to be stakeholders in a program - participants, other researchers, program staff, other community members, and so on.
Then we put all data in single framework & apply various statistical tools to find out the dynamic on the market.
During the analysis stage, feedback from the stakeholder groups would be compared to determine areas of agreement as well as areas of divergence