
Key Insights
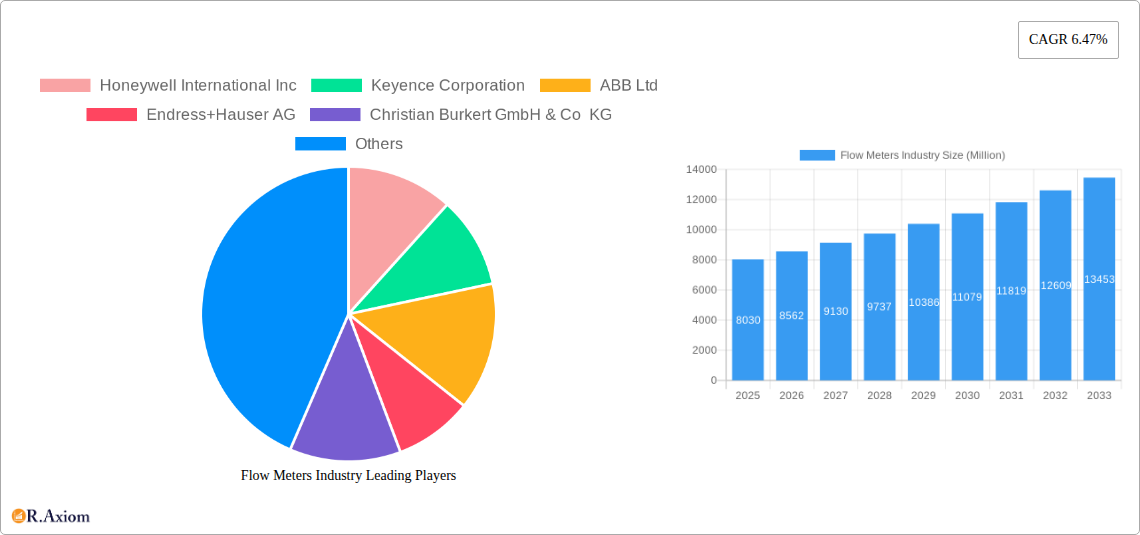
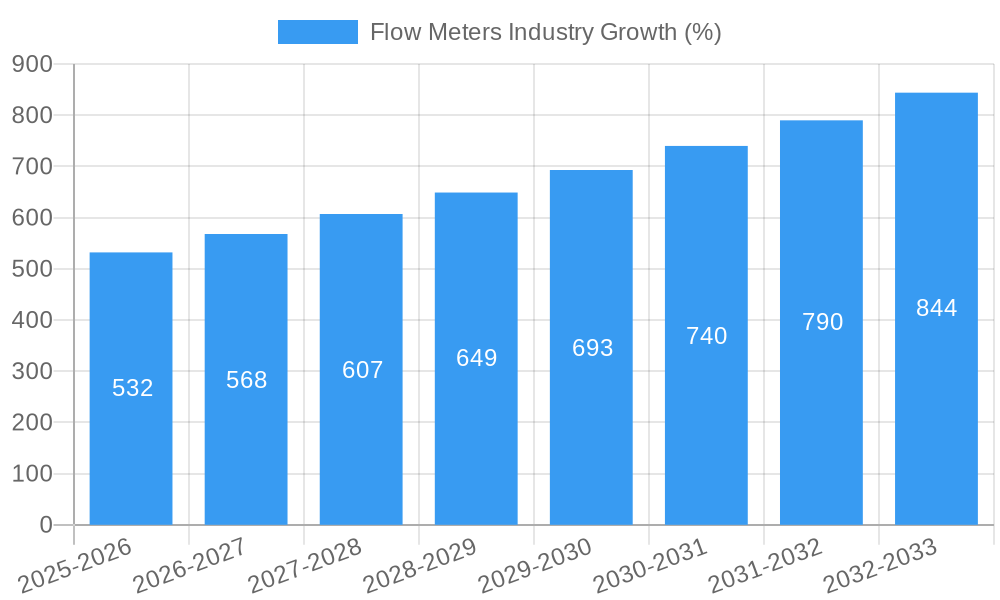
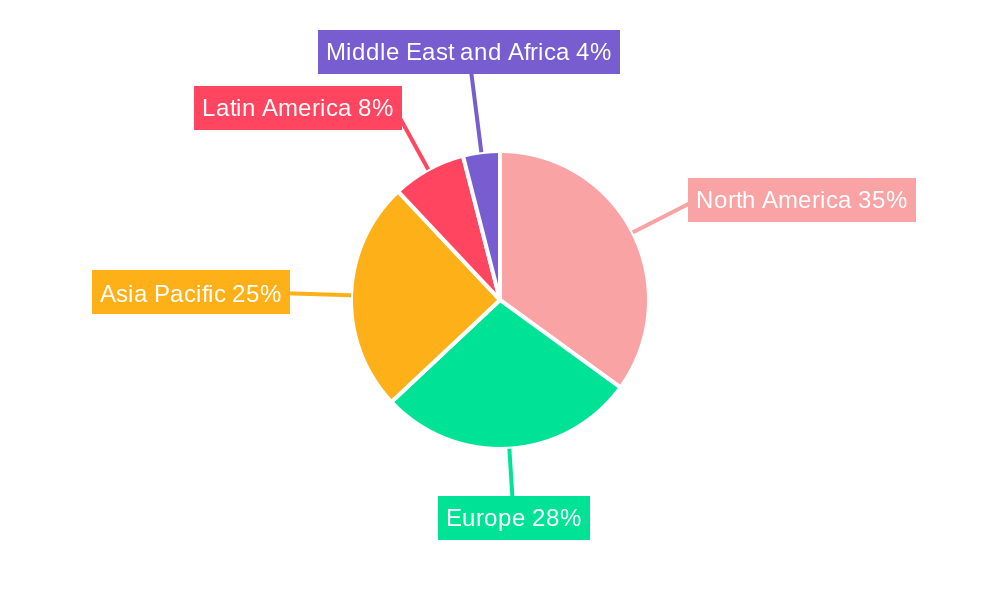
The global flow meters market, valued at $8.03 billion in 2025, is projected to experience robust growth, driven by increasing demand across diverse end-user industries. A compound annual growth rate (CAGR) of 6.47% is anticipated from 2025 to 2033, indicating a significant expansion of the market. Key growth drivers include the rising adoption of advanced technologies like Coriolis and electromagnetic flow meters in oil and gas, water treatment, and chemical processing sectors, fueled by the need for precise and reliable flow measurement in these industries. Furthermore, stringent environmental regulations and the growing emphasis on process optimization are bolstering market expansion. The market is segmented by technology (Coriolis, electromagnetic, differential pressure, ultrasonic, and other in-line technologies), and end-user industries (oil and gas, water and wastewater, chemical and petrochemical, food and beverage, pulp and paper, and others). Technological advancements, including the development of smart flow meters with enhanced connectivity and data analytics capabilities, are creating new opportunities. However, factors like high initial investment costs associated with advanced flow meters and the need for skilled technicians for installation and maintenance could pose challenges to market growth. The competitive landscape includes established players like Honeywell, Endress+Hauser, Emerson Electric, and Siemens, alongside several specialized manufacturers. Regional growth is expected to be geographically diverse, with North America and Asia-Pacific likely leading the expansion due to significant industrial activity and infrastructural development.
The market's future trajectory hinges on several factors. Continued technological innovation, particularly in areas like miniaturization, improved accuracy, and enhanced durability, will play a significant role. Furthermore, the increasing adoption of Industry 4.0 technologies and the growing demand for real-time flow data for process control and optimization will drive demand. The development of sustainable and energy-efficient flow meters will also contribute to market growth. Competition is expected to remain intense, with companies focusing on product differentiation, technological advancements, and strategic partnerships to maintain a strong market presence. Government initiatives promoting industrial automation and digitalization in various sectors will further stimulate market growth. Overall, the flow meters market exhibits a positive outlook, fueled by sustained growth across various segments and regions.
Flow Meters Industry: Market Analysis & Forecast Report (2019-2033)
This comprehensive report provides a detailed analysis of the global flow meters industry, covering market size, growth projections, technological advancements, and competitive dynamics. With a study period spanning 2019-2033, a base year of 2025, and a forecast period of 2025-2033, this report offers invaluable insights for industry stakeholders, investors, and researchers. The report leverages a wealth of data from the historical period (2019-2024) to present a robust and reliable forecast. The estimated market size in 2025 is expected to reach xx Million.
Flow Meters Industry Market Concentration & Innovation
The flow meters market exhibits a moderately concentrated landscape, with several major players holding significant market share. Honeywell International Inc, Keyence Corporation, ABB Ltd, Endress+Hauser AG, and Emerson Electric Co are among the leading companies, collectively accounting for an estimated xx% of the global market in 2025. However, the presence of numerous smaller players and the continuous emergence of innovative technologies contribute to a dynamic competitive environment.
Innovation Drivers:
- Miniaturization and improved sensor technology for enhanced accuracy and efficiency.
- Development of smart flow meters with integrated data analytics and remote monitoring capabilities.
- Growing demand for energy-efficient and environmentally friendly flow meters.
Regulatory Frameworks & Product Substitutes:
Stringent environmental regulations and safety standards across various end-user industries drive innovation and adoption of advanced flow meters. While few direct substitutes exist, alternative measurement techniques and technologies constantly challenge the dominance of traditional flow meters.
End-User Trends & M&A Activities:
The increasing adoption of automation and digitalization across various industries fuels demand for advanced flow meters. Significant M&A activities, with deal values exceeding xx Million in recent years, indicate consolidation and expansion strategies among major players. Examples include (but are not limited to) strategic acquisitions to enhance product portfolios and expand geographic reach.
Flow Meters Industry Industry Trends & Insights
The global flow meters market is poised for robust growth, driven by several key factors. The compound annual growth rate (CAGR) from 2025 to 2033 is projected to be xx%, indicating strong expansion potential. This growth is propelled by rising demand from key end-user industries like oil and gas, water and wastewater, and chemicals, coupled with technological advancements leading to higher accuracy, reliability, and efficiency of flow measurement devices. Market penetration is currently at xx% and is anticipated to rise further due to increasing automation and digitalization efforts globally. Consumer preference for precise and reliable measurement tools drives the adoption of advanced features and technologies, leading to the higher demand for smart and IoT-connected flow meters. Competition is intense, with players constantly striving for innovation and cost optimization, resulting in continuous improvement in flow meter technology.
Dominant Markets & Segments in Flow Meters Industry
The Oil & Gas segment consistently remains a dominant end-user industry for flow meters, accounting for the largest market share due to its extensive use in oil and gas extraction, processing, and transportation. The Chemical and Petrochemical industries are also significant consumers, owing to the critical role of flow measurement in their complex processes. Geographically, North America and Europe currently hold dominant positions, driven by advanced technological infrastructure and stringent regulatory compliance. However, the Asia-Pacific region is experiencing rapid growth fueled by industrialization and increasing investments in infrastructure development.
Key Drivers by Segment:
- Oil and Gas: Growing exploration and production activities, stringent regulatory compliance, and increasing need for efficient resource management.
- Water and Wastewater: Expanding urbanization, growing water scarcity concerns, and the need for precise water management solutions.
- Chemical and Petrochemical: Complex production processes, safety regulations, and stringent quality control requirements.
- Electromagnetic Technology: High accuracy and suitability for conductive fluids.
- Coriolis Technology: High accuracy and ability to measure mass flow rate.
- Ultrasonic Technology: Non-invasive and suitable for various fluid types.
Dominance Analysis: The dominance of specific regions and segments is primarily attributed to factors such as technological advancement, regulatory environment, and economic development. Mature markets like North America and Europe show higher adoption of advanced technologies, while developing economies like those in the Asia-Pacific region are experiencing rapid growth driven by industrial expansion.
Flow Meters Industry Product Developments
Recent years have witnessed significant advancements in flow meter technology. The integration of smart sensors, digital communication protocols, and data analytics enhances operational efficiency and provides real-time insights into flow parameters. Developments like the KROHNE FLEXMAG 4050 C and the SONOTEC SONOFLOW CO.55 V3.0 exemplify this trend. These innovative products deliver superior accuracy, reliability, and ease of integration with existing systems, catering to the evolving demands of diverse end-user industries. The market fit for these advanced flow meters is driven by the increasing need for precise and efficient flow measurement across various sectors.
Report Scope & Segmentation Analysis
This report segments the flow meters market by technology (Coriolis, Electromagnetic, Differential Pressure, Ultrasonic, In-line, and Other Technologies) and end-user industry (Oil and Gas, Water and Wastewater, Chemical and Petrochemical, Food & Beverage, Pulp and Paper, and Other End-user Industries). Each segment's growth is analyzed, along with market size projections and competitive dynamics. The growth projections vary significantly depending on the segment, with some experiencing higher growth than others. For instance, the smart flow meters segment demonstrates robust growth due to its enhanced capabilities.
Key Drivers of Flow Meters Industry Growth
Several factors drive the flow meters market's growth. Technological advancements, such as the development of miniaturized, smart, and energy-efficient flow meters, enhance measurement accuracy and efficiency. The increasing automation and digitalization across various industries, particularly oil and gas and chemical processing, demand advanced flow measurement solutions. Stringent environmental regulations and the need for efficient resource management in water and wastewater treatment plants are further driving factors.
Challenges in the Flow Meters Industry Sector
The flow meters industry faces challenges, including the high initial investment cost of advanced flow meters, which can be a barrier for small and medium-sized enterprises. Supply chain disruptions and the volatility of raw material prices impact manufacturing costs and profitability. Intense competition from both established players and new entrants necessitates continuous innovation and cost optimization to maintain market share.
Emerging Opportunities in Flow Meters Industry
Emerging opportunities lie in the expansion into new and developing markets, especially in regions experiencing rapid industrialization. The integration of flow meters with IoT platforms creates opportunities for data-driven decision-making and predictive maintenance. The increasing focus on sustainability and energy efficiency drives the development of eco-friendly flow meters with reduced environmental impact.
Leading Players in the Flow Meters Industry Market
- Honeywell International Inc
- Keyence Corporation
- ABB Ltd
- Endress+Hauser AG
- Christian Burkert GmbH & Co KG
- Emerson Electric Co
- SICK AG
- Siemens AG
- Sensirion AG
- TSI incorporated
- OMEGA Engineering
- Krohne Messtechnik GmbH
- Azbil Corporation
- Yokogawa Electric Corporation
- Bronkhorst High-Tech BV
Key Developments in Flow Meters Industry Industry
- October 2022: Watson-Marlow Fluid Technology Solutions (WMFTS) launched the KROHNE FLEXMAG 4050 C electromagnetic flowmeter for biopharmaceutical clients, strengthening its position in total-solution packages for fluid path processes.
- May 2022: SONOTEC improved its SONOFLOW CO.55 non-contact flow meter (V3.0) for enhanced efficiency in PAT-related biotechnology activities, offering exceptional measurement accuracy and repeatability.
Strategic Outlook for Flow Meters Industry Market
The flow meters market exhibits strong growth potential, driven by technological innovation, increasing automation, and growing demand from diverse end-user industries. The integration of advanced technologies like AI and IoT will further enhance the capabilities of flow meters, creating new opportunities for data-driven decision-making and predictive maintenance. The focus on sustainability will propel the adoption of energy-efficient and environmentally friendly flow meters. The market is expected to see a continued rise in demand for advanced flow meters, leading to significant growth in the forecast period.
Flow Meters Industry Segmentation
-
1. Technology
- 1.1. Coriolis
-
1.2. Electromagnetic
- 1.2.1. In-line Magnetic Flowmeters
- 1.2.2. Low Flow Magnetic Flowmeters
- 1.2.3. Insertion
- 1.3. Differential Pressure
-
1.4. Ultrasonic
- 1.4.1. Clamp-on
- 1.5. Other Technologies
-
2. End-user Industry
- 2.1. Oil and Gas
- 2.2. Water and Wastewater
- 2.3. Chemical and Petrochemical
- 2.4. Food & Beverage
- 2.5. Pulp and Paper
- 2.6. Other End-user Industries
Flow Meters Industry Segmentation By Geography
-
1. North America
- 1.1. United States
- 1.2. Canada
-
2. Europe
- 2.1. United Kingdom
- 2.2. Germany
- 2.3. France
- 2.4. Rest of Europe
-
3. Asia Pacific
- 3.1. China
- 3.2. Japan
- 3.3. India
- 3.4. Rest of Asia Pacific
- 4. Latin America
- 5. Middle East and Africa
Flow Meters Industry REPORT HIGHLIGHTS
| Aspects | Details |
|---|---|
| Study Period | 2019-2033 |
| Base Year | 2024 |
| Estimated Year | 2025 |
| Forecast Period | 2025-2033 |
| Historical Period | 2019-2024 |
| Growth Rate | CAGR of 6.47% from 2019-2033 |
| Segmentation |
|
Table of Contents
- 1. Introduction
- 1.1. Research Scope
- 1.2. Market Segmentation
- 1.3. Research Methodology
- 1.4. Definitions and Assumptions
- 2. Executive Summary
- 2.1. Introduction
- 3. Market Dynamics
- 3.1. Introduction
- 3.2. Market Drivers
- 3.2.1. Penetration of IoT and Automation in Flow Rate Measurement Applications; Growing Industrial Demand regarding Safety and Efficiency Concerns
- 3.3. Market Restrains
- 3.3.1. High Capital Investments; Fluctuating Commodity Prices and Volatile Economic Scenario
- 3.4. Market Trends
- 3.4.1. Electromagnetic Flow Meter Holds Significant Market Share
- 4. Market Factor Analysis
- 4.1. Porters Five Forces
- 4.2. Supply/Value Chain
- 4.3. PESTEL analysis
- 4.4. Market Entropy
- 4.5. Patent/Trademark Analysis
- 5. Global Flow Meters Industry Analysis, Insights and Forecast, 2019-2031
- 5.1. Market Analysis, Insights and Forecast - by Technology
- 5.1.1. Coriolis
- 5.1.2. Electromagnetic
- 5.1.2.1. In-line Magnetic Flowmeters
- 5.1.2.2. Low Flow Magnetic Flowmeters
- 5.1.2.3. Insertion
- 5.1.3. Differential Pressure
- 5.1.4. Ultrasonic
- 5.1.4.1. Clamp-on
- 5.1.5. Other Technologies
- 5.2. Market Analysis, Insights and Forecast - by End-user Industry
- 5.2.1. Oil and Gas
- 5.2.2. Water and Wastewater
- 5.2.3. Chemical and Petrochemical
- 5.2.4. Food & Beverage
- 5.2.5. Pulp and Paper
- 5.2.6. Other End-user Industries
- 5.3. Market Analysis, Insights and Forecast - by Region
- 5.3.1. North America
- 5.3.2. Europe
- 5.3.3. Asia Pacific
- 5.3.4. Latin America
- 5.3.5. Middle East and Africa
- 5.1. Market Analysis, Insights and Forecast - by Technology
- 6. North America Flow Meters Industry Analysis, Insights and Forecast, 2019-2031
- 6.1. Market Analysis, Insights and Forecast - by Technology
- 6.1.1. Coriolis
- 6.1.2. Electromagnetic
- 6.1.2.1. In-line Magnetic Flowmeters
- 6.1.2.2. Low Flow Magnetic Flowmeters
- 6.1.2.3. Insertion
- 6.1.3. Differential Pressure
- 6.1.4. Ultrasonic
- 6.1.4.1. Clamp-on
- 6.1.5. Other Technologies
- 6.2. Market Analysis, Insights and Forecast - by End-user Industry
- 6.2.1. Oil and Gas
- 6.2.2. Water and Wastewater
- 6.2.3. Chemical and Petrochemical
- 6.2.4. Food & Beverage
- 6.2.5. Pulp and Paper
- 6.2.6. Other End-user Industries
- 6.1. Market Analysis, Insights and Forecast - by Technology
- 7. Europe Flow Meters Industry Analysis, Insights and Forecast, 2019-2031
- 7.1. Market Analysis, Insights and Forecast - by Technology
- 7.1.1. Coriolis
- 7.1.2. Electromagnetic
- 7.1.2.1. In-line Magnetic Flowmeters
- 7.1.2.2. Low Flow Magnetic Flowmeters
- 7.1.2.3. Insertion
- 7.1.3. Differential Pressure
- 7.1.4. Ultrasonic
- 7.1.4.1. Clamp-on
- 7.1.5. Other Technologies
- 7.2. Market Analysis, Insights and Forecast - by End-user Industry
- 7.2.1. Oil and Gas
- 7.2.2. Water and Wastewater
- 7.2.3. Chemical and Petrochemical
- 7.2.4. Food & Beverage
- 7.2.5. Pulp and Paper
- 7.2.6. Other End-user Industries
- 7.1. Market Analysis, Insights and Forecast - by Technology
- 8. Asia Pacific Flow Meters Industry Analysis, Insights and Forecast, 2019-2031
- 8.1. Market Analysis, Insights and Forecast - by Technology
- 8.1.1. Coriolis
- 8.1.2. Electromagnetic
- 8.1.2.1. In-line Magnetic Flowmeters
- 8.1.2.2. Low Flow Magnetic Flowmeters
- 8.1.2.3. Insertion
- 8.1.3. Differential Pressure
- 8.1.4. Ultrasonic
- 8.1.4.1. Clamp-on
- 8.1.5. Other Technologies
- 8.2. Market Analysis, Insights and Forecast - by End-user Industry
- 8.2.1. Oil and Gas
- 8.2.2. Water and Wastewater
- 8.2.3. Chemical and Petrochemical
- 8.2.4. Food & Beverage
- 8.2.5. Pulp and Paper
- 8.2.6. Other End-user Industries
- 8.1. Market Analysis, Insights and Forecast - by Technology
- 9. Latin America Flow Meters Industry Analysis, Insights and Forecast, 2019-2031
- 9.1. Market Analysis, Insights and Forecast - by Technology
- 9.1.1. Coriolis
- 9.1.2. Electromagnetic
- 9.1.2.1. In-line Magnetic Flowmeters
- 9.1.2.2. Low Flow Magnetic Flowmeters
- 9.1.2.3. Insertion
- 9.1.3. Differential Pressure
- 9.1.4. Ultrasonic
- 9.1.4.1. Clamp-on
- 9.1.5. Other Technologies
- 9.2. Market Analysis, Insights and Forecast - by End-user Industry
- 9.2.1. Oil and Gas
- 9.2.2. Water and Wastewater
- 9.2.3. Chemical and Petrochemical
- 9.2.4. Food & Beverage
- 9.2.5. Pulp and Paper
- 9.2.6. Other End-user Industries
- 9.1. Market Analysis, Insights and Forecast - by Technology
- 10. Middle East and Africa Flow Meters Industry Analysis, Insights and Forecast, 2019-2031
- 10.1. Market Analysis, Insights and Forecast - by Technology
- 10.1.1. Coriolis
- 10.1.2. Electromagnetic
- 10.1.2.1. In-line Magnetic Flowmeters
- 10.1.2.2. Low Flow Magnetic Flowmeters
- 10.1.2.3. Insertion
- 10.1.3. Differential Pressure
- 10.1.4. Ultrasonic
- 10.1.4.1. Clamp-on
- 10.1.5. Other Technologies
- 10.2. Market Analysis, Insights and Forecast - by End-user Industry
- 10.2.1. Oil and Gas
- 10.2.2. Water and Wastewater
- 10.2.3. Chemical and Petrochemical
- 10.2.4. Food & Beverage
- 10.2.5. Pulp and Paper
- 10.2.6. Other End-user Industries
- 10.1. Market Analysis, Insights and Forecast - by Technology
- 11. North America Flow Meters Industry Analysis, Insights and Forecast, 2019-2031
- 11.1. Market Analysis, Insights and Forecast - By Country/Sub-region
- 11.1.1 United States
- 11.1.2 Canada
- 12. Europe Flow Meters Industry Analysis, Insights and Forecast, 2019-2031
- 12.1. Market Analysis, Insights and Forecast - By Country/Sub-region
- 12.1.1 United Kingdom
- 12.1.2 Germany
- 12.1.3 France
- 12.1.4 Rest of Europe
- 13. Asia Pacific Flow Meters Industry Analysis, Insights and Forecast, 2019-2031
- 13.1. Market Analysis, Insights and Forecast - By Country/Sub-region
- 13.1.1 China
- 13.1.2 Japan
- 13.1.3 India
- 13.1.4 Rest of Asia Pacific
- 14. Latin America Flow Meters Industry Analysis, Insights and Forecast, 2019-2031
- 14.1. Market Analysis, Insights and Forecast - By Country/Sub-region
- 14.1.1.
- 15. Middle East and Africa Flow Meters Industry Analysis, Insights and Forecast, 2019-2031
- 15.1. Market Analysis, Insights and Forecast - By Country/Sub-region
- 15.1.1.
- 16. Competitive Analysis
- 16.1. Global Market Share Analysis 2024
- 16.2. Company Profiles
- 16.2.1 Honeywell International Inc
- 16.2.1.1. Overview
- 16.2.1.2. Products
- 16.2.1.3. SWOT Analysis
- 16.2.1.4. Recent Developments
- 16.2.1.5. Financials (Based on Availability)
- 16.2.2 Keyence Corporation
- 16.2.2.1. Overview
- 16.2.2.2. Products
- 16.2.2.3. SWOT Analysis
- 16.2.2.4. Recent Developments
- 16.2.2.5. Financials (Based on Availability)
- 16.2.3 ABB Ltd
- 16.2.3.1. Overview
- 16.2.3.2. Products
- 16.2.3.3. SWOT Analysis
- 16.2.3.4. Recent Developments
- 16.2.3.5. Financials (Based on Availability)
- 16.2.4 Endress+Hauser AG
- 16.2.4.1. Overview
- 16.2.4.2. Products
- 16.2.4.3. SWOT Analysis
- 16.2.4.4. Recent Developments
- 16.2.4.5. Financials (Based on Availability)
- 16.2.5 Christian Burkert GmbH & Co KG
- 16.2.5.1. Overview
- 16.2.5.2. Products
- 16.2.5.3. SWOT Analysis
- 16.2.5.4. Recent Developments
- 16.2.5.5. Financials (Based on Availability)
- 16.2.6 Emerson Electric Co
- 16.2.6.1. Overview
- 16.2.6.2. Products
- 16.2.6.3. SWOT Analysis
- 16.2.6.4. Recent Developments
- 16.2.6.5. Financials (Based on Availability)
- 16.2.7 SICK AG
- 16.2.7.1. Overview
- 16.2.7.2. Products
- 16.2.7.3. SWOT Analysis
- 16.2.7.4. Recent Developments
- 16.2.7.5. Financials (Based on Availability)
- 16.2.8 Siemens AG
- 16.2.8.1. Overview
- 16.2.8.2. Products
- 16.2.8.3. SWOT Analysis
- 16.2.8.4. Recent Developments
- 16.2.8.5. Financials (Based on Availability)
- 16.2.9 Sensirion AG
- 16.2.9.1. Overview
- 16.2.9.2. Products
- 16.2.9.3. SWOT Analysis
- 16.2.9.4. Recent Developments
- 16.2.9.5. Financials (Based on Availability)
- 16.2.10 TSI incorporated
- 16.2.10.1. Overview
- 16.2.10.2. Products
- 16.2.10.3. SWOT Analysis
- 16.2.10.4. Recent Developments
- 16.2.10.5. Financials (Based on Availability)
- 16.2.11 OMEGA Engineering
- 16.2.11.1. Overview
- 16.2.11.2. Products
- 16.2.11.3. SWOT Analysis
- 16.2.11.4. Recent Developments
- 16.2.11.5. Financials (Based on Availability)
- 16.2.12 Krohne Messtechnik GmbH*List Not Exhaustive
- 16.2.12.1. Overview
- 16.2.12.2. Products
- 16.2.12.3. SWOT Analysis
- 16.2.12.4. Recent Developments
- 16.2.12.5. Financials (Based on Availability)
- 16.2.13 Azbil Corporation
- 16.2.13.1. Overview
- 16.2.13.2. Products
- 16.2.13.3. SWOT Analysis
- 16.2.13.4. Recent Developments
- 16.2.13.5. Financials (Based on Availability)
- 16.2.14 Yokogawa Electric Corporation
- 16.2.14.1. Overview
- 16.2.14.2. Products
- 16.2.14.3. SWOT Analysis
- 16.2.14.4. Recent Developments
- 16.2.14.5. Financials (Based on Availability)
- 16.2.15 Bronkhorst High-Tech BV
- 16.2.15.1. Overview
- 16.2.15.2. Products
- 16.2.15.3. SWOT Analysis
- 16.2.15.4. Recent Developments
- 16.2.15.5. Financials (Based on Availability)
- 16.2.1 Honeywell International Inc
List of Figures
- Figure 1: Global Flow Meters Industry Revenue Breakdown (Million, %) by Region 2024 & 2032
- Figure 2: North America Flow Meters Industry Revenue (Million), by Country 2024 & 2032
- Figure 3: North America Flow Meters Industry Revenue Share (%), by Country 2024 & 2032
- Figure 4: Europe Flow Meters Industry Revenue (Million), by Country 2024 & 2032
- Figure 5: Europe Flow Meters Industry Revenue Share (%), by Country 2024 & 2032
- Figure 6: Asia Pacific Flow Meters Industry Revenue (Million), by Country 2024 & 2032
- Figure 7: Asia Pacific Flow Meters Industry Revenue Share (%), by Country 2024 & 2032
- Figure 8: Latin America Flow Meters Industry Revenue (Million), by Country 2024 & 2032
- Figure 9: Latin America Flow Meters Industry Revenue Share (%), by Country 2024 & 2032
- Figure 10: Middle East and Africa Flow Meters Industry Revenue (Million), by Country 2024 & 2032
- Figure 11: Middle East and Africa Flow Meters Industry Revenue Share (%), by Country 2024 & 2032
- Figure 12: North America Flow Meters Industry Revenue (Million), by Technology 2024 & 2032
- Figure 13: North America Flow Meters Industry Revenue Share (%), by Technology 2024 & 2032
- Figure 14: North America Flow Meters Industry Revenue (Million), by End-user Industry 2024 & 2032
- Figure 15: North America Flow Meters Industry Revenue Share (%), by End-user Industry 2024 & 2032
- Figure 16: North America Flow Meters Industry Revenue (Million), by Country 2024 & 2032
- Figure 17: North America Flow Meters Industry Revenue Share (%), by Country 2024 & 2032
- Figure 18: Europe Flow Meters Industry Revenue (Million), by Technology 2024 & 2032
- Figure 19: Europe Flow Meters Industry Revenue Share (%), by Technology 2024 & 2032
- Figure 20: Europe Flow Meters Industry Revenue (Million), by End-user Industry 2024 & 2032
- Figure 21: Europe Flow Meters Industry Revenue Share (%), by End-user Industry 2024 & 2032
- Figure 22: Europe Flow Meters Industry Revenue (Million), by Country 2024 & 2032
- Figure 23: Europe Flow Meters Industry Revenue Share (%), by Country 2024 & 2032
- Figure 24: Asia Pacific Flow Meters Industry Revenue (Million), by Technology 2024 & 2032
- Figure 25: Asia Pacific Flow Meters Industry Revenue Share (%), by Technology 2024 & 2032
- Figure 26: Asia Pacific Flow Meters Industry Revenue (Million), by End-user Industry 2024 & 2032
- Figure 27: Asia Pacific Flow Meters Industry Revenue Share (%), by End-user Industry 2024 & 2032
- Figure 28: Asia Pacific Flow Meters Industry Revenue (Million), by Country 2024 & 2032
- Figure 29: Asia Pacific Flow Meters Industry Revenue Share (%), by Country 2024 & 2032
- Figure 30: Latin America Flow Meters Industry Revenue (Million), by Technology 2024 & 2032
- Figure 31: Latin America Flow Meters Industry Revenue Share (%), by Technology 2024 & 2032
- Figure 32: Latin America Flow Meters Industry Revenue (Million), by End-user Industry 2024 & 2032
- Figure 33: Latin America Flow Meters Industry Revenue Share (%), by End-user Industry 2024 & 2032
- Figure 34: Latin America Flow Meters Industry Revenue (Million), by Country 2024 & 2032
- Figure 35: Latin America Flow Meters Industry Revenue Share (%), by Country 2024 & 2032
- Figure 36: Middle East and Africa Flow Meters Industry Revenue (Million), by Technology 2024 & 2032
- Figure 37: Middle East and Africa Flow Meters Industry Revenue Share (%), by Technology 2024 & 2032
- Figure 38: Middle East and Africa Flow Meters Industry Revenue (Million), by End-user Industry 2024 & 2032
- Figure 39: Middle East and Africa Flow Meters Industry Revenue Share (%), by End-user Industry 2024 & 2032
- Figure 40: Middle East and Africa Flow Meters Industry Revenue (Million), by Country 2024 & 2032
- Figure 41: Middle East and Africa Flow Meters Industry Revenue Share (%), by Country 2024 & 2032
List of Tables
- Table 1: Global Flow Meters Industry Revenue Million Forecast, by Region 2019 & 2032
- Table 2: Global Flow Meters Industry Revenue Million Forecast, by Technology 2019 & 2032
- Table 3: Global Flow Meters Industry Revenue Million Forecast, by End-user Industry 2019 & 2032
- Table 4: Global Flow Meters Industry Revenue Million Forecast, by Region 2019 & 2032
- Table 5: Global Flow Meters Industry Revenue Million Forecast, by Country 2019 & 2032
- Table 6: United States Flow Meters Industry Revenue (Million) Forecast, by Application 2019 & 2032
- Table 7: Canada Flow Meters Industry Revenue (Million) Forecast, by Application 2019 & 2032
- Table 8: Global Flow Meters Industry Revenue Million Forecast, by Country 2019 & 2032
- Table 9: United Kingdom Flow Meters Industry Revenue (Million) Forecast, by Application 2019 & 2032
- Table 10: Germany Flow Meters Industry Revenue (Million) Forecast, by Application 2019 & 2032
- Table 11: France Flow Meters Industry Revenue (Million) Forecast, by Application 2019 & 2032
- Table 12: Rest of Europe Flow Meters Industry Revenue (Million) Forecast, by Application 2019 & 2032
- Table 13: Global Flow Meters Industry Revenue Million Forecast, by Country 2019 & 2032
- Table 14: China Flow Meters Industry Revenue (Million) Forecast, by Application 2019 & 2032
- Table 15: Japan Flow Meters Industry Revenue (Million) Forecast, by Application 2019 & 2032
- Table 16: India Flow Meters Industry Revenue (Million) Forecast, by Application 2019 & 2032
- Table 17: Rest of Asia Pacific Flow Meters Industry Revenue (Million) Forecast, by Application 2019 & 2032
- Table 18: Global Flow Meters Industry Revenue Million Forecast, by Country 2019 & 2032
- Table 19: Flow Meters Industry Revenue (Million) Forecast, by Application 2019 & 2032
- Table 20: Global Flow Meters Industry Revenue Million Forecast, by Country 2019 & 2032
- Table 21: Flow Meters Industry Revenue (Million) Forecast, by Application 2019 & 2032
- Table 22: Global Flow Meters Industry Revenue Million Forecast, by Technology 2019 & 2032
- Table 23: Global Flow Meters Industry Revenue Million Forecast, by End-user Industry 2019 & 2032
- Table 24: Global Flow Meters Industry Revenue Million Forecast, by Country 2019 & 2032
- Table 25: United States Flow Meters Industry Revenue (Million) Forecast, by Application 2019 & 2032
- Table 26: Canada Flow Meters Industry Revenue (Million) Forecast, by Application 2019 & 2032
- Table 27: Global Flow Meters Industry Revenue Million Forecast, by Technology 2019 & 2032
- Table 28: Global Flow Meters Industry Revenue Million Forecast, by End-user Industry 2019 & 2032
- Table 29: Global Flow Meters Industry Revenue Million Forecast, by Country 2019 & 2032
- Table 30: United Kingdom Flow Meters Industry Revenue (Million) Forecast, by Application 2019 & 2032
- Table 31: Germany Flow Meters Industry Revenue (Million) Forecast, by Application 2019 & 2032
- Table 32: France Flow Meters Industry Revenue (Million) Forecast, by Application 2019 & 2032
- Table 33: Rest of Europe Flow Meters Industry Revenue (Million) Forecast, by Application 2019 & 2032
- Table 34: Global Flow Meters Industry Revenue Million Forecast, by Technology 2019 & 2032
- Table 35: Global Flow Meters Industry Revenue Million Forecast, by End-user Industry 2019 & 2032
- Table 36: Global Flow Meters Industry Revenue Million Forecast, by Country 2019 & 2032
- Table 37: China Flow Meters Industry Revenue (Million) Forecast, by Application 2019 & 2032
- Table 38: Japan Flow Meters Industry Revenue (Million) Forecast, by Application 2019 & 2032
- Table 39: India Flow Meters Industry Revenue (Million) Forecast, by Application 2019 & 2032
- Table 40: Rest of Asia Pacific Flow Meters Industry Revenue (Million) Forecast, by Application 2019 & 2032
- Table 41: Global Flow Meters Industry Revenue Million Forecast, by Technology 2019 & 2032
- Table 42: Global Flow Meters Industry Revenue Million Forecast, by End-user Industry 2019 & 2032
- Table 43: Global Flow Meters Industry Revenue Million Forecast, by Country 2019 & 2032
- Table 44: Global Flow Meters Industry Revenue Million Forecast, by Technology 2019 & 2032
- Table 45: Global Flow Meters Industry Revenue Million Forecast, by End-user Industry 2019 & 2032
- Table 46: Global Flow Meters Industry Revenue Million Forecast, by Country 2019 & 2032
Frequently Asked Questions
1. What is the projected Compound Annual Growth Rate (CAGR) of the Flow Meters Industry?
The projected CAGR is approximately 6.47%.
2. Which companies are prominent players in the Flow Meters Industry?
Key companies in the market include Honeywell International Inc, Keyence Corporation, ABB Ltd, Endress+Hauser AG, Christian Burkert GmbH & Co KG, Emerson Electric Co, SICK AG, Siemens AG, Sensirion AG, TSI incorporated, OMEGA Engineering, Krohne Messtechnik GmbH*List Not Exhaustive, Azbil Corporation, Yokogawa Electric Corporation, Bronkhorst High-Tech BV.
3. What are the main segments of the Flow Meters Industry?
The market segments include Technology, End-user Industry.
4. Can you provide details about the market size?
The market size is estimated to be USD 8.03 Million as of 2022.
5. What are some drivers contributing to market growth?
Penetration of IoT and Automation in Flow Rate Measurement Applications; Growing Industrial Demand regarding Safety and Efficiency Concerns.
6. What are the notable trends driving market growth?
Electromagnetic Flow Meter Holds Significant Market Share.
7. Are there any restraints impacting market growth?
High Capital Investments; Fluctuating Commodity Prices and Volatile Economic Scenario.
8. Can you provide examples of recent developments in the market?
October 2022: Watson-Marlow Fluid Technology Solutions (WMFTS) announced that the KROHNE FLEXMAG 4050 C electromagnetic flowmeter is available to biopharmaceutical clients. It strengthens the company's position as a provider of total-solution packages for customers adopting fluid path processes by being an exact and dependable flow measurement device that smoothly connects with other WMFTS products.
9. What pricing options are available for accessing the report?
Pricing options include single-user, multi-user, and enterprise licenses priced at USD 4750, USD 5250, and USD 8750 respectively.
10. Is the market size provided in terms of value or volume?
The market size is provided in terms of value, measured in Million.
11. Are there any specific market keywords associated with the report?
Yes, the market keyword associated with the report is "Flow Meters Industry," which aids in identifying and referencing the specific market segment covered.
12. How do I determine which pricing option suits my needs best?
The pricing options vary based on user requirements and access needs. Individual users may opt for single-user licenses, while businesses requiring broader access may choose multi-user or enterprise licenses for cost-effective access to the report.
13. Are there any additional resources or data provided in the Flow Meters Industry report?
While the report offers comprehensive insights, it's advisable to review the specific contents or supplementary materials provided to ascertain if additional resources or data are available.
14. How can I stay updated on further developments or reports in the Flow Meters Industry?
To stay informed about further developments, trends, and reports in the Flow Meters Industry, consider subscribing to industry newsletters, following relevant companies and organizations, or regularly checking reputable industry news sources and publications.
Methodology
Step 1 - Identification of Relevant Samples Size from Population Database


Step 2 - Approaches for Defining Global Market Size (Value, Volume* & Price*)

Note*: In applicable scenarios
Step 3 - Data Sources
Primary Research
- Web Analytics
- Survey Reports
- Research Institute
- Latest Research Reports
- Opinion Leaders
Secondary Research
- Annual Reports
- White Paper
- Latest Press Release
- Industry Association
- Paid Database
- Investor Presentations

Step 4 - Data Triangulation
Involves using different sources of information in order to increase the validity of a study
These sources are likely to be stakeholders in a program - participants, other researchers, program staff, other community members, and so on.
Then we put all data in single framework & apply various statistical tools to find out the dynamic on the market.
During the analysis stage, feedback from the stakeholder groups would be compared to determine areas of agreement as well as areas of divergence


