
Key Insights
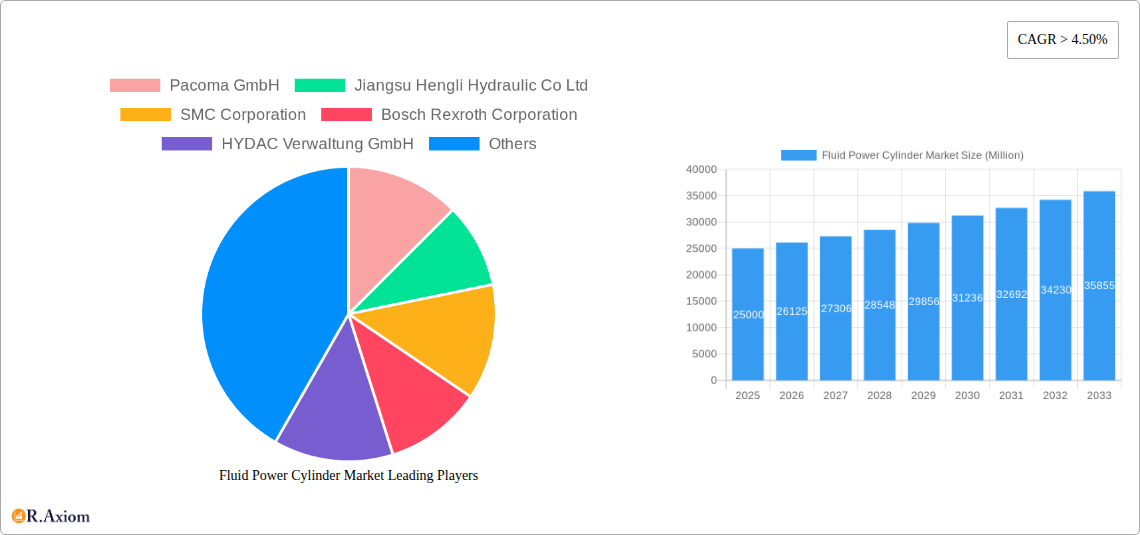
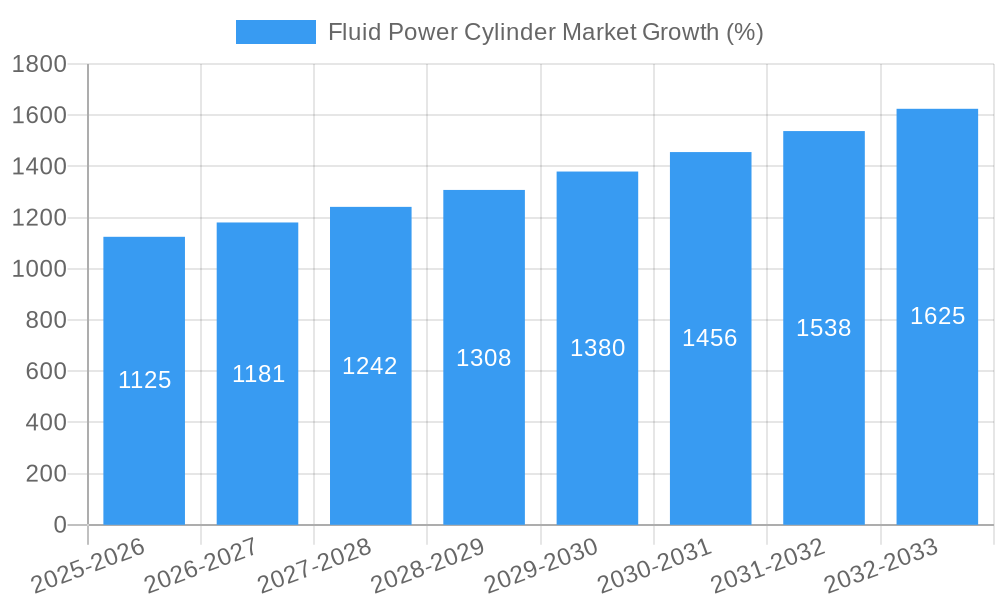
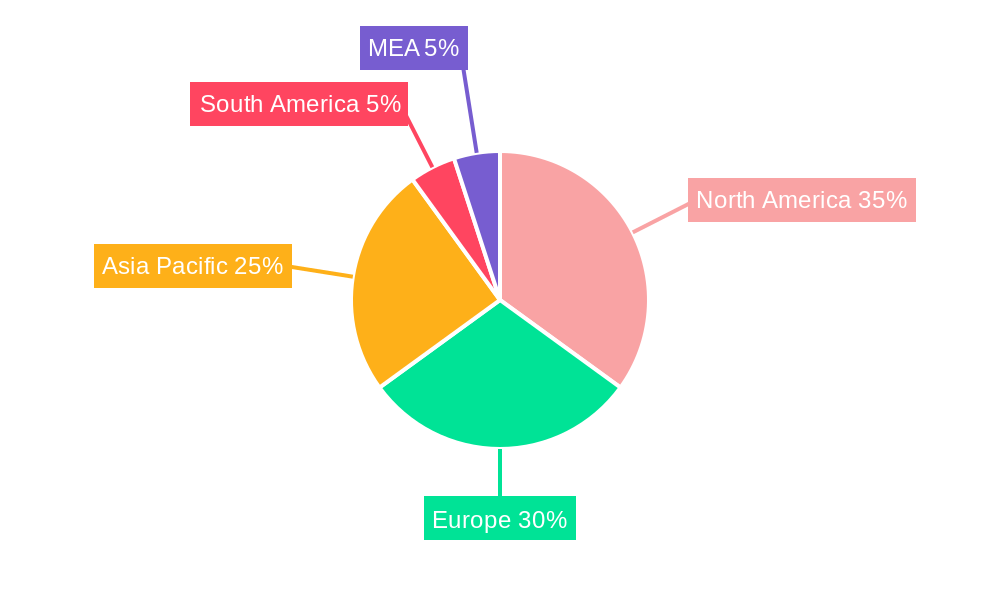
The global fluid power cylinder market is experiencing robust growth, driven by increasing industrial automation across diverse sectors like automotive, manufacturing, and construction. A CAGR exceeding 4.50% indicates a significant expansion, projecting a substantial market value increase over the forecast period (2025-2033). The market is segmented by type (hydraulic and pneumatic cylinders) and end-user industry, with both segments exhibiting considerable growth potential. Hydraulic cylinders dominate certain high-power applications, while pneumatic cylinders find wider use in automation due to their cost-effectiveness and ease of integration. Key trends include the adoption of advanced materials for improved durability and efficiency, miniaturization for space-constrained applications, and the integration of smart technologies such as sensors and controllers for predictive maintenance and optimized performance. While increasing raw material costs and supply chain disruptions pose challenges, the overall market outlook remains positive, fueled by ongoing industrialization and the demand for efficient and reliable automation solutions. Leading players like Parker Hannifin Corp, Bosch Rexroth Corporation, and SMC Corporation are leveraging technological advancements and strategic partnerships to solidify their market positions. The geographical distribution reveals strong growth across North America, Europe, and Asia-Pacific, with emerging economies in Asia-Pacific presenting significant opportunities. Further growth is anticipated as these regions continue to invest in infrastructure development and industrial automation.
The competitive landscape is characterized by a mix of established global players and regional manufacturers. This creates both opportunities and challenges for market participants. Established players are focused on innovation, developing sophisticated products and leveraging their global distribution networks. Regional players, on the other hand, often focus on specific niche markets or offer competitive pricing. Future growth will be influenced by factors such as technological advancements in cylinder design and manufacturing, government regulations regarding emissions and energy efficiency, and the overall economic climate. The increasing adoption of Industry 4.0 principles and the growth of smart factories are expected to further propel the market’s expansion in the coming years, driving the demand for advanced and integrated fluid power cylinder solutions.
Fluid Power Cylinder Market: A Comprehensive Report (2019-2033)
This comprehensive report provides an in-depth analysis of the global Fluid Power Cylinder market, offering valuable insights for industry stakeholders, investors, and strategic decision-makers. The study covers the period from 2019 to 2033, with 2025 serving as the base year and estimated year. The report meticulously examines market dynamics, growth drivers, challenges, and future opportunities, providing a clear understanding of the current landscape and future trajectory. The market is segmented by type (Hydraulic Cylinder, Pneumatic Cylinder) and end-user industry (Hydraulic Cylinder applications, other end-user industries for Pneumatic Cylinders). Key players analyzed include Pacoma GmbH, Jiangsu Hengli Hydraulic Co Ltd, SMC Corporation, Bosch Rexroth Corporation, HYDAC Verwaltung GmbH, Eaton Corporation PLC, Precision Hydraulic Cylinders Inc, Festo SE & Co KG, Danfoss A/S, and Parker Hannifin Corp.
Fluid Power Cylinder Market Market Concentration & Innovation
The Fluid Power Cylinder market exhibits a moderately concentrated landscape, with the top 10 players holding an estimated xx% market share in 2025. Market concentration is influenced by factors such as economies of scale, technological advancements, and brand recognition. Innovation in the sector is driven by the need for improved efficiency, higher performance, and enhanced durability of cylinders across various applications. This is leading to the development of advanced materials, sophisticated control systems, and compact designs. Regulatory frameworks, such as those concerning energy efficiency and environmental impact, are also shaping industry practices. Product substitutes, such as electric actuators and linear motors, are presenting competitive pressure, particularly in niche applications. However, the robustness, reliability, and cost-effectiveness of fluid power cylinders continue to maintain their dominance in several industrial segments. End-user trends towards automation and improved productivity further stimulate demand. Mergers and acquisitions (M&A) activity within the sector has been moderate, with deal values averaging approximately xx Million in recent years, primarily focused on expanding product portfolios and geographic reach. Notable recent acquisitions include [mention specific examples if available, otherwise replace with "xx acquisitions focused on geographic expansion and technology integration"].
Fluid Power Cylinder Market Industry Trends & Insights
The Fluid Power Cylinder market is projected to witness a Compound Annual Growth Rate (CAGR) of xx% during the forecast period (2025-2033). This growth is primarily fueled by the increasing adoption of automation technologies across various industries, notably in manufacturing, construction, and automotive. Technological disruptions, such as the integration of smart sensors and advanced control systems, are enhancing cylinder performance and efficiency, thereby driving market expansion. Consumer preferences are shifting towards more sustainable and energy-efficient solutions, prompting manufacturers to develop eco-friendly hydraulic fluids and energy-saving cylinder designs. Competitive dynamics are characterized by ongoing innovation, strategic partnerships, and a focus on product differentiation. Market penetration of advanced cylinder technologies, such as electro-hydraulic cylinders, is gradually increasing, albeit at a moderate pace due to the relatively higher initial investment costs. Specific industry trends include increased use of simulation and modelling to optimize cylinder designs and a move towards modular and customized cylinder solutions to cater to specific application needs.
Dominant Markets & Segments in Fluid Power Cylinder Market
The Hydraulic Cylinder segment dominates the market by type, accounting for an estimated xx% of the total market revenue in 2025. This is attributable to the widespread use of hydraulic systems in heavy machinery and industrial applications where high power density and force are required. The Pneumatic Cylinder segment, although smaller, is also exhibiting healthy growth driven by its application in automated systems and manufacturing processes. Geographically, [mention leading region/country - e.g., North America/China] is the leading market for fluid power cylinders in 2025, driven by factors such as robust industrial activity, extensive infrastructure development, and supportive government policies.
Key drivers for [leading region/country]:
- Robust industrial sector growth.
- Significant investments in infrastructure projects.
- Favorable government regulations and incentives for automation.
- High adoption rate of automation technologies.
Within end-user industries, the Hydraulic Cylinder segment is dominant in applications such as construction equipment, material handling, and industrial automation. This segment's dominance stems from the high power and force capabilities of hydraulic cylinders compared to other technologies. Other end-user industries using pneumatic cylinders display robust growth, largely driven by increasing automation in manufacturing and packaging applications.
Fluid Power Cylinder Market Product Developments
Recent product innovations in the fluid power cylinder market focus on enhancing energy efficiency, reducing maintenance requirements, and improving overall performance. This includes the development of cylinders with integrated sensors for real-time monitoring, improved sealing technologies for longer lifespan, and more compact designs to save space. These advancements cater to the growing demand for higher precision, faster response times, and improved reliability across diverse applications, aligning with the industry's shift towards automation and Industry 4.0.
Report Scope & Segmentation Analysis
This report segments the Fluid Power Cylinder market by Type: Hydraulic Cylinder and Pneumatic Cylinder. The Hydraulic Cylinder segment is projected to grow at a CAGR of xx% during the forecast period, driven by its prevalence in heavy-duty applications. The Pneumatic Cylinder segment is expected to grow at a CAGR of xx%, fueled by its use in automation and light-duty applications. The market is further segmented by End-user Industry, encompassing Hydraulic Cylinder applications (e.g., construction, manufacturing, material handling) and Other End-user Industries for Pneumatic Cylinders (e.g., packaging, automotive). Each segment exhibits unique growth trajectories and competitive dynamics based on specific application requirements and technological advancements.
Key Drivers of Fluid Power Cylinder Market Growth
The Fluid Power Cylinder market's growth is primarily driven by the increasing demand for automation across various industrial sectors, particularly manufacturing, construction, and automotive. Technological advancements such as smart sensors, advanced control systems, and improved materials contribute significantly to enhancing efficiency and performance. Favorable government policies and regulations promoting industrial automation in several countries also contribute to the market's expansion.
Challenges in the Fluid Power Cylinder Market Sector
The Fluid Power Cylinder market faces challenges such as increasing raw material costs, supply chain disruptions, and intense competition from alternative technologies like electric actuators. Stringent environmental regulations regarding hydraulic fluid disposal also pose challenges, prompting manufacturers to invest in eco-friendly solutions. These factors can impact profitability and hinder market growth if not effectively addressed.
Emerging Opportunities in Fluid Power Cylinder Market
Emerging opportunities exist in the development of energy-efficient, compact, and smart fluid power cylinders tailored to specific applications. Growth is also anticipated in niche sectors such as robotics, renewable energy, and precision engineering. The integration of IoT and advanced analytics capabilities into cylinders presents significant opportunities to enhance performance monitoring and predictive maintenance.
Leading Players in the Fluid Power Cylinder Market Market
- Pacoma GmbH
- Jiangsu Hengli Hydraulic Co Ltd
- SMC Corporation
- Bosch Rexroth Corporation
- HYDAC Verwaltung GmbH
- Eaton Corporation PLC
- Precision Hydraulic Cylinders Inc
- Festo SE & Co KG
- Danfoss A/S
- Parker Hannifin Corp
Key Developments in Fluid Power Cylinder Market Industry
- January 2023: SMC Corporation launched a new line of energy-efficient pneumatic cylinders.
- March 2022: Bosch Rexroth Corporation acquired a smaller competitor, expanding its product portfolio.
- [Add more developments with year/month and impact]
Strategic Outlook for Fluid Power Cylinder Market Market
The Fluid Power Cylinder market is poised for continued growth driven by ongoing industrial automation, technological advancements, and supportive government policies. Focus on developing sustainable and energy-efficient products will be crucial for sustained success. Companies should invest in R&D to innovate new cylinder designs and integrate smart technologies to meet the evolving needs of end-users. Strategic partnerships and acquisitions will play a vital role in expanding market share and gaining a competitive edge.
Fluid Power Cylinder Market Segmentation
-
1. Type
- 1.1. Hydraulic Cylinder
- 1.2. Pneumatic Cylinder
-
2. End-user Industry
-
2.1. Hydraulic Cylinder
- 2.1.1. Construction
- 2.1.2. Agriculture
- 2.1.3. Material Handling
- 2.1.4. Aerospace & Defense
- 2.1.5. Machine Tools
- 2.1.6. Oil & Gas
- 2.1.7. Other End-user Industries
-
2.2. Pneumatic Cylinder
- 2.2.1. Food Processing & Packaging
- 2.2.2. Automotive
- 2.2.3. Material Handling & Assembly
- 2.2.4. Oil & Gas, Chemicals and Plastics
- 2.2.5. Semiconductor & Electronics
- 2.2.6. Life Sciences
-
2.1. Hydraulic Cylinder
Fluid Power Cylinder Market Segmentation By Geography
-
1. North America
- 1.1. United States
- 1.2. Canada
-
2. Europe
- 2.1. Germany
- 2.2. United Kingdom
- 2.3. France
- 2.4. Rest of Europe
-
3. Asia Pacific
- 3.1. India
- 3.2. China
- 3.3. Japan
- 3.4. Rest of Asia Pacifc
- 4. Latin America
- 5. Middle East
Fluid Power Cylinder Market REPORT HIGHLIGHTS
| Aspects | Details |
|---|---|
| Study Period | 2019-2033 |
| Base Year | 2024 |
| Estimated Year | 2025 |
| Forecast Period | 2025-2033 |
| Historical Period | 2019-2024 |
| Growth Rate | CAGR of > 4.50% from 2019-2033 |
| Segmentation |
|
Table of Contents
- 1. Introduction
- 1.1. Research Scope
- 1.2. Market Segmentation
- 1.3. Research Methodology
- 1.4. Definitions and Assumptions
- 2. Executive Summary
- 2.1. Introduction
- 3. Market Dynamics
- 3.1. Introduction
- 3.2. Market Drivers
- 3.2.1. ; Increasing Demand for Material Handling Equipment
- 3.3. Market Restrains
- 3.3.1. ; High Cost of Maintenance of the Cylinders Over the Entire Lifespan
- 3.4. Market Trends
- 3.4.1. Hydraulic Cylinders to Hold Major Share
- 4. Market Factor Analysis
- 4.1. Porters Five Forces
- 4.2. Supply/Value Chain
- 4.3. PESTEL analysis
- 4.4. Market Entropy
- 4.5. Patent/Trademark Analysis
- 5. Global Fluid Power Cylinder Market Analysis, Insights and Forecast, 2019-2031
- 5.1. Market Analysis, Insights and Forecast - by Type
- 5.1.1. Hydraulic Cylinder
- 5.1.2. Pneumatic Cylinder
- 5.2. Market Analysis, Insights and Forecast - by End-user Industry
- 5.2.1. Hydraulic Cylinder
- 5.2.1.1. Construction
- 5.2.1.2. Agriculture
- 5.2.1.3. Material Handling
- 5.2.1.4. Aerospace & Defense
- 5.2.1.5. Machine Tools
- 5.2.1.6. Oil & Gas
- 5.2.1.7. Other End-user Industries
- 5.2.2. Pneumatic Cylinder
- 5.2.2.1. Food Processing & Packaging
- 5.2.2.2. Automotive
- 5.2.2.3. Material Handling & Assembly
- 5.2.2.4. Oil & Gas, Chemicals and Plastics
- 5.2.2.5. Semiconductor & Electronics
- 5.2.2.6. Life Sciences
- 5.2.1. Hydraulic Cylinder
- 5.3. Market Analysis, Insights and Forecast - by Region
- 5.3.1. North America
- 5.3.2. Europe
- 5.3.3. Asia Pacific
- 5.3.4. Latin America
- 5.3.5. Middle East
- 5.1. Market Analysis, Insights and Forecast - by Type
- 6. North America Fluid Power Cylinder Market Analysis, Insights and Forecast, 2019-2031
- 6.1. Market Analysis, Insights and Forecast - by Type
- 6.1.1. Hydraulic Cylinder
- 6.1.2. Pneumatic Cylinder
- 6.2. Market Analysis, Insights and Forecast - by End-user Industry
- 6.2.1. Hydraulic Cylinder
- 6.2.1.1. Construction
- 6.2.1.2. Agriculture
- 6.2.1.3. Material Handling
- 6.2.1.4. Aerospace & Defense
- 6.2.1.5. Machine Tools
- 6.2.1.6. Oil & Gas
- 6.2.1.7. Other End-user Industries
- 6.2.2. Pneumatic Cylinder
- 6.2.2.1. Food Processing & Packaging
- 6.2.2.2. Automotive
- 6.2.2.3. Material Handling & Assembly
- 6.2.2.4. Oil & Gas, Chemicals and Plastics
- 6.2.2.5. Semiconductor & Electronics
- 6.2.2.6. Life Sciences
- 6.2.1. Hydraulic Cylinder
- 6.1. Market Analysis, Insights and Forecast - by Type
- 7. Europe Fluid Power Cylinder Market Analysis, Insights and Forecast, 2019-2031
- 7.1. Market Analysis, Insights and Forecast - by Type
- 7.1.1. Hydraulic Cylinder
- 7.1.2. Pneumatic Cylinder
- 7.2. Market Analysis, Insights and Forecast - by End-user Industry
- 7.2.1. Hydraulic Cylinder
- 7.2.1.1. Construction
- 7.2.1.2. Agriculture
- 7.2.1.3. Material Handling
- 7.2.1.4. Aerospace & Defense
- 7.2.1.5. Machine Tools
- 7.2.1.6. Oil & Gas
- 7.2.1.7. Other End-user Industries
- 7.2.2. Pneumatic Cylinder
- 7.2.2.1. Food Processing & Packaging
- 7.2.2.2. Automotive
- 7.2.2.3. Material Handling & Assembly
- 7.2.2.4. Oil & Gas, Chemicals and Plastics
- 7.2.2.5. Semiconductor & Electronics
- 7.2.2.6. Life Sciences
- 7.2.1. Hydraulic Cylinder
- 7.1. Market Analysis, Insights and Forecast - by Type
- 8. Asia Pacific Fluid Power Cylinder Market Analysis, Insights and Forecast, 2019-2031
- 8.1. Market Analysis, Insights and Forecast - by Type
- 8.1.1. Hydraulic Cylinder
- 8.1.2. Pneumatic Cylinder
- 8.2. Market Analysis, Insights and Forecast - by End-user Industry
- 8.2.1. Hydraulic Cylinder
- 8.2.1.1. Construction
- 8.2.1.2. Agriculture
- 8.2.1.3. Material Handling
- 8.2.1.4. Aerospace & Defense
- 8.2.1.5. Machine Tools
- 8.2.1.6. Oil & Gas
- 8.2.1.7. Other End-user Industries
- 8.2.2. Pneumatic Cylinder
- 8.2.2.1. Food Processing & Packaging
- 8.2.2.2. Automotive
- 8.2.2.3. Material Handling & Assembly
- 8.2.2.4. Oil & Gas, Chemicals and Plastics
- 8.2.2.5. Semiconductor & Electronics
- 8.2.2.6. Life Sciences
- 8.2.1. Hydraulic Cylinder
- 8.1. Market Analysis, Insights and Forecast - by Type
- 9. Latin America Fluid Power Cylinder Market Analysis, Insights and Forecast, 2019-2031
- 9.1. Market Analysis, Insights and Forecast - by Type
- 9.1.1. Hydraulic Cylinder
- 9.1.2. Pneumatic Cylinder
- 9.2. Market Analysis, Insights and Forecast - by End-user Industry
- 9.2.1. Hydraulic Cylinder
- 9.2.1.1. Construction
- 9.2.1.2. Agriculture
- 9.2.1.3. Material Handling
- 9.2.1.4. Aerospace & Defense
- 9.2.1.5. Machine Tools
- 9.2.1.6. Oil & Gas
- 9.2.1.7. Other End-user Industries
- 9.2.2. Pneumatic Cylinder
- 9.2.2.1. Food Processing & Packaging
- 9.2.2.2. Automotive
- 9.2.2.3. Material Handling & Assembly
- 9.2.2.4. Oil & Gas, Chemicals and Plastics
- 9.2.2.5. Semiconductor & Electronics
- 9.2.2.6. Life Sciences
- 9.2.1. Hydraulic Cylinder
- 9.1. Market Analysis, Insights and Forecast - by Type
- 10. Middle East Fluid Power Cylinder Market Analysis, Insights and Forecast, 2019-2031
- 10.1. Market Analysis, Insights and Forecast - by Type
- 10.1.1. Hydraulic Cylinder
- 10.1.2. Pneumatic Cylinder
- 10.2. Market Analysis, Insights and Forecast - by End-user Industry
- 10.2.1. Hydraulic Cylinder
- 10.2.1.1. Construction
- 10.2.1.2. Agriculture
- 10.2.1.3. Material Handling
- 10.2.1.4. Aerospace & Defense
- 10.2.1.5. Machine Tools
- 10.2.1.6. Oil & Gas
- 10.2.1.7. Other End-user Industries
- 10.2.2. Pneumatic Cylinder
- 10.2.2.1. Food Processing & Packaging
- 10.2.2.2. Automotive
- 10.2.2.3. Material Handling & Assembly
- 10.2.2.4. Oil & Gas, Chemicals and Plastics
- 10.2.2.5. Semiconductor & Electronics
- 10.2.2.6. Life Sciences
- 10.2.1. Hydraulic Cylinder
- 10.1. Market Analysis, Insights and Forecast - by Type
- 11. North America Fluid Power Cylinder Market Analysis, Insights and Forecast, 2019-2031
- 11.1. Market Analysis, Insights and Forecast - By Country/Sub-region
- 11.1.1 United States
- 11.1.2 Canada
- 11.1.3 Mexico
- 12. Europe Fluid Power Cylinder Market Analysis, Insights and Forecast, 2019-2031
- 12.1. Market Analysis, Insights and Forecast - By Country/Sub-region
- 12.1.1 Germany
- 12.1.2 United Kingdom
- 12.1.3 France
- 12.1.4 Spain
- 12.1.5 Italy
- 12.1.6 Spain
- 12.1.7 Belgium
- 12.1.8 Netherland
- 12.1.9 Nordics
- 12.1.10 Rest of Europe
- 13. Asia Pacific Fluid Power Cylinder Market Analysis, Insights and Forecast, 2019-2031
- 13.1. Market Analysis, Insights and Forecast - By Country/Sub-region
- 13.1.1 China
- 13.1.2 Japan
- 13.1.3 India
- 13.1.4 South Korea
- 13.1.5 Southeast Asia
- 13.1.6 Australia
- 13.1.7 Indonesia
- 13.1.8 Phillipes
- 13.1.9 Singapore
- 13.1.10 Thailandc
- 13.1.11 Rest of Asia Pacific
- 14. South America Fluid Power Cylinder Market Analysis, Insights and Forecast, 2019-2031
- 14.1. Market Analysis, Insights and Forecast - By Country/Sub-region
- 14.1.1 Brazil
- 14.1.2 Argentina
- 14.1.3 Peru
- 14.1.4 Chile
- 14.1.5 Colombia
- 14.1.6 Ecuador
- 14.1.7 Venezuela
- 14.1.8 Rest of South America
- 15. North America Fluid Power Cylinder Market Analysis, Insights and Forecast, 2019-2031
- 15.1. Market Analysis, Insights and Forecast - By Country/Sub-region
- 15.1.1 United States
- 15.1.2 Canada
- 15.1.3 Mexico
- 16. MEA Fluid Power Cylinder Market Analysis, Insights and Forecast, 2019-2031
- 16.1. Market Analysis, Insights and Forecast - By Country/Sub-region
- 16.1.1 United Arab Emirates
- 16.1.2 Saudi Arabia
- 16.1.3 South Africa
- 16.1.4 Rest of Middle East and Africa
- 17. Competitive Analysis
- 17.1. Global Market Share Analysis 2024
- 17.2. Company Profiles
- 17.2.1 Pacoma GmbH
- 17.2.1.1. Overview
- 17.2.1.2. Products
- 17.2.1.3. SWOT Analysis
- 17.2.1.4. Recent Developments
- 17.2.1.5. Financials (Based on Availability)
- 17.2.2 Jiangsu Hengli Hydraulic Co Ltd
- 17.2.2.1. Overview
- 17.2.2.2. Products
- 17.2.2.3. SWOT Analysis
- 17.2.2.4. Recent Developments
- 17.2.2.5. Financials (Based on Availability)
- 17.2.3 SMC Corporation
- 17.2.3.1. Overview
- 17.2.3.2. Products
- 17.2.3.3. SWOT Analysis
- 17.2.3.4. Recent Developments
- 17.2.3.5. Financials (Based on Availability)
- 17.2.4 Bosch Rexroth Corporation
- 17.2.4.1. Overview
- 17.2.4.2. Products
- 17.2.4.3. SWOT Analysis
- 17.2.4.4. Recent Developments
- 17.2.4.5. Financials (Based on Availability)
- 17.2.5 HYDAC Verwaltung GmbH
- 17.2.5.1. Overview
- 17.2.5.2. Products
- 17.2.5.3. SWOT Analysis
- 17.2.5.4. Recent Developments
- 17.2.5.5. Financials (Based on Availability)
- 17.2.6 Eaton Corporation PLC
- 17.2.6.1. Overview
- 17.2.6.2. Products
- 17.2.6.3. SWOT Analysis
- 17.2.6.4. Recent Developments
- 17.2.6.5. Financials (Based on Availability)
- 17.2.7 Precision Hydraulic Cylinders Inc
- 17.2.7.1. Overview
- 17.2.7.2. Products
- 17.2.7.3. SWOT Analysis
- 17.2.7.4. Recent Developments
- 17.2.7.5. Financials (Based on Availability)
- 17.2.8 Festo SE & Co KG
- 17.2.8.1. Overview
- 17.2.8.2. Products
- 17.2.8.3. SWOT Analysis
- 17.2.8.4. Recent Developments
- 17.2.8.5. Financials (Based on Availability)
- 17.2.9 Danfoss A/S
- 17.2.9.1. Overview
- 17.2.9.2. Products
- 17.2.9.3. SWOT Analysis
- 17.2.9.4. Recent Developments
- 17.2.9.5. Financials (Based on Availability)
- 17.2.10 Parker Hannifin Corp
- 17.2.10.1. Overview
- 17.2.10.2. Products
- 17.2.10.3. SWOT Analysis
- 17.2.10.4. Recent Developments
- 17.2.10.5. Financials (Based on Availability)
- 17.2.1 Pacoma GmbH
List of Figures
- Figure 1: Global Fluid Power Cylinder Market Revenue Breakdown (Million, %) by Region 2024 & 2032
- Figure 2: Global Fluid Power Cylinder Market Volume Breakdown (K Unit, %) by Region 2024 & 2032
- Figure 3: North America Fluid Power Cylinder Market Revenue (Million), by Country 2024 & 2032
- Figure 4: North America Fluid Power Cylinder Market Volume (K Unit), by Country 2024 & 2032
- Figure 5: North America Fluid Power Cylinder Market Revenue Share (%), by Country 2024 & 2032
- Figure 6: North America Fluid Power Cylinder Market Volume Share (%), by Country 2024 & 2032
- Figure 7: Europe Fluid Power Cylinder Market Revenue (Million), by Country 2024 & 2032
- Figure 8: Europe Fluid Power Cylinder Market Volume (K Unit), by Country 2024 & 2032
- Figure 9: Europe Fluid Power Cylinder Market Revenue Share (%), by Country 2024 & 2032
- Figure 10: Europe Fluid Power Cylinder Market Volume Share (%), by Country 2024 & 2032
- Figure 11: Asia Pacific Fluid Power Cylinder Market Revenue (Million), by Country 2024 & 2032
- Figure 12: Asia Pacific Fluid Power Cylinder Market Volume (K Unit), by Country 2024 & 2032
- Figure 13: Asia Pacific Fluid Power Cylinder Market Revenue Share (%), by Country 2024 & 2032
- Figure 14: Asia Pacific Fluid Power Cylinder Market Volume Share (%), by Country 2024 & 2032
- Figure 15: South America Fluid Power Cylinder Market Revenue (Million), by Country 2024 & 2032
- Figure 16: South America Fluid Power Cylinder Market Volume (K Unit), by Country 2024 & 2032
- Figure 17: South America Fluid Power Cylinder Market Revenue Share (%), by Country 2024 & 2032
- Figure 18: South America Fluid Power Cylinder Market Volume Share (%), by Country 2024 & 2032
- Figure 19: North America Fluid Power Cylinder Market Revenue (Million), by Country 2024 & 2032
- Figure 20: North America Fluid Power Cylinder Market Volume (K Unit), by Country 2024 & 2032
- Figure 21: North America Fluid Power Cylinder Market Revenue Share (%), by Country 2024 & 2032
- Figure 22: North America Fluid Power Cylinder Market Volume Share (%), by Country 2024 & 2032
- Figure 23: MEA Fluid Power Cylinder Market Revenue (Million), by Country 2024 & 2032
- Figure 24: MEA Fluid Power Cylinder Market Volume (K Unit), by Country 2024 & 2032
- Figure 25: MEA Fluid Power Cylinder Market Revenue Share (%), by Country 2024 & 2032
- Figure 26: MEA Fluid Power Cylinder Market Volume Share (%), by Country 2024 & 2032
- Figure 27: North America Fluid Power Cylinder Market Revenue (Million), by Type 2024 & 2032
- Figure 28: North America Fluid Power Cylinder Market Volume (K Unit), by Type 2024 & 2032
- Figure 29: North America Fluid Power Cylinder Market Revenue Share (%), by Type 2024 & 2032
- Figure 30: North America Fluid Power Cylinder Market Volume Share (%), by Type 2024 & 2032
- Figure 31: North America Fluid Power Cylinder Market Revenue (Million), by End-user Industry 2024 & 2032
- Figure 32: North America Fluid Power Cylinder Market Volume (K Unit), by End-user Industry 2024 & 2032
- Figure 33: North America Fluid Power Cylinder Market Revenue Share (%), by End-user Industry 2024 & 2032
- Figure 34: North America Fluid Power Cylinder Market Volume Share (%), by End-user Industry 2024 & 2032
- Figure 35: North America Fluid Power Cylinder Market Revenue (Million), by Country 2024 & 2032
- Figure 36: North America Fluid Power Cylinder Market Volume (K Unit), by Country 2024 & 2032
- Figure 37: North America Fluid Power Cylinder Market Revenue Share (%), by Country 2024 & 2032
- Figure 38: North America Fluid Power Cylinder Market Volume Share (%), by Country 2024 & 2032
- Figure 39: Europe Fluid Power Cylinder Market Revenue (Million), by Type 2024 & 2032
- Figure 40: Europe Fluid Power Cylinder Market Volume (K Unit), by Type 2024 & 2032
- Figure 41: Europe Fluid Power Cylinder Market Revenue Share (%), by Type 2024 & 2032
- Figure 42: Europe Fluid Power Cylinder Market Volume Share (%), by Type 2024 & 2032
- Figure 43: Europe Fluid Power Cylinder Market Revenue (Million), by End-user Industry 2024 & 2032
- Figure 44: Europe Fluid Power Cylinder Market Volume (K Unit), by End-user Industry 2024 & 2032
- Figure 45: Europe Fluid Power Cylinder Market Revenue Share (%), by End-user Industry 2024 & 2032
- Figure 46: Europe Fluid Power Cylinder Market Volume Share (%), by End-user Industry 2024 & 2032
- Figure 47: Europe Fluid Power Cylinder Market Revenue (Million), by Country 2024 & 2032
- Figure 48: Europe Fluid Power Cylinder Market Volume (K Unit), by Country 2024 & 2032
- Figure 49: Europe Fluid Power Cylinder Market Revenue Share (%), by Country 2024 & 2032
- Figure 50: Europe Fluid Power Cylinder Market Volume Share (%), by Country 2024 & 2032
- Figure 51: Asia Pacific Fluid Power Cylinder Market Revenue (Million), by Type 2024 & 2032
- Figure 52: Asia Pacific Fluid Power Cylinder Market Volume (K Unit), by Type 2024 & 2032
- Figure 53: Asia Pacific Fluid Power Cylinder Market Revenue Share (%), by Type 2024 & 2032
- Figure 54: Asia Pacific Fluid Power Cylinder Market Volume Share (%), by Type 2024 & 2032
- Figure 55: Asia Pacific Fluid Power Cylinder Market Revenue (Million), by End-user Industry 2024 & 2032
- Figure 56: Asia Pacific Fluid Power Cylinder Market Volume (K Unit), by End-user Industry 2024 & 2032
- Figure 57: Asia Pacific Fluid Power Cylinder Market Revenue Share (%), by End-user Industry 2024 & 2032
- Figure 58: Asia Pacific Fluid Power Cylinder Market Volume Share (%), by End-user Industry 2024 & 2032
- Figure 59: Asia Pacific Fluid Power Cylinder Market Revenue (Million), by Country 2024 & 2032
- Figure 60: Asia Pacific Fluid Power Cylinder Market Volume (K Unit), by Country 2024 & 2032
- Figure 61: Asia Pacific Fluid Power Cylinder Market Revenue Share (%), by Country 2024 & 2032
- Figure 62: Asia Pacific Fluid Power Cylinder Market Volume Share (%), by Country 2024 & 2032
- Figure 63: Latin America Fluid Power Cylinder Market Revenue (Million), by Type 2024 & 2032
- Figure 64: Latin America Fluid Power Cylinder Market Volume (K Unit), by Type 2024 & 2032
- Figure 65: Latin America Fluid Power Cylinder Market Revenue Share (%), by Type 2024 & 2032
- Figure 66: Latin America Fluid Power Cylinder Market Volume Share (%), by Type 2024 & 2032
- Figure 67: Latin America Fluid Power Cylinder Market Revenue (Million), by End-user Industry 2024 & 2032
- Figure 68: Latin America Fluid Power Cylinder Market Volume (K Unit), by End-user Industry 2024 & 2032
- Figure 69: Latin America Fluid Power Cylinder Market Revenue Share (%), by End-user Industry 2024 & 2032
- Figure 70: Latin America Fluid Power Cylinder Market Volume Share (%), by End-user Industry 2024 & 2032
- Figure 71: Latin America Fluid Power Cylinder Market Revenue (Million), by Country 2024 & 2032
- Figure 72: Latin America Fluid Power Cylinder Market Volume (K Unit), by Country 2024 & 2032
- Figure 73: Latin America Fluid Power Cylinder Market Revenue Share (%), by Country 2024 & 2032
- Figure 74: Latin America Fluid Power Cylinder Market Volume Share (%), by Country 2024 & 2032
- Figure 75: Middle East Fluid Power Cylinder Market Revenue (Million), by Type 2024 & 2032
- Figure 76: Middle East Fluid Power Cylinder Market Volume (K Unit), by Type 2024 & 2032
- Figure 77: Middle East Fluid Power Cylinder Market Revenue Share (%), by Type 2024 & 2032
- Figure 78: Middle East Fluid Power Cylinder Market Volume Share (%), by Type 2024 & 2032
- Figure 79: Middle East Fluid Power Cylinder Market Revenue (Million), by End-user Industry 2024 & 2032
- Figure 80: Middle East Fluid Power Cylinder Market Volume (K Unit), by End-user Industry 2024 & 2032
- Figure 81: Middle East Fluid Power Cylinder Market Revenue Share (%), by End-user Industry 2024 & 2032
- Figure 82: Middle East Fluid Power Cylinder Market Volume Share (%), by End-user Industry 2024 & 2032
- Figure 83: Middle East Fluid Power Cylinder Market Revenue (Million), by Country 2024 & 2032
- Figure 84: Middle East Fluid Power Cylinder Market Volume (K Unit), by Country 2024 & 2032
- Figure 85: Middle East Fluid Power Cylinder Market Revenue Share (%), by Country 2024 & 2032
- Figure 86: Middle East Fluid Power Cylinder Market Volume Share (%), by Country 2024 & 2032
List of Tables
- Table 1: Global Fluid Power Cylinder Market Revenue Million Forecast, by Region 2019 & 2032
- Table 2: Global Fluid Power Cylinder Market Volume K Unit Forecast, by Region 2019 & 2032
- Table 3: Global Fluid Power Cylinder Market Revenue Million Forecast, by Type 2019 & 2032
- Table 4: Global Fluid Power Cylinder Market Volume K Unit Forecast, by Type 2019 & 2032
- Table 5: Global Fluid Power Cylinder Market Revenue Million Forecast, by End-user Industry 2019 & 2032
- Table 6: Global Fluid Power Cylinder Market Volume K Unit Forecast, by End-user Industry 2019 & 2032
- Table 7: Global Fluid Power Cylinder Market Revenue Million Forecast, by Region 2019 & 2032
- Table 8: Global Fluid Power Cylinder Market Volume K Unit Forecast, by Region 2019 & 2032
- Table 9: Global Fluid Power Cylinder Market Revenue Million Forecast, by Country 2019 & 2032
- Table 10: Global Fluid Power Cylinder Market Volume K Unit Forecast, by Country 2019 & 2032
- Table 11: United States Fluid Power Cylinder Market Revenue (Million) Forecast, by Application 2019 & 2032
- Table 12: United States Fluid Power Cylinder Market Volume (K Unit) Forecast, by Application 2019 & 2032
- Table 13: Canada Fluid Power Cylinder Market Revenue (Million) Forecast, by Application 2019 & 2032
- Table 14: Canada Fluid Power Cylinder Market Volume (K Unit) Forecast, by Application 2019 & 2032
- Table 15: Mexico Fluid Power Cylinder Market Revenue (Million) Forecast, by Application 2019 & 2032
- Table 16: Mexico Fluid Power Cylinder Market Volume (K Unit) Forecast, by Application 2019 & 2032
- Table 17: Global Fluid Power Cylinder Market Revenue Million Forecast, by Country 2019 & 2032
- Table 18: Global Fluid Power Cylinder Market Volume K Unit Forecast, by Country 2019 & 2032
- Table 19: Germany Fluid Power Cylinder Market Revenue (Million) Forecast, by Application 2019 & 2032
- Table 20: Germany Fluid Power Cylinder Market Volume (K Unit) Forecast, by Application 2019 & 2032
- Table 21: United Kingdom Fluid Power Cylinder Market Revenue (Million) Forecast, by Application 2019 & 2032
- Table 22: United Kingdom Fluid Power Cylinder Market Volume (K Unit) Forecast, by Application 2019 & 2032
- Table 23: France Fluid Power Cylinder Market Revenue (Million) Forecast, by Application 2019 & 2032
- Table 24: France Fluid Power Cylinder Market Volume (K Unit) Forecast, by Application 2019 & 2032
- Table 25: Spain Fluid Power Cylinder Market Revenue (Million) Forecast, by Application 2019 & 2032
- Table 26: Spain Fluid Power Cylinder Market Volume (K Unit) Forecast, by Application 2019 & 2032
- Table 27: Italy Fluid Power Cylinder Market Revenue (Million) Forecast, by Application 2019 & 2032
- Table 28: Italy Fluid Power Cylinder Market Volume (K Unit) Forecast, by Application 2019 & 2032
- Table 29: Spain Fluid Power Cylinder Market Revenue (Million) Forecast, by Application 2019 & 2032
- Table 30: Spain Fluid Power Cylinder Market Volume (K Unit) Forecast, by Application 2019 & 2032
- Table 31: Belgium Fluid Power Cylinder Market Revenue (Million) Forecast, by Application 2019 & 2032
- Table 32: Belgium Fluid Power Cylinder Market Volume (K Unit) Forecast, by Application 2019 & 2032
- Table 33: Netherland Fluid Power Cylinder Market Revenue (Million) Forecast, by Application 2019 & 2032
- Table 34: Netherland Fluid Power Cylinder Market Volume (K Unit) Forecast, by Application 2019 & 2032
- Table 35: Nordics Fluid Power Cylinder Market Revenue (Million) Forecast, by Application 2019 & 2032
- Table 36: Nordics Fluid Power Cylinder Market Volume (K Unit) Forecast, by Application 2019 & 2032
- Table 37: Rest of Europe Fluid Power Cylinder Market Revenue (Million) Forecast, by Application 2019 & 2032
- Table 38: Rest of Europe Fluid Power Cylinder Market Volume (K Unit) Forecast, by Application 2019 & 2032
- Table 39: Global Fluid Power Cylinder Market Revenue Million Forecast, by Country 2019 & 2032
- Table 40: Global Fluid Power Cylinder Market Volume K Unit Forecast, by Country 2019 & 2032
- Table 41: China Fluid Power Cylinder Market Revenue (Million) Forecast, by Application 2019 & 2032
- Table 42: China Fluid Power Cylinder Market Volume (K Unit) Forecast, by Application 2019 & 2032
- Table 43: Japan Fluid Power Cylinder Market Revenue (Million) Forecast, by Application 2019 & 2032
- Table 44: Japan Fluid Power Cylinder Market Volume (K Unit) Forecast, by Application 2019 & 2032
- Table 45: India Fluid Power Cylinder Market Revenue (Million) Forecast, by Application 2019 & 2032
- Table 46: India Fluid Power Cylinder Market Volume (K Unit) Forecast, by Application 2019 & 2032
- Table 47: South Korea Fluid Power Cylinder Market Revenue (Million) Forecast, by Application 2019 & 2032
- Table 48: South Korea Fluid Power Cylinder Market Volume (K Unit) Forecast, by Application 2019 & 2032
- Table 49: Southeast Asia Fluid Power Cylinder Market Revenue (Million) Forecast, by Application 2019 & 2032
- Table 50: Southeast Asia Fluid Power Cylinder Market Volume (K Unit) Forecast, by Application 2019 & 2032
- Table 51: Australia Fluid Power Cylinder Market Revenue (Million) Forecast, by Application 2019 & 2032
- Table 52: Australia Fluid Power Cylinder Market Volume (K Unit) Forecast, by Application 2019 & 2032
- Table 53: Indonesia Fluid Power Cylinder Market Revenue (Million) Forecast, by Application 2019 & 2032
- Table 54: Indonesia Fluid Power Cylinder Market Volume (K Unit) Forecast, by Application 2019 & 2032
- Table 55: Phillipes Fluid Power Cylinder Market Revenue (Million) Forecast, by Application 2019 & 2032
- Table 56: Phillipes Fluid Power Cylinder Market Volume (K Unit) Forecast, by Application 2019 & 2032
- Table 57: Singapore Fluid Power Cylinder Market Revenue (Million) Forecast, by Application 2019 & 2032
- Table 58: Singapore Fluid Power Cylinder Market Volume (K Unit) Forecast, by Application 2019 & 2032
- Table 59: Thailandc Fluid Power Cylinder Market Revenue (Million) Forecast, by Application 2019 & 2032
- Table 60: Thailandc Fluid Power Cylinder Market Volume (K Unit) Forecast, by Application 2019 & 2032
- Table 61: Rest of Asia Pacific Fluid Power Cylinder Market Revenue (Million) Forecast, by Application 2019 & 2032
- Table 62: Rest of Asia Pacific Fluid Power Cylinder Market Volume (K Unit) Forecast, by Application 2019 & 2032
- Table 63: Global Fluid Power Cylinder Market Revenue Million Forecast, by Country 2019 & 2032
- Table 64: Global Fluid Power Cylinder Market Volume K Unit Forecast, by Country 2019 & 2032
- Table 65: Brazil Fluid Power Cylinder Market Revenue (Million) Forecast, by Application 2019 & 2032
- Table 66: Brazil Fluid Power Cylinder Market Volume (K Unit) Forecast, by Application 2019 & 2032
- Table 67: Argentina Fluid Power Cylinder Market Revenue (Million) Forecast, by Application 2019 & 2032
- Table 68: Argentina Fluid Power Cylinder Market Volume (K Unit) Forecast, by Application 2019 & 2032
- Table 69: Peru Fluid Power Cylinder Market Revenue (Million) Forecast, by Application 2019 & 2032
- Table 70: Peru Fluid Power Cylinder Market Volume (K Unit) Forecast, by Application 2019 & 2032
- Table 71: Chile Fluid Power Cylinder Market Revenue (Million) Forecast, by Application 2019 & 2032
- Table 72: Chile Fluid Power Cylinder Market Volume (K Unit) Forecast, by Application 2019 & 2032
- Table 73: Colombia Fluid Power Cylinder Market Revenue (Million) Forecast, by Application 2019 & 2032
- Table 74: Colombia Fluid Power Cylinder Market Volume (K Unit) Forecast, by Application 2019 & 2032
- Table 75: Ecuador Fluid Power Cylinder Market Revenue (Million) Forecast, by Application 2019 & 2032
- Table 76: Ecuador Fluid Power Cylinder Market Volume (K Unit) Forecast, by Application 2019 & 2032
- Table 77: Venezuela Fluid Power Cylinder Market Revenue (Million) Forecast, by Application 2019 & 2032
- Table 78: Venezuela Fluid Power Cylinder Market Volume (K Unit) Forecast, by Application 2019 & 2032
- Table 79: Rest of South America Fluid Power Cylinder Market Revenue (Million) Forecast, by Application 2019 & 2032
- Table 80: Rest of South America Fluid Power Cylinder Market Volume (K Unit) Forecast, by Application 2019 & 2032
- Table 81: Global Fluid Power Cylinder Market Revenue Million Forecast, by Country 2019 & 2032
- Table 82: Global Fluid Power Cylinder Market Volume K Unit Forecast, by Country 2019 & 2032
- Table 83: United States Fluid Power Cylinder Market Revenue (Million) Forecast, by Application 2019 & 2032
- Table 84: United States Fluid Power Cylinder Market Volume (K Unit) Forecast, by Application 2019 & 2032
- Table 85: Canada Fluid Power Cylinder Market Revenue (Million) Forecast, by Application 2019 & 2032
- Table 86: Canada Fluid Power Cylinder Market Volume (K Unit) Forecast, by Application 2019 & 2032
- Table 87: Mexico Fluid Power Cylinder Market Revenue (Million) Forecast, by Application 2019 & 2032
- Table 88: Mexico Fluid Power Cylinder Market Volume (K Unit) Forecast, by Application 2019 & 2032
- Table 89: Global Fluid Power Cylinder Market Revenue Million Forecast, by Country 2019 & 2032
- Table 90: Global Fluid Power Cylinder Market Volume K Unit Forecast, by Country 2019 & 2032
- Table 91: United Arab Emirates Fluid Power Cylinder Market Revenue (Million) Forecast, by Application 2019 & 2032
- Table 92: United Arab Emirates Fluid Power Cylinder Market Volume (K Unit) Forecast, by Application 2019 & 2032
- Table 93: Saudi Arabia Fluid Power Cylinder Market Revenue (Million) Forecast, by Application 2019 & 2032
- Table 94: Saudi Arabia Fluid Power Cylinder Market Volume (K Unit) Forecast, by Application 2019 & 2032
- Table 95: South Africa Fluid Power Cylinder Market Revenue (Million) Forecast, by Application 2019 & 2032
- Table 96: South Africa Fluid Power Cylinder Market Volume (K Unit) Forecast, by Application 2019 & 2032
- Table 97: Rest of Middle East and Africa Fluid Power Cylinder Market Revenue (Million) Forecast, by Application 2019 & 2032
- Table 98: Rest of Middle East and Africa Fluid Power Cylinder Market Volume (K Unit) Forecast, by Application 2019 & 2032
- Table 99: Global Fluid Power Cylinder Market Revenue Million Forecast, by Type 2019 & 2032
- Table 100: Global Fluid Power Cylinder Market Volume K Unit Forecast, by Type 2019 & 2032
- Table 101: Global Fluid Power Cylinder Market Revenue Million Forecast, by End-user Industry 2019 & 2032
- Table 102: Global Fluid Power Cylinder Market Volume K Unit Forecast, by End-user Industry 2019 & 2032
- Table 103: Global Fluid Power Cylinder Market Revenue Million Forecast, by Country 2019 & 2032
- Table 104: Global Fluid Power Cylinder Market Volume K Unit Forecast, by Country 2019 & 2032
- Table 105: United States Fluid Power Cylinder Market Revenue (Million) Forecast, by Application 2019 & 2032
- Table 106: United States Fluid Power Cylinder Market Volume (K Unit) Forecast, by Application 2019 & 2032
- Table 107: Canada Fluid Power Cylinder Market Revenue (Million) Forecast, by Application 2019 & 2032
- Table 108: Canada Fluid Power Cylinder Market Volume (K Unit) Forecast, by Application 2019 & 2032
- Table 109: Global Fluid Power Cylinder Market Revenue Million Forecast, by Type 2019 & 2032
- Table 110: Global Fluid Power Cylinder Market Volume K Unit Forecast, by Type 2019 & 2032
- Table 111: Global Fluid Power Cylinder Market Revenue Million Forecast, by End-user Industry 2019 & 2032
- Table 112: Global Fluid Power Cylinder Market Volume K Unit Forecast, by End-user Industry 2019 & 2032
- Table 113: Global Fluid Power Cylinder Market Revenue Million Forecast, by Country 2019 & 2032
- Table 114: Global Fluid Power Cylinder Market Volume K Unit Forecast, by Country 2019 & 2032
- Table 115: Germany Fluid Power Cylinder Market Revenue (Million) Forecast, by Application 2019 & 2032
- Table 116: Germany Fluid Power Cylinder Market Volume (K Unit) Forecast, by Application 2019 & 2032
- Table 117: United Kingdom Fluid Power Cylinder Market Revenue (Million) Forecast, by Application 2019 & 2032
- Table 118: United Kingdom Fluid Power Cylinder Market Volume (K Unit) Forecast, by Application 2019 & 2032
- Table 119: France Fluid Power Cylinder Market Revenue (Million) Forecast, by Application 2019 & 2032
- Table 120: France Fluid Power Cylinder Market Volume (K Unit) Forecast, by Application 2019 & 2032
- Table 121: Rest of Europe Fluid Power Cylinder Market Revenue (Million) Forecast, by Application 2019 & 2032
- Table 122: Rest of Europe Fluid Power Cylinder Market Volume (K Unit) Forecast, by Application 2019 & 2032
- Table 123: Global Fluid Power Cylinder Market Revenue Million Forecast, by Type 2019 & 2032
- Table 124: Global Fluid Power Cylinder Market Volume K Unit Forecast, by Type 2019 & 2032
- Table 125: Global Fluid Power Cylinder Market Revenue Million Forecast, by End-user Industry 2019 & 2032
- Table 126: Global Fluid Power Cylinder Market Volume K Unit Forecast, by End-user Industry 2019 & 2032
- Table 127: Global Fluid Power Cylinder Market Revenue Million Forecast, by Country 2019 & 2032
- Table 128: Global Fluid Power Cylinder Market Volume K Unit Forecast, by Country 2019 & 2032
- Table 129: India Fluid Power Cylinder Market Revenue (Million) Forecast, by Application 2019 & 2032
- Table 130: India Fluid Power Cylinder Market Volume (K Unit) Forecast, by Application 2019 & 2032
- Table 131: China Fluid Power Cylinder Market Revenue (Million) Forecast, by Application 2019 & 2032
- Table 132: China Fluid Power Cylinder Market Volume (K Unit) Forecast, by Application 2019 & 2032
- Table 133: Japan Fluid Power Cylinder Market Revenue (Million) Forecast, by Application 2019 & 2032
- Table 134: Japan Fluid Power Cylinder Market Volume (K Unit) Forecast, by Application 2019 & 2032
- Table 135: Rest of Asia Pacifc Fluid Power Cylinder Market Revenue (Million) Forecast, by Application 2019 & 2032
- Table 136: Rest of Asia Pacifc Fluid Power Cylinder Market Volume (K Unit) Forecast, by Application 2019 & 2032
- Table 137: Global Fluid Power Cylinder Market Revenue Million Forecast, by Type 2019 & 2032
- Table 138: Global Fluid Power Cylinder Market Volume K Unit Forecast, by Type 2019 & 2032
- Table 139: Global Fluid Power Cylinder Market Revenue Million Forecast, by End-user Industry 2019 & 2032
- Table 140: Global Fluid Power Cylinder Market Volume K Unit Forecast, by End-user Industry 2019 & 2032
- Table 141: Global Fluid Power Cylinder Market Revenue Million Forecast, by Country 2019 & 2032
- Table 142: Global Fluid Power Cylinder Market Volume K Unit Forecast, by Country 2019 & 2032
- Table 143: Global Fluid Power Cylinder Market Revenue Million Forecast, by Type 2019 & 2032
- Table 144: Global Fluid Power Cylinder Market Volume K Unit Forecast, by Type 2019 & 2032
- Table 145: Global Fluid Power Cylinder Market Revenue Million Forecast, by End-user Industry 2019 & 2032
- Table 146: Global Fluid Power Cylinder Market Volume K Unit Forecast, by End-user Industry 2019 & 2032
- Table 147: Global Fluid Power Cylinder Market Revenue Million Forecast, by Country 2019 & 2032
- Table 148: Global Fluid Power Cylinder Market Volume K Unit Forecast, by Country 2019 & 2032
Frequently Asked Questions
1. What is the projected Compound Annual Growth Rate (CAGR) of the Fluid Power Cylinder Market?
The projected CAGR is approximately > 4.50%.
2. Which companies are prominent players in the Fluid Power Cylinder Market?
Key companies in the market include Pacoma GmbH, Jiangsu Hengli Hydraulic Co Ltd, SMC Corporation, Bosch Rexroth Corporation, HYDAC Verwaltung GmbH, Eaton Corporation PLC, Precision Hydraulic Cylinders Inc , Festo SE & Co KG, Danfoss A/S, Parker Hannifin Corp.
3. What are the main segments of the Fluid Power Cylinder Market?
The market segments include Type, End-user Industry.
4. Can you provide details about the market size?
The market size is estimated to be USD XX Million as of 2022.
5. What are some drivers contributing to market growth?
; Increasing Demand for Material Handling Equipment.
6. What are the notable trends driving market growth?
Hydraulic Cylinders to Hold Major Share.
7. Are there any restraints impacting market growth?
; High Cost of Maintenance of the Cylinders Over the Entire Lifespan.
8. Can you provide examples of recent developments in the market?
N/A
9. What pricing options are available for accessing the report?
Pricing options include single-user, multi-user, and enterprise licenses priced at USD 4750, USD 5250, and USD 8750 respectively.
10. Is the market size provided in terms of value or volume?
The market size is provided in terms of value, measured in Million and volume, measured in K Unit.
11. Are there any specific market keywords associated with the report?
Yes, the market keyword associated with the report is "Fluid Power Cylinder Market," which aids in identifying and referencing the specific market segment covered.
12. How do I determine which pricing option suits my needs best?
The pricing options vary based on user requirements and access needs. Individual users may opt for single-user licenses, while businesses requiring broader access may choose multi-user or enterprise licenses for cost-effective access to the report.
13. Are there any additional resources or data provided in the Fluid Power Cylinder Market report?
While the report offers comprehensive insights, it's advisable to review the specific contents or supplementary materials provided to ascertain if additional resources or data are available.
14. How can I stay updated on further developments or reports in the Fluid Power Cylinder Market?
To stay informed about further developments, trends, and reports in the Fluid Power Cylinder Market, consider subscribing to industry newsletters, following relevant companies and organizations, or regularly checking reputable industry news sources and publications.
Methodology
Step 1 - Identification of Relevant Samples Size from Population Database


Step 2 - Approaches for Defining Global Market Size (Value, Volume* & Price*)

Note*: In applicable scenarios
Step 3 - Data Sources
Primary Research
- Web Analytics
- Survey Reports
- Research Institute
- Latest Research Reports
- Opinion Leaders
Secondary Research
- Annual Reports
- White Paper
- Latest Press Release
- Industry Association
- Paid Database
- Investor Presentations

Step 4 - Data Triangulation
Involves using different sources of information in order to increase the validity of a study
These sources are likely to be stakeholders in a program - participants, other researchers, program staff, other community members, and so on.
Then we put all data in single framework & apply various statistical tools to find out the dynamic on the market.
During the analysis stage, feedback from the stakeholder groups would be compared to determine areas of agreement as well as areas of divergence


