
Key Insights
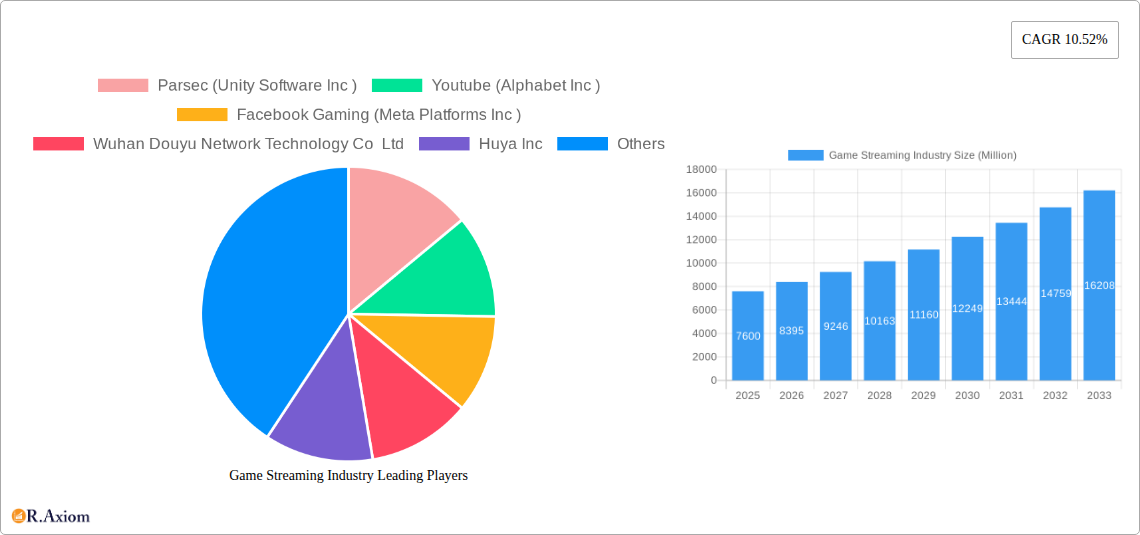
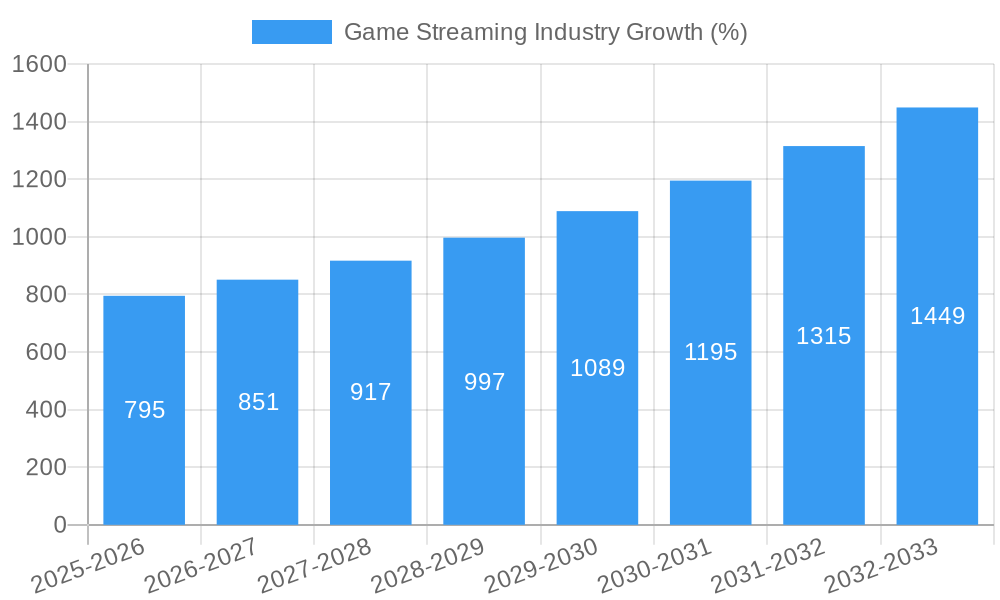
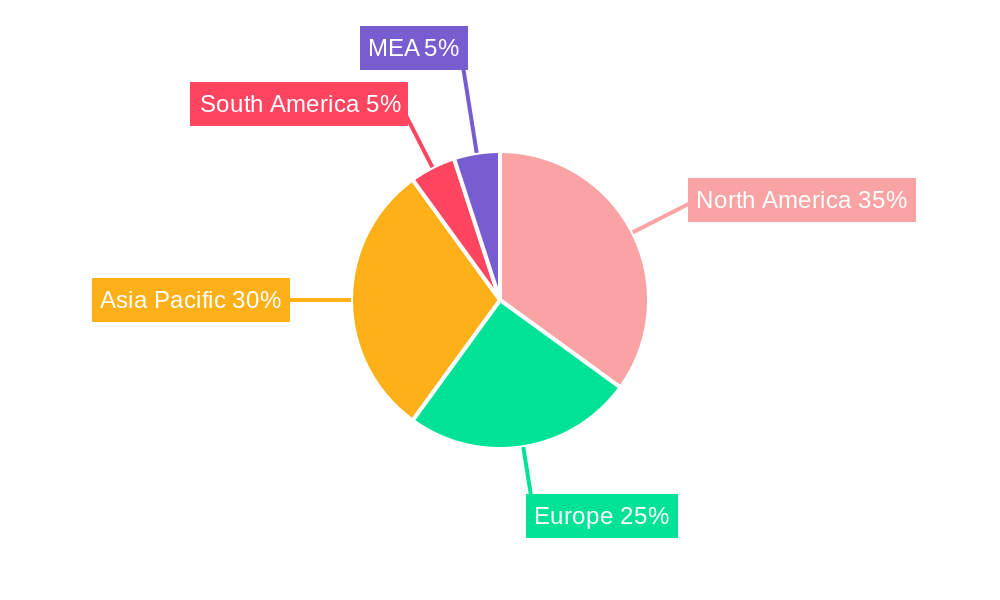
The global game streaming market, valued at $7.60 billion in 2025, is experiencing robust growth, projected to expand at a Compound Annual Growth Rate (CAGR) of 10.52% from 2025 to 2033. This expansion is fueled by several key drivers. The increasing popularity of esports and competitive gaming creates a significant demand for high-quality streaming platforms. Furthermore, advancements in technology, particularly in 5G network infrastructure and cloud computing capabilities, are enabling smoother, higher-resolution streaming experiences, attracting a broader audience. The rise of mobile gaming and the convenience of accessing games on various devices, from smartphones to smart TVs, are also contributing factors. The market is segmented by revenue model (in-game advertising, subscription, and others) and solution type (web-based and app-based). The in-game advertising model currently dominates, but subscription models are witnessing rapid growth as users seek ad-free experiences and access to premium content. The competitive landscape is marked by major players like Google (YouTube Gaming), Meta (Facebook Gaming), Amazon, and established game developers like Unity (through Parsec). These companies are constantly innovating, investing in improved streaming technologies, and expanding their content libraries to maintain their market share. Regional growth varies, with North America and Asia-Pacific currently leading the market, driven by high internet penetration and a large gaming enthusiast base. However, emerging markets in regions like South America and the Middle East and Africa exhibit significant growth potential due to increasing smartphone adoption and internet access.
The continued expansion of the game streaming market is anticipated to be influenced by factors such as the development of new streaming technologies offering better video quality and reduced latency, and the integration of virtual reality (VR) and augmented reality (AR) into game streaming experiences. However, challenges remain, including the need for consistently high-bandwidth internet connections to support high-quality streaming, and the ongoing need to address issues of piracy and copyright infringement. Addressing these challenges through technological innovations and robust content protection measures will be crucial for sustained market growth. The strategic partnerships between game developers, streaming platforms, and hardware manufacturers will be instrumental in shaping the future of the industry, leading to further innovation and expansion in the coming years.
This comprehensive report provides a detailed analysis of the global game streaming industry, covering market size, segmentation, key players, growth drivers, challenges, and future outlook. The study period spans from 2019 to 2033, with 2025 as the base and estimated year. The report offers actionable insights for industry stakeholders, including investors, technology providers, game developers, and platform operators. The market is valued at xx Million in 2025 and is projected to reach xx Million by 2033, exhibiting a CAGR of xx% during the forecast period (2025-2033).
Game Streaming Industry Market Concentration & Innovation
The game streaming market exhibits a moderately concentrated landscape, with several major players holding significant market share. However, the industry is also characterized by significant innovation, driven by advancements in cloud computing, 5G technology, and improved streaming capabilities. Key players such as Youtube (Alphabet Inc.), Facebook Gaming (Meta Platforms Inc.), and Amazon.com Inc. compete fiercely, leading to continuous innovation in streaming quality, accessibility, and content offerings. The market share of the top 5 players in 2025 is estimated at xx%, with the remaining market share distributed among numerous smaller players and niche providers.
Mergers and acquisitions (M&A) activity plays a crucial role in shaping market dynamics. In recent years, we have observed several significant M&A deals, with deal values ranging from xx Million to xx Million. These activities indicate consolidation and expansion strategies by major players to enhance their market positioning and technological capabilities. Regulatory frameworks vary across regions, impacting market access and compliance requirements for streaming platforms. The increasing popularity of game streaming has led to the emergence of product substitutes, such as local game downloads and physical game consoles. End-user trends, including preferences for high-quality streaming, cross-platform compatibility, and social features, are shaping product development and market competition.
Game Streaming Industry Industry Trends & Insights
The game streaming market is experiencing robust growth, propelled by several key factors. The increasing penetration of high-speed internet globally, coupled with the rising affordability of smart devices, has broadened the user base for game streaming services. Technological advancements, such as the deployment of 5G networks and improved cloud infrastructure, are contributing to enhanced streaming quality and reduced latency. Consumer preferences are shifting towards on-demand access to games, eliminating the need for high-end gaming PCs or consoles. This trend, along with the growing popularity of esports and live streaming, fuels the market’s expansion. The competitive landscape is characterized by intense rivalry among established players and emerging entrants. These factors collectively contribute to a high market growth rate. Market penetration in developed regions is already significant, while emerging markets offer significant potential for future expansion.
Dominant Markets & Segments in Game Streaming Industry
Leading Region/Country: North America currently dominates the game streaming market, driven by high internet penetration, strong gaming culture, and a large consumer base with high disposable income. Asia is also a rapidly expanding market, particularly in China and South Korea, due to significant growth in mobile gaming and the emergence of strong domestic players.
By Revenue Model:
- Subscription Model: This segment holds the largest market share, propelled by the recurring revenue stream and consumer preference for consistent access to a wide range of games.
- In-game Advertising Model: This model is growing steadily, offering opportunities for monetization through targeted ads to engaged gamers.
- Other Revenue Models: This segment includes revenue generated through virtual goods, in-app purchases, and partnerships.
By Solution:
- Web-Based: This segment has a large market share due to its convenience and accessibility across various devices.
- App-Based: This segment is showing strong growth, driven by the increasing popularity of mobile gaming and dedicated app experiences.
Key drivers for market dominance include favorable economic policies, robust digital infrastructure (broadband penetration and 5G rollout), and a strong gaming ecosystem comprising game developers, publishers, and esports organizations.
Game Streaming Industry Product Developments
Recent advancements in game streaming technology focus on improving streaming quality (higher resolutions, lower latency), expanding game libraries, and integrating social features. Cloud-based game streaming platforms are continuously enhancing their services to offer better performance and broader compatibility across devices. The market is witnessing increased adoption of AI-powered features that enhance user experiences and improve game discovery. The integration of virtual reality (VR) and augmented reality (AR) technologies is adding new dimensions to the gaming experience, boosting adoption among enthusiasts.
Report Scope & Segmentation Analysis
This report segments the game streaming market by revenue model (in-game advertising, subscription, other) and solution (web-based, app-based). Each segment is analyzed based on market size, growth projections, and competitive dynamics. The subscription model segment is anticipated to register significant growth, driven by the growing preference for convenient access to a wide range of games. The in-game advertising model is expected to experience moderate growth, and other revenue models will contribute to overall market expansion. Within the solutions segment, the web-based segment holds a larger share, while the app-based segment shows strong growth potential.
Key Drivers of Game Streaming Industry Growth
The game streaming industry is experiencing significant growth due to several factors: the proliferation of high-speed internet access, advancements in cloud computing and 5G technologies, the rising popularity of mobile gaming and esports, and increasing consumer demand for convenient and affordable gaming experiences. The development of new, engaging game content and improved streaming technology further fuels market expansion.
Challenges in the Game Streaming Industry Sector
Challenges include maintaining low latency and high-quality streaming, managing bandwidth costs, addressing regulatory issues regarding data privacy and security, and navigating intense competition from established players and new entrants. The dependence on stable internet infrastructure and potential limitations in accessibility in some regions also pose challenges.
Emerging Opportunities in Game Streaming Industry
Opportunities exist in expanding into untapped markets, developing innovative streaming technologies (e.g., AI-powered features, VR/AR integration), offering personalized gaming experiences, and creating new revenue models. The integration of cloud gaming into various devices (smart TVs, set-top boxes) presents a significant avenue for growth.
Leading Players in the Game Streaming Industry Market
- Parsec (Unity Software Inc)
- Youtube (Alphabet Inc)
- Facebook Gaming (Meta Platforms Inc)
- Wuhan Douyu Network Technology Co Ltd
- Huya Inc
- Amazon.com Inc
- Nvidia Corporation
- Sony Group Corporation
- Apple Inc
- Afreecatv Co Ltd
Key Developments in Game Streaming Industry Industry
November 2023: Sony partnered with NCSoft to expand its mobile game offerings, broadening its reach beyond consoles. This strategic move signals an intent to capture a larger share of the mobile gaming market and diversify revenue streams.
August 2023: GeForce NOW launched the Ultimate KovvaK's challenge, a promotional campaign designed to attract new users and enhance user engagement. This demonstrates a focus on user experience and community building.
Strategic Outlook for Game Streaming Industry Market
The game streaming market is poised for continued expansion, driven by technological advancements, increasing internet penetration, and the evolving preferences of gamers. New technologies such as AI and VR/AR will shape the future landscape, offering immersive and personalized gaming experiences. The focus will shift towards enhancing streaming quality, providing seamless cross-platform compatibility, and developing innovative business models to maximize profitability. The market's future is bright, with substantial growth potential in both developed and emerging markets.
Game Streaming Industry Segmentation
-
1. Revenue Model
- 1.1. In-game Advertising Model
- 1.2. Subscription Model
- 1.3. Other Revenue Models
-
2. Solutions
-
2.1. Web Based
- 2.1.1. Twitch
- 2.1.2. YouTube
- 2.1.3. Mixer
- 2.1.4. Facebook
- 2.1.5. Dailymotion
-
2.2. App Based
- 2.2.1. Xbox Game Streaming
- 2.2.2. Remotr
- 2.2.3. Steam Link
- 2.2.4. Rainway Inc
- 2.2.5. Others
-
2.1. Web Based
Game Streaming Industry Segmentation By Geography
-
1. North America
- 1.1. United States
- 1.2. Canada
-
2. Europe
- 2.1. Germany
- 2.2. United Kingdom
-
3. Asia Pacific
- 3.1. China
- 3.2. Japan
- 3.3. India
- 3.4. South Korea
- 3.5. Australia and New Zealand
- 4. Latin America
- 5. Middle East and Africa
Game Streaming Industry REPORT HIGHLIGHTS
| Aspects | Details |
|---|---|
| Study Period | 2019-2033 |
| Base Year | 2024 |
| Estimated Year | 2025 |
| Forecast Period | 2025-2033 |
| Historical Period | 2019-2024 |
| Growth Rate | CAGR of 10.52% from 2019-2033 |
| Segmentation |
|
Table of Contents
- 1. Introduction
- 1.1. Research Scope
- 1.2. Market Segmentation
- 1.3. Research Methodology
- 1.4. Definitions and Assumptions
- 2. Executive Summary
- 2.1. Introduction
- 3. Market Dynamics
- 3.1. Introduction
- 3.2. Market Drivers
- 3.2.1. Growing Popularity of Esports and Broadcasting of Esports Events; Growth of Video Game Streaming Software for Mobile Devices
- 3.3. Market Restrains
- 3.3.1. High Cost of Content Creation
- 3.4. Market Trends
- 3.4.1. YouTube to be the Largest Web-based Solution
- 4. Market Factor Analysis
- 4.1. Porters Five Forces
- 4.2. Supply/Value Chain
- 4.3. PESTEL analysis
- 4.4. Market Entropy
- 4.5. Patent/Trademark Analysis
- 5. Global Game Streaming Industry Analysis, Insights and Forecast, 2019-2031
- 5.1. Market Analysis, Insights and Forecast - by Revenue Model
- 5.1.1. In-game Advertising Model
- 5.1.2. Subscription Model
- 5.1.3. Other Revenue Models
- 5.2. Market Analysis, Insights and Forecast - by Solutions
- 5.2.1. Web Based
- 5.2.1.1. Twitch
- 5.2.1.2. YouTube
- 5.2.1.3. Mixer
- 5.2.1.4. Facebook
- 5.2.1.5. Dailymotion
- 5.2.2. App Based
- 5.2.2.1. Xbox Game Streaming
- 5.2.2.2. Remotr
- 5.2.2.3. Steam Link
- 5.2.2.4. Rainway Inc
- 5.2.2.5. Others
- 5.2.1. Web Based
- 5.3. Market Analysis, Insights and Forecast - by Region
- 5.3.1. North America
- 5.3.2. Europe
- 5.3.3. Asia Pacific
- 5.3.4. Latin America
- 5.3.5. Middle East and Africa
- 5.1. Market Analysis, Insights and Forecast - by Revenue Model
- 6. North America Game Streaming Industry Analysis, Insights and Forecast, 2019-2031
- 6.1. Market Analysis, Insights and Forecast - by Revenue Model
- 6.1.1. In-game Advertising Model
- 6.1.2. Subscription Model
- 6.1.3. Other Revenue Models
- 6.2. Market Analysis, Insights and Forecast - by Solutions
- 6.2.1. Web Based
- 6.2.1.1. Twitch
- 6.2.1.2. YouTube
- 6.2.1.3. Mixer
- 6.2.1.4. Facebook
- 6.2.1.5. Dailymotion
- 6.2.2. App Based
- 6.2.2.1. Xbox Game Streaming
- 6.2.2.2. Remotr
- 6.2.2.3. Steam Link
- 6.2.2.4. Rainway Inc
- 6.2.2.5. Others
- 6.2.1. Web Based
- 6.1. Market Analysis, Insights and Forecast - by Revenue Model
- 7. Europe Game Streaming Industry Analysis, Insights and Forecast, 2019-2031
- 7.1. Market Analysis, Insights and Forecast - by Revenue Model
- 7.1.1. In-game Advertising Model
- 7.1.2. Subscription Model
- 7.1.3. Other Revenue Models
- 7.2. Market Analysis, Insights and Forecast - by Solutions
- 7.2.1. Web Based
- 7.2.1.1. Twitch
- 7.2.1.2. YouTube
- 7.2.1.3. Mixer
- 7.2.1.4. Facebook
- 7.2.1.5. Dailymotion
- 7.2.2. App Based
- 7.2.2.1. Xbox Game Streaming
- 7.2.2.2. Remotr
- 7.2.2.3. Steam Link
- 7.2.2.4. Rainway Inc
- 7.2.2.5. Others
- 7.2.1. Web Based
- 7.1. Market Analysis, Insights and Forecast - by Revenue Model
- 8. Asia Pacific Game Streaming Industry Analysis, Insights and Forecast, 2019-2031
- 8.1. Market Analysis, Insights and Forecast - by Revenue Model
- 8.1.1. In-game Advertising Model
- 8.1.2. Subscription Model
- 8.1.3. Other Revenue Models
- 8.2. Market Analysis, Insights and Forecast - by Solutions
- 8.2.1. Web Based
- 8.2.1.1. Twitch
- 8.2.1.2. YouTube
- 8.2.1.3. Mixer
- 8.2.1.4. Facebook
- 8.2.1.5. Dailymotion
- 8.2.2. App Based
- 8.2.2.1. Xbox Game Streaming
- 8.2.2.2. Remotr
- 8.2.2.3. Steam Link
- 8.2.2.4. Rainway Inc
- 8.2.2.5. Others
- 8.2.1. Web Based
- 8.1. Market Analysis, Insights and Forecast - by Revenue Model
- 9. Latin America Game Streaming Industry Analysis, Insights and Forecast, 2019-2031
- 9.1. Market Analysis, Insights and Forecast - by Revenue Model
- 9.1.1. In-game Advertising Model
- 9.1.2. Subscription Model
- 9.1.3. Other Revenue Models
- 9.2. Market Analysis, Insights and Forecast - by Solutions
- 9.2.1. Web Based
- 9.2.1.1. Twitch
- 9.2.1.2. YouTube
- 9.2.1.3. Mixer
- 9.2.1.4. Facebook
- 9.2.1.5. Dailymotion
- 9.2.2. App Based
- 9.2.2.1. Xbox Game Streaming
- 9.2.2.2. Remotr
- 9.2.2.3. Steam Link
- 9.2.2.4. Rainway Inc
- 9.2.2.5. Others
- 9.2.1. Web Based
- 9.1. Market Analysis, Insights and Forecast - by Revenue Model
- 10. Middle East and Africa Game Streaming Industry Analysis, Insights and Forecast, 2019-2031
- 10.1. Market Analysis, Insights and Forecast - by Revenue Model
- 10.1.1. In-game Advertising Model
- 10.1.2. Subscription Model
- 10.1.3. Other Revenue Models
- 10.2. Market Analysis, Insights and Forecast - by Solutions
- 10.2.1. Web Based
- 10.2.1.1. Twitch
- 10.2.1.2. YouTube
- 10.2.1.3. Mixer
- 10.2.1.4. Facebook
- 10.2.1.5. Dailymotion
- 10.2.2. App Based
- 10.2.2.1. Xbox Game Streaming
- 10.2.2.2. Remotr
- 10.2.2.3. Steam Link
- 10.2.2.4. Rainway Inc
- 10.2.2.5. Others
- 10.2.1. Web Based
- 10.1. Market Analysis, Insights and Forecast - by Revenue Model
- 11. North America Game Streaming Industry Analysis, Insights and Forecast, 2019-2031
- 11.1. Market Analysis, Insights and Forecast - By Country/Sub-region
- 11.1.1 United States
- 11.1.2 Canada
- 11.1.3 Mexico
- 12. Europe Game Streaming Industry Analysis, Insights and Forecast, 2019-2031
- 12.1. Market Analysis, Insights and Forecast - By Country/Sub-region
- 12.1.1 Germany
- 12.1.2 United Kingdom
- 12.1.3 France
- 12.1.4 Spain
- 12.1.5 Italy
- 12.1.6 Spain
- 12.1.7 Belgium
- 12.1.8 Netherland
- 12.1.9 Nordics
- 12.1.10 Rest of Europe
- 13. Asia Pacific Game Streaming Industry Analysis, Insights and Forecast, 2019-2031
- 13.1. Market Analysis, Insights and Forecast - By Country/Sub-region
- 13.1.1 China
- 13.1.2 Japan
- 13.1.3 India
- 13.1.4 South Korea
- 13.1.5 Southeast Asia
- 13.1.6 Australia
- 13.1.7 Indonesia
- 13.1.8 Phillipes
- 13.1.9 Singapore
- 13.1.10 Thailandc
- 13.1.11 Rest of Asia Pacific
- 14. South America Game Streaming Industry Analysis, Insights and Forecast, 2019-2031
- 14.1. Market Analysis, Insights and Forecast - By Country/Sub-region
- 14.1.1 Brazil
- 14.1.2 Argentina
- 14.1.3 Peru
- 14.1.4 Chile
- 14.1.5 Colombia
- 14.1.6 Ecuador
- 14.1.7 Venezuela
- 14.1.8 Rest of South America
- 15. North America Game Streaming Industry Analysis, Insights and Forecast, 2019-2031
- 15.1. Market Analysis, Insights and Forecast - By Country/Sub-region
- 15.1.1 United States
- 15.1.2 Canada
- 15.1.3 Mexico
- 16. MEA Game Streaming Industry Analysis, Insights and Forecast, 2019-2031
- 16.1. Market Analysis, Insights and Forecast - By Country/Sub-region
- 16.1.1 United Arab Emirates
- 16.1.2 Saudi Arabia
- 16.1.3 South Africa
- 16.1.4 Rest of Middle East and Africa
- 17. Competitive Analysis
- 17.1. Global Market Share Analysis 2024
- 17.2. Company Profiles
- 17.2.1 Parsec (Unity Software Inc )
- 17.2.1.1. Overview
- 17.2.1.2. Products
- 17.2.1.3. SWOT Analysis
- 17.2.1.4. Recent Developments
- 17.2.1.5. Financials (Based on Availability)
- 17.2.2 Youtube (Alphabet Inc )
- 17.2.2.1. Overview
- 17.2.2.2. Products
- 17.2.2.3. SWOT Analysis
- 17.2.2.4. Recent Developments
- 17.2.2.5. Financials (Based on Availability)
- 17.2.3 Facebook Gaming (Meta Platforms Inc )
- 17.2.3.1. Overview
- 17.2.3.2. Products
- 17.2.3.3. SWOT Analysis
- 17.2.3.4. Recent Developments
- 17.2.3.5. Financials (Based on Availability)
- 17.2.4 Wuhan Douyu Network Technology Co Ltd
- 17.2.4.1. Overview
- 17.2.4.2. Products
- 17.2.4.3. SWOT Analysis
- 17.2.4.4. Recent Developments
- 17.2.4.5. Financials (Based on Availability)
- 17.2.5 Huya Inc
- 17.2.5.1. Overview
- 17.2.5.2. Products
- 17.2.5.3. SWOT Analysis
- 17.2.5.4. Recent Developments
- 17.2.5.5. Financials (Based on Availability)
- 17.2.6 Amazon com Inc
- 17.2.6.1. Overview
- 17.2.6.2. Products
- 17.2.6.3. SWOT Analysis
- 17.2.6.4. Recent Developments
- 17.2.6.5. Financials (Based on Availability)
- 17.2.7 Nvidia Corporation
- 17.2.7.1. Overview
- 17.2.7.2. Products
- 17.2.7.3. SWOT Analysis
- 17.2.7.4. Recent Developments
- 17.2.7.5. Financials (Based on Availability)
- 17.2.8 Sony Group Corporatio
- 17.2.8.1. Overview
- 17.2.8.2. Products
- 17.2.8.3. SWOT Analysis
- 17.2.8.4. Recent Developments
- 17.2.8.5. Financials (Based on Availability)
- 17.2.9 Apple Inc
- 17.2.9.1. Overview
- 17.2.9.2. Products
- 17.2.9.3. SWOT Analysis
- 17.2.9.4. Recent Developments
- 17.2.9.5. Financials (Based on Availability)
- 17.2.10 Afreecatv Co Ltd
- 17.2.10.1. Overview
- 17.2.10.2. Products
- 17.2.10.3. SWOT Analysis
- 17.2.10.4. Recent Developments
- 17.2.10.5. Financials (Based on Availability)
- 17.2.1 Parsec (Unity Software Inc )
List of Figures
- Figure 1: Global Game Streaming Industry Revenue Breakdown (Million, %) by Region 2024 & 2032
- Figure 2: Global Game Streaming Industry Volume Breakdown (K Unit, %) by Region 2024 & 2032
- Figure 3: North America Game Streaming Industry Revenue (Million), by Country 2024 & 2032
- Figure 4: North America Game Streaming Industry Volume (K Unit), by Country 2024 & 2032
- Figure 5: North America Game Streaming Industry Revenue Share (%), by Country 2024 & 2032
- Figure 6: North America Game Streaming Industry Volume Share (%), by Country 2024 & 2032
- Figure 7: Europe Game Streaming Industry Revenue (Million), by Country 2024 & 2032
- Figure 8: Europe Game Streaming Industry Volume (K Unit), by Country 2024 & 2032
- Figure 9: Europe Game Streaming Industry Revenue Share (%), by Country 2024 & 2032
- Figure 10: Europe Game Streaming Industry Volume Share (%), by Country 2024 & 2032
- Figure 11: Asia Pacific Game Streaming Industry Revenue (Million), by Country 2024 & 2032
- Figure 12: Asia Pacific Game Streaming Industry Volume (K Unit), by Country 2024 & 2032
- Figure 13: Asia Pacific Game Streaming Industry Revenue Share (%), by Country 2024 & 2032
- Figure 14: Asia Pacific Game Streaming Industry Volume Share (%), by Country 2024 & 2032
- Figure 15: South America Game Streaming Industry Revenue (Million), by Country 2024 & 2032
- Figure 16: South America Game Streaming Industry Volume (K Unit), by Country 2024 & 2032
- Figure 17: South America Game Streaming Industry Revenue Share (%), by Country 2024 & 2032
- Figure 18: South America Game Streaming Industry Volume Share (%), by Country 2024 & 2032
- Figure 19: North America Game Streaming Industry Revenue (Million), by Country 2024 & 2032
- Figure 20: North America Game Streaming Industry Volume (K Unit), by Country 2024 & 2032
- Figure 21: North America Game Streaming Industry Revenue Share (%), by Country 2024 & 2032
- Figure 22: North America Game Streaming Industry Volume Share (%), by Country 2024 & 2032
- Figure 23: MEA Game Streaming Industry Revenue (Million), by Country 2024 & 2032
- Figure 24: MEA Game Streaming Industry Volume (K Unit), by Country 2024 & 2032
- Figure 25: MEA Game Streaming Industry Revenue Share (%), by Country 2024 & 2032
- Figure 26: MEA Game Streaming Industry Volume Share (%), by Country 2024 & 2032
- Figure 27: North America Game Streaming Industry Revenue (Million), by Revenue Model 2024 & 2032
- Figure 28: North America Game Streaming Industry Volume (K Unit), by Revenue Model 2024 & 2032
- Figure 29: North America Game Streaming Industry Revenue Share (%), by Revenue Model 2024 & 2032
- Figure 30: North America Game Streaming Industry Volume Share (%), by Revenue Model 2024 & 2032
- Figure 31: North America Game Streaming Industry Revenue (Million), by Solutions 2024 & 2032
- Figure 32: North America Game Streaming Industry Volume (K Unit), by Solutions 2024 & 2032
- Figure 33: North America Game Streaming Industry Revenue Share (%), by Solutions 2024 & 2032
- Figure 34: North America Game Streaming Industry Volume Share (%), by Solutions 2024 & 2032
- Figure 35: North America Game Streaming Industry Revenue (Million), by Country 2024 & 2032
- Figure 36: North America Game Streaming Industry Volume (K Unit), by Country 2024 & 2032
- Figure 37: North America Game Streaming Industry Revenue Share (%), by Country 2024 & 2032
- Figure 38: North America Game Streaming Industry Volume Share (%), by Country 2024 & 2032
- Figure 39: Europe Game Streaming Industry Revenue (Million), by Revenue Model 2024 & 2032
- Figure 40: Europe Game Streaming Industry Volume (K Unit), by Revenue Model 2024 & 2032
- Figure 41: Europe Game Streaming Industry Revenue Share (%), by Revenue Model 2024 & 2032
- Figure 42: Europe Game Streaming Industry Volume Share (%), by Revenue Model 2024 & 2032
- Figure 43: Europe Game Streaming Industry Revenue (Million), by Solutions 2024 & 2032
- Figure 44: Europe Game Streaming Industry Volume (K Unit), by Solutions 2024 & 2032
- Figure 45: Europe Game Streaming Industry Revenue Share (%), by Solutions 2024 & 2032
- Figure 46: Europe Game Streaming Industry Volume Share (%), by Solutions 2024 & 2032
- Figure 47: Europe Game Streaming Industry Revenue (Million), by Country 2024 & 2032
- Figure 48: Europe Game Streaming Industry Volume (K Unit), by Country 2024 & 2032
- Figure 49: Europe Game Streaming Industry Revenue Share (%), by Country 2024 & 2032
- Figure 50: Europe Game Streaming Industry Volume Share (%), by Country 2024 & 2032
- Figure 51: Asia Pacific Game Streaming Industry Revenue (Million), by Revenue Model 2024 & 2032
- Figure 52: Asia Pacific Game Streaming Industry Volume (K Unit), by Revenue Model 2024 & 2032
- Figure 53: Asia Pacific Game Streaming Industry Revenue Share (%), by Revenue Model 2024 & 2032
- Figure 54: Asia Pacific Game Streaming Industry Volume Share (%), by Revenue Model 2024 & 2032
- Figure 55: Asia Pacific Game Streaming Industry Revenue (Million), by Solutions 2024 & 2032
- Figure 56: Asia Pacific Game Streaming Industry Volume (K Unit), by Solutions 2024 & 2032
- Figure 57: Asia Pacific Game Streaming Industry Revenue Share (%), by Solutions 2024 & 2032
- Figure 58: Asia Pacific Game Streaming Industry Volume Share (%), by Solutions 2024 & 2032
- Figure 59: Asia Pacific Game Streaming Industry Revenue (Million), by Country 2024 & 2032
- Figure 60: Asia Pacific Game Streaming Industry Volume (K Unit), by Country 2024 & 2032
- Figure 61: Asia Pacific Game Streaming Industry Revenue Share (%), by Country 2024 & 2032
- Figure 62: Asia Pacific Game Streaming Industry Volume Share (%), by Country 2024 & 2032
- Figure 63: Latin America Game Streaming Industry Revenue (Million), by Revenue Model 2024 & 2032
- Figure 64: Latin America Game Streaming Industry Volume (K Unit), by Revenue Model 2024 & 2032
- Figure 65: Latin America Game Streaming Industry Revenue Share (%), by Revenue Model 2024 & 2032
- Figure 66: Latin America Game Streaming Industry Volume Share (%), by Revenue Model 2024 & 2032
- Figure 67: Latin America Game Streaming Industry Revenue (Million), by Solutions 2024 & 2032
- Figure 68: Latin America Game Streaming Industry Volume (K Unit), by Solutions 2024 & 2032
- Figure 69: Latin America Game Streaming Industry Revenue Share (%), by Solutions 2024 & 2032
- Figure 70: Latin America Game Streaming Industry Volume Share (%), by Solutions 2024 & 2032
- Figure 71: Latin America Game Streaming Industry Revenue (Million), by Country 2024 & 2032
- Figure 72: Latin America Game Streaming Industry Volume (K Unit), by Country 2024 & 2032
- Figure 73: Latin America Game Streaming Industry Revenue Share (%), by Country 2024 & 2032
- Figure 74: Latin America Game Streaming Industry Volume Share (%), by Country 2024 & 2032
- Figure 75: Middle East and Africa Game Streaming Industry Revenue (Million), by Revenue Model 2024 & 2032
- Figure 76: Middle East and Africa Game Streaming Industry Volume (K Unit), by Revenue Model 2024 & 2032
- Figure 77: Middle East and Africa Game Streaming Industry Revenue Share (%), by Revenue Model 2024 & 2032
- Figure 78: Middle East and Africa Game Streaming Industry Volume Share (%), by Revenue Model 2024 & 2032
- Figure 79: Middle East and Africa Game Streaming Industry Revenue (Million), by Solutions 2024 & 2032
- Figure 80: Middle East and Africa Game Streaming Industry Volume (K Unit), by Solutions 2024 & 2032
- Figure 81: Middle East and Africa Game Streaming Industry Revenue Share (%), by Solutions 2024 & 2032
- Figure 82: Middle East and Africa Game Streaming Industry Volume Share (%), by Solutions 2024 & 2032
- Figure 83: Middle East and Africa Game Streaming Industry Revenue (Million), by Country 2024 & 2032
- Figure 84: Middle East and Africa Game Streaming Industry Volume (K Unit), by Country 2024 & 2032
- Figure 85: Middle East and Africa Game Streaming Industry Revenue Share (%), by Country 2024 & 2032
- Figure 86: Middle East and Africa Game Streaming Industry Volume Share (%), by Country 2024 & 2032
List of Tables
- Table 1: Global Game Streaming Industry Revenue Million Forecast, by Region 2019 & 2032
- Table 2: Global Game Streaming Industry Volume K Unit Forecast, by Region 2019 & 2032
- Table 3: Global Game Streaming Industry Revenue Million Forecast, by Revenue Model 2019 & 2032
- Table 4: Global Game Streaming Industry Volume K Unit Forecast, by Revenue Model 2019 & 2032
- Table 5: Global Game Streaming Industry Revenue Million Forecast, by Solutions 2019 & 2032
- Table 6: Global Game Streaming Industry Volume K Unit Forecast, by Solutions 2019 & 2032
- Table 7: Global Game Streaming Industry Revenue Million Forecast, by Region 2019 & 2032
- Table 8: Global Game Streaming Industry Volume K Unit Forecast, by Region 2019 & 2032
- Table 9: Global Game Streaming Industry Revenue Million Forecast, by Country 2019 & 2032
- Table 10: Global Game Streaming Industry Volume K Unit Forecast, by Country 2019 & 2032
- Table 11: United States Game Streaming Industry Revenue (Million) Forecast, by Application 2019 & 2032
- Table 12: United States Game Streaming Industry Volume (K Unit) Forecast, by Application 2019 & 2032
- Table 13: Canada Game Streaming Industry Revenue (Million) Forecast, by Application 2019 & 2032
- Table 14: Canada Game Streaming Industry Volume (K Unit) Forecast, by Application 2019 & 2032
- Table 15: Mexico Game Streaming Industry Revenue (Million) Forecast, by Application 2019 & 2032
- Table 16: Mexico Game Streaming Industry Volume (K Unit) Forecast, by Application 2019 & 2032
- Table 17: Global Game Streaming Industry Revenue Million Forecast, by Country 2019 & 2032
- Table 18: Global Game Streaming Industry Volume K Unit Forecast, by Country 2019 & 2032
- Table 19: Germany Game Streaming Industry Revenue (Million) Forecast, by Application 2019 & 2032
- Table 20: Germany Game Streaming Industry Volume (K Unit) Forecast, by Application 2019 & 2032
- Table 21: United Kingdom Game Streaming Industry Revenue (Million) Forecast, by Application 2019 & 2032
- Table 22: United Kingdom Game Streaming Industry Volume (K Unit) Forecast, by Application 2019 & 2032
- Table 23: France Game Streaming Industry Revenue (Million) Forecast, by Application 2019 & 2032
- Table 24: France Game Streaming Industry Volume (K Unit) Forecast, by Application 2019 & 2032
- Table 25: Spain Game Streaming Industry Revenue (Million) Forecast, by Application 2019 & 2032
- Table 26: Spain Game Streaming Industry Volume (K Unit) Forecast, by Application 2019 & 2032
- Table 27: Italy Game Streaming Industry Revenue (Million) Forecast, by Application 2019 & 2032
- Table 28: Italy Game Streaming Industry Volume (K Unit) Forecast, by Application 2019 & 2032
- Table 29: Spain Game Streaming Industry Revenue (Million) Forecast, by Application 2019 & 2032
- Table 30: Spain Game Streaming Industry Volume (K Unit) Forecast, by Application 2019 & 2032
- Table 31: Belgium Game Streaming Industry Revenue (Million) Forecast, by Application 2019 & 2032
- Table 32: Belgium Game Streaming Industry Volume (K Unit) Forecast, by Application 2019 & 2032
- Table 33: Netherland Game Streaming Industry Revenue (Million) Forecast, by Application 2019 & 2032
- Table 34: Netherland Game Streaming Industry Volume (K Unit) Forecast, by Application 2019 & 2032
- Table 35: Nordics Game Streaming Industry Revenue (Million) Forecast, by Application 2019 & 2032
- Table 36: Nordics Game Streaming Industry Volume (K Unit) Forecast, by Application 2019 & 2032
- Table 37: Rest of Europe Game Streaming Industry Revenue (Million) Forecast, by Application 2019 & 2032
- Table 38: Rest of Europe Game Streaming Industry Volume (K Unit) Forecast, by Application 2019 & 2032
- Table 39: Global Game Streaming Industry Revenue Million Forecast, by Country 2019 & 2032
- Table 40: Global Game Streaming Industry Volume K Unit Forecast, by Country 2019 & 2032
- Table 41: China Game Streaming Industry Revenue (Million) Forecast, by Application 2019 & 2032
- Table 42: China Game Streaming Industry Volume (K Unit) Forecast, by Application 2019 & 2032
- Table 43: Japan Game Streaming Industry Revenue (Million) Forecast, by Application 2019 & 2032
- Table 44: Japan Game Streaming Industry Volume (K Unit) Forecast, by Application 2019 & 2032
- Table 45: India Game Streaming Industry Revenue (Million) Forecast, by Application 2019 & 2032
- Table 46: India Game Streaming Industry Volume (K Unit) Forecast, by Application 2019 & 2032
- Table 47: South Korea Game Streaming Industry Revenue (Million) Forecast, by Application 2019 & 2032
- Table 48: South Korea Game Streaming Industry Volume (K Unit) Forecast, by Application 2019 & 2032
- Table 49: Southeast Asia Game Streaming Industry Revenue (Million) Forecast, by Application 2019 & 2032
- Table 50: Southeast Asia Game Streaming Industry Volume (K Unit) Forecast, by Application 2019 & 2032
- Table 51: Australia Game Streaming Industry Revenue (Million) Forecast, by Application 2019 & 2032
- Table 52: Australia Game Streaming Industry Volume (K Unit) Forecast, by Application 2019 & 2032
- Table 53: Indonesia Game Streaming Industry Revenue (Million) Forecast, by Application 2019 & 2032
- Table 54: Indonesia Game Streaming Industry Volume (K Unit) Forecast, by Application 2019 & 2032
- Table 55: Phillipes Game Streaming Industry Revenue (Million) Forecast, by Application 2019 & 2032
- Table 56: Phillipes Game Streaming Industry Volume (K Unit) Forecast, by Application 2019 & 2032
- Table 57: Singapore Game Streaming Industry Revenue (Million) Forecast, by Application 2019 & 2032
- Table 58: Singapore Game Streaming Industry Volume (K Unit) Forecast, by Application 2019 & 2032
- Table 59: Thailandc Game Streaming Industry Revenue (Million) Forecast, by Application 2019 & 2032
- Table 60: Thailandc Game Streaming Industry Volume (K Unit) Forecast, by Application 2019 & 2032
- Table 61: Rest of Asia Pacific Game Streaming Industry Revenue (Million) Forecast, by Application 2019 & 2032
- Table 62: Rest of Asia Pacific Game Streaming Industry Volume (K Unit) Forecast, by Application 2019 & 2032
- Table 63: Global Game Streaming Industry Revenue Million Forecast, by Country 2019 & 2032
- Table 64: Global Game Streaming Industry Volume K Unit Forecast, by Country 2019 & 2032
- Table 65: Brazil Game Streaming Industry Revenue (Million) Forecast, by Application 2019 & 2032
- Table 66: Brazil Game Streaming Industry Volume (K Unit) Forecast, by Application 2019 & 2032
- Table 67: Argentina Game Streaming Industry Revenue (Million) Forecast, by Application 2019 & 2032
- Table 68: Argentina Game Streaming Industry Volume (K Unit) Forecast, by Application 2019 & 2032
- Table 69: Peru Game Streaming Industry Revenue (Million) Forecast, by Application 2019 & 2032
- Table 70: Peru Game Streaming Industry Volume (K Unit) Forecast, by Application 2019 & 2032
- Table 71: Chile Game Streaming Industry Revenue (Million) Forecast, by Application 2019 & 2032
- Table 72: Chile Game Streaming Industry Volume (K Unit) Forecast, by Application 2019 & 2032
- Table 73: Colombia Game Streaming Industry Revenue (Million) Forecast, by Application 2019 & 2032
- Table 74: Colombia Game Streaming Industry Volume (K Unit) Forecast, by Application 2019 & 2032
- Table 75: Ecuador Game Streaming Industry Revenue (Million) Forecast, by Application 2019 & 2032
- Table 76: Ecuador Game Streaming Industry Volume (K Unit) Forecast, by Application 2019 & 2032
- Table 77: Venezuela Game Streaming Industry Revenue (Million) Forecast, by Application 2019 & 2032
- Table 78: Venezuela Game Streaming Industry Volume (K Unit) Forecast, by Application 2019 & 2032
- Table 79: Rest of South America Game Streaming Industry Revenue (Million) Forecast, by Application 2019 & 2032
- Table 80: Rest of South America Game Streaming Industry Volume (K Unit) Forecast, by Application 2019 & 2032
- Table 81: Global Game Streaming Industry Revenue Million Forecast, by Country 2019 & 2032
- Table 82: Global Game Streaming Industry Volume K Unit Forecast, by Country 2019 & 2032
- Table 83: United States Game Streaming Industry Revenue (Million) Forecast, by Application 2019 & 2032
- Table 84: United States Game Streaming Industry Volume (K Unit) Forecast, by Application 2019 & 2032
- Table 85: Canada Game Streaming Industry Revenue (Million) Forecast, by Application 2019 & 2032
- Table 86: Canada Game Streaming Industry Volume (K Unit) Forecast, by Application 2019 & 2032
- Table 87: Mexico Game Streaming Industry Revenue (Million) Forecast, by Application 2019 & 2032
- Table 88: Mexico Game Streaming Industry Volume (K Unit) Forecast, by Application 2019 & 2032
- Table 89: Global Game Streaming Industry Revenue Million Forecast, by Country 2019 & 2032
- Table 90: Global Game Streaming Industry Volume K Unit Forecast, by Country 2019 & 2032
- Table 91: United Arab Emirates Game Streaming Industry Revenue (Million) Forecast, by Application 2019 & 2032
- Table 92: United Arab Emirates Game Streaming Industry Volume (K Unit) Forecast, by Application 2019 & 2032
- Table 93: Saudi Arabia Game Streaming Industry Revenue (Million) Forecast, by Application 2019 & 2032
- Table 94: Saudi Arabia Game Streaming Industry Volume (K Unit) Forecast, by Application 2019 & 2032
- Table 95: South Africa Game Streaming Industry Revenue (Million) Forecast, by Application 2019 & 2032
- Table 96: South Africa Game Streaming Industry Volume (K Unit) Forecast, by Application 2019 & 2032
- Table 97: Rest of Middle East and Africa Game Streaming Industry Revenue (Million) Forecast, by Application 2019 & 2032
- Table 98: Rest of Middle East and Africa Game Streaming Industry Volume (K Unit) Forecast, by Application 2019 & 2032
- Table 99: Global Game Streaming Industry Revenue Million Forecast, by Revenue Model 2019 & 2032
- Table 100: Global Game Streaming Industry Volume K Unit Forecast, by Revenue Model 2019 & 2032
- Table 101: Global Game Streaming Industry Revenue Million Forecast, by Solutions 2019 & 2032
- Table 102: Global Game Streaming Industry Volume K Unit Forecast, by Solutions 2019 & 2032
- Table 103: Global Game Streaming Industry Revenue Million Forecast, by Country 2019 & 2032
- Table 104: Global Game Streaming Industry Volume K Unit Forecast, by Country 2019 & 2032
- Table 105: United States Game Streaming Industry Revenue (Million) Forecast, by Application 2019 & 2032
- Table 106: United States Game Streaming Industry Volume (K Unit) Forecast, by Application 2019 & 2032
- Table 107: Canada Game Streaming Industry Revenue (Million) Forecast, by Application 2019 & 2032
- Table 108: Canada Game Streaming Industry Volume (K Unit) Forecast, by Application 2019 & 2032
- Table 109: Global Game Streaming Industry Revenue Million Forecast, by Revenue Model 2019 & 2032
- Table 110: Global Game Streaming Industry Volume K Unit Forecast, by Revenue Model 2019 & 2032
- Table 111: Global Game Streaming Industry Revenue Million Forecast, by Solutions 2019 & 2032
- Table 112: Global Game Streaming Industry Volume K Unit Forecast, by Solutions 2019 & 2032
- Table 113: Global Game Streaming Industry Revenue Million Forecast, by Country 2019 & 2032
- Table 114: Global Game Streaming Industry Volume K Unit Forecast, by Country 2019 & 2032
- Table 115: Germany Game Streaming Industry Revenue (Million) Forecast, by Application 2019 & 2032
- Table 116: Germany Game Streaming Industry Volume (K Unit) Forecast, by Application 2019 & 2032
- Table 117: United Kingdom Game Streaming Industry Revenue (Million) Forecast, by Application 2019 & 2032
- Table 118: United Kingdom Game Streaming Industry Volume (K Unit) Forecast, by Application 2019 & 2032
- Table 119: Global Game Streaming Industry Revenue Million Forecast, by Revenue Model 2019 & 2032
- Table 120: Global Game Streaming Industry Volume K Unit Forecast, by Revenue Model 2019 & 2032
- Table 121: Global Game Streaming Industry Revenue Million Forecast, by Solutions 2019 & 2032
- Table 122: Global Game Streaming Industry Volume K Unit Forecast, by Solutions 2019 & 2032
- Table 123: Global Game Streaming Industry Revenue Million Forecast, by Country 2019 & 2032
- Table 124: Global Game Streaming Industry Volume K Unit Forecast, by Country 2019 & 2032
- Table 125: China Game Streaming Industry Revenue (Million) Forecast, by Application 2019 & 2032
- Table 126: China Game Streaming Industry Volume (K Unit) Forecast, by Application 2019 & 2032
- Table 127: Japan Game Streaming Industry Revenue (Million) Forecast, by Application 2019 & 2032
- Table 128: Japan Game Streaming Industry Volume (K Unit) Forecast, by Application 2019 & 2032
- Table 129: India Game Streaming Industry Revenue (Million) Forecast, by Application 2019 & 2032
- Table 130: India Game Streaming Industry Volume (K Unit) Forecast, by Application 2019 & 2032
- Table 131: South Korea Game Streaming Industry Revenue (Million) Forecast, by Application 2019 & 2032
- Table 132: South Korea Game Streaming Industry Volume (K Unit) Forecast, by Application 2019 & 2032
- Table 133: Australia and New Zealand Game Streaming Industry Revenue (Million) Forecast, by Application 2019 & 2032
- Table 134: Australia and New Zealand Game Streaming Industry Volume (K Unit) Forecast, by Application 2019 & 2032
- Table 135: Global Game Streaming Industry Revenue Million Forecast, by Revenue Model 2019 & 2032
- Table 136: Global Game Streaming Industry Volume K Unit Forecast, by Revenue Model 2019 & 2032
- Table 137: Global Game Streaming Industry Revenue Million Forecast, by Solutions 2019 & 2032
- Table 138: Global Game Streaming Industry Volume K Unit Forecast, by Solutions 2019 & 2032
- Table 139: Global Game Streaming Industry Revenue Million Forecast, by Country 2019 & 2032
- Table 140: Global Game Streaming Industry Volume K Unit Forecast, by Country 2019 & 2032
- Table 141: Global Game Streaming Industry Revenue Million Forecast, by Revenue Model 2019 & 2032
- Table 142: Global Game Streaming Industry Volume K Unit Forecast, by Revenue Model 2019 & 2032
- Table 143: Global Game Streaming Industry Revenue Million Forecast, by Solutions 2019 & 2032
- Table 144: Global Game Streaming Industry Volume K Unit Forecast, by Solutions 2019 & 2032
- Table 145: Global Game Streaming Industry Revenue Million Forecast, by Country 2019 & 2032
- Table 146: Global Game Streaming Industry Volume K Unit Forecast, by Country 2019 & 2032
Frequently Asked Questions
1. What is the projected Compound Annual Growth Rate (CAGR) of the Game Streaming Industry?
The projected CAGR is approximately 10.52%.
2. Which companies are prominent players in the Game Streaming Industry?
Key companies in the market include Parsec (Unity Software Inc ), Youtube (Alphabet Inc ), Facebook Gaming (Meta Platforms Inc ), Wuhan Douyu Network Technology Co Ltd, Huya Inc, Amazon com Inc, Nvidia Corporation, Sony Group Corporatio, Apple Inc, Afreecatv Co Ltd.
3. What are the main segments of the Game Streaming Industry?
The market segments include Revenue Model, Solutions.
4. Can you provide details about the market size?
The market size is estimated to be USD 7.60 Million as of 2022.
5. What are some drivers contributing to market growth?
Growing Popularity of Esports and Broadcasting of Esports Events; Growth of Video Game Streaming Software for Mobile Devices.
6. What are the notable trends driving market growth?
YouTube to be the Largest Web-based Solution.
7. Are there any restraints impacting market growth?
High Cost of Content Creation.
8. Can you provide examples of recent developments in the market?
November 2023 - Sony partnered with NCSoft to have a notable role in developing and releasing these mobile games to expand beyond the console and broaden PlayStation's reach to a broader audience, which can support the company's growth in the future.
9. What pricing options are available for accessing the report?
Pricing options include single-user, multi-user, and enterprise licenses priced at USD 4750, USD 5250, and USD 8750 respectively.
10. Is the market size provided in terms of value or volume?
The market size is provided in terms of value, measured in Million and volume, measured in K Unit.
11. Are there any specific market keywords associated with the report?
Yes, the market keyword associated with the report is "Game Streaming Industry," which aids in identifying and referencing the specific market segment covered.
12. How do I determine which pricing option suits my needs best?
The pricing options vary based on user requirements and access needs. Individual users may opt for single-user licenses, while businesses requiring broader access may choose multi-user or enterprise licenses for cost-effective access to the report.
13. Are there any additional resources or data provided in the Game Streaming Industry report?
While the report offers comprehensive insights, it's advisable to review the specific contents or supplementary materials provided to ascertain if additional resources or data are available.
14. How can I stay updated on further developments or reports in the Game Streaming Industry?
To stay informed about further developments, trends, and reports in the Game Streaming Industry, consider subscribing to industry newsletters, following relevant companies and organizations, or regularly checking reputable industry news sources and publications.
Methodology
Step 1 - Identification of Relevant Samples Size from Population Database


Step 2 - Approaches for Defining Global Market Size (Value, Volume* & Price*)

Note*: In applicable scenarios
Step 3 - Data Sources
Primary Research
- Web Analytics
- Survey Reports
- Research Institute
- Latest Research Reports
- Opinion Leaders
Secondary Research
- Annual Reports
- White Paper
- Latest Press Release
- Industry Association
- Paid Database
- Investor Presentations

Step 4 - Data Triangulation
Involves using different sources of information in order to increase the validity of a study
These sources are likely to be stakeholders in a program - participants, other researchers, program staff, other community members, and so on.
Then we put all data in single framework & apply various statistical tools to find out the dynamic on the market.
During the analysis stage, feedback from the stakeholder groups would be compared to determine areas of agreement as well as areas of divergence


