
Key Insights
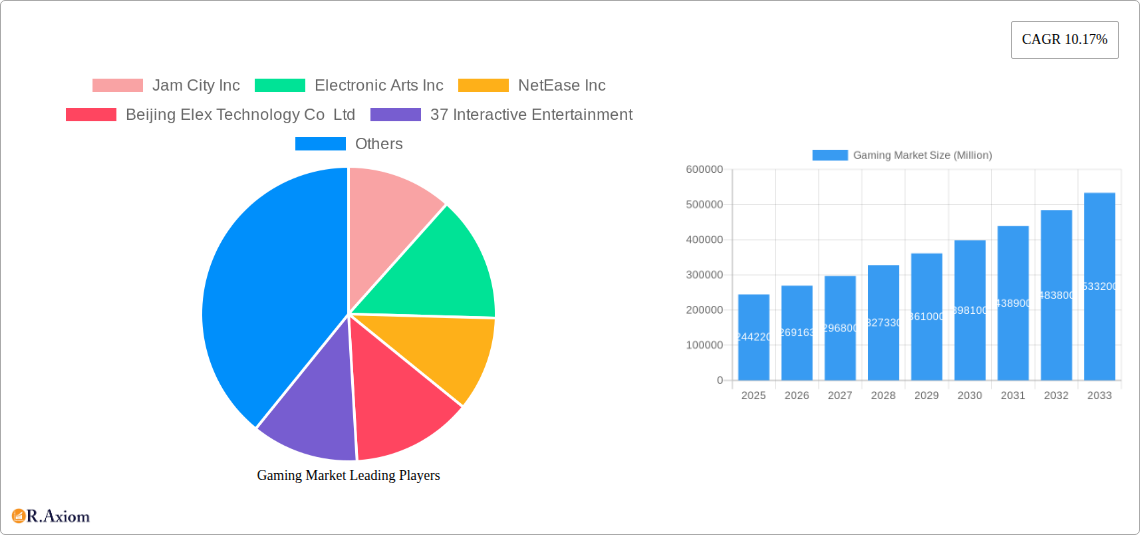
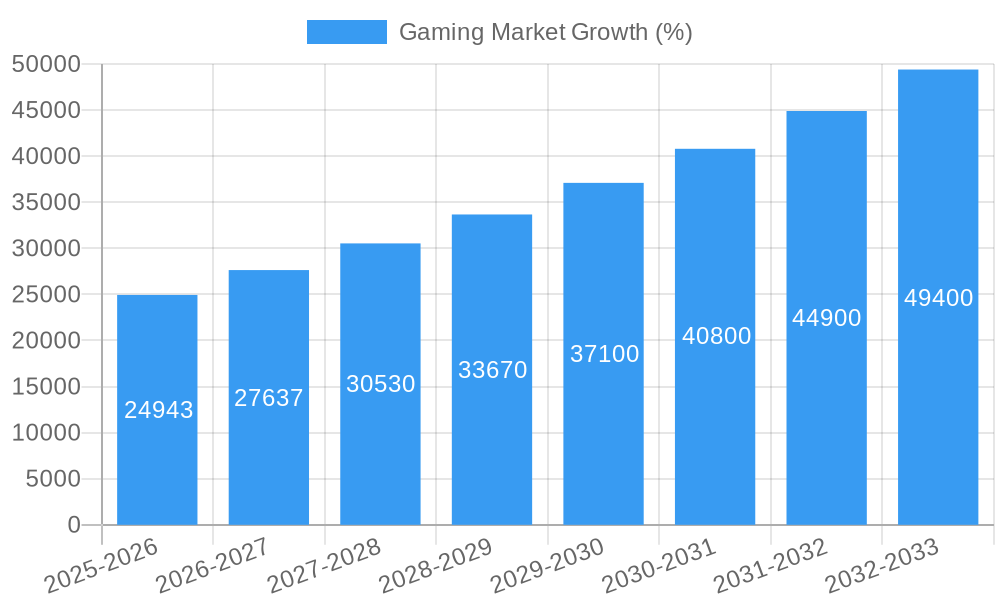
The global gaming market, currently valued at $244.22 billion (2025), is projected to experience robust growth, exhibiting a Compound Annual Growth Rate (CAGR) of 10.17% from 2025 to 2033. This expansion is fueled by several key drivers. The increasing accessibility of mobile gaming, coupled with the continuous improvement in mobile device technology and internet penetration, is a significant contributor. Furthermore, the rise of esports as a professional and spectator sport is driving substantial investment and engagement, attracting a broader audience. Technological advancements, such as the introduction of virtual reality (VR) and augmented reality (AR) gaming experiences, are also contributing to market growth by offering immersive and interactive gameplay. However, challenges remain, such as concerns regarding gaming addiction and the potential for market saturation in certain segments. Nevertheless, the continuous innovation in game design, the expansion of the global player base, and the evolution of monetization strategies (like in-app purchases and subscriptions) suggest a sustained period of growth.
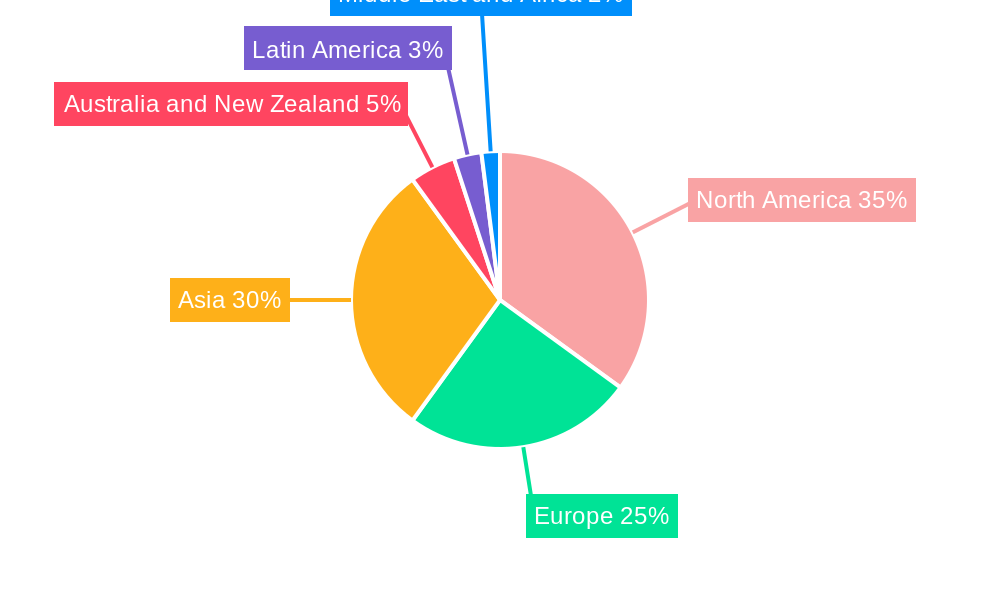
Segment-wise, mobile gaming currently holds a dominant position, benefiting from its widespread accessibility. Console gaming remains a significant contributor, with continuous innovation in hardware and software pushing the boundaries of gaming experiences. The PC gaming market, encompassing both downloaded and boxed games, displays sustained growth driven by the increasing power and affordability of personal computers. E-sports, a fast-growing sector, presents lucrative opportunities for both players and businesses, fueled by sponsorships, media rights, and merchandise sales. Geographically, North America and Asia currently dominate the market, with China and the United States representing major hubs. However, emerging markets in Latin America, the Middle East, and Africa demonstrate promising growth potential as internet penetration and smartphone ownership increase. The competitive landscape is dynamic, with established players like Tencent, Sony, and Microsoft alongside innovative independent studios constantly vying for market share. Strategic acquisitions, partnerships, and the release of blockbuster titles will continue to shape the market's trajectory in the years to come.
Gaming Market: A Comprehensive Report (2019-2033)
This in-depth report provides a comprehensive analysis of the global gaming market, encompassing historical performance (2019-2024), current estimations (2025), and future projections (2025-2033). It delves into market concentration, innovation, industry trends, dominant segments, product developments, and key players, offering invaluable insights for industry stakeholders. The report uses Million (M) for all values.
Gaming Market Concentration & Innovation
The gaming market exhibits a concentrated landscape, with a few dominant players controlling significant market share. However, continuous innovation and the emergence of new technologies are fostering a more dynamic competitive environment. Market concentration is measured through factors like the Herfindahl-Hirschman Index (HHI) which is predicted to be at xx in 2025. Major mergers and acquisitions (M&A) activities further shape the industry's structure. In 2024, the total value of M&A deals in the gaming sector is estimated at $xx Million.
- Market Share: Tencent Holdings Ltd and Sony Corporation hold substantial market share, exceeding xx% combined in 2025. Other key players such as Microsoft Corporation, Electronic Arts Inc, and Nintendo Co Ltd also command significant shares.
- Innovation Drivers: Technological advancements in game engines, graphics processing, virtual reality (VR), augmented reality (AR), and cloud gaming are pushing innovation. The rise of esports and the increasing integration of mobile gaming also drive market dynamism.
- Regulatory Frameworks: Government regulations related to data privacy, content rating, and anti-competitive practices significantly impact the market. Variations in these regulations across different regions add complexity for global players.
- Product Substitutes: Streaming services and other forms of entertainment compete for consumer attention and spending, representing a significant substitute for traditional gaming.
- End-User Trends: Growing demand for immersive experiences, competitive gaming, and cross-platform compatibility are shaping end-user preferences.
- M&A Activities: Strategic acquisitions and mergers are common, with larger players seeking to expand their portfolios and consolidate market share. The average deal value for M&A in 2024 is predicted at xx Million.
Gaming Market Industry Trends & Insights
The global gaming market is experiencing robust growth, driven by several key factors. The compound annual growth rate (CAGR) for the period 2025-2033 is projected to be xx%. This growth is fueled by factors such as increasing smartphone penetration, the expanding accessibility of high-speed internet, and the rising popularity of esports and cloud gaming. Technological advancements like improved game engines and graphics continue to enhance user experience, further driving market expansion. Consumer preferences are shifting towards mobile gaming, with a notable increase in spending on in-app purchases. The market penetration of mobile gaming surpasses that of console and PC gaming, demonstrating its dominant position. Competitive dynamics are intensifying, with companies constantly innovating to gain a competitive edge and enhance their market position. This competitive landscape encourages the development of innovative gaming experiences and technologies.
Dominant Markets & Segments in Gaming Market
The Asia-Pacific region, specifically China, dominates the gaming market globally. This dominance is driven by several factors:
- Key Drivers for Asia-Pacific Dominance:
- High smartphone penetration and affordable internet access.
- A large and rapidly growing gaming population.
- Supportive government policies and a thriving esports ecosystem.
- Strong domestic gaming companies with significant investments in R&D.
Mobile gaming is currently the largest segment by gaming type, holding the majority of the market share in 2025. This segment exhibits the highest growth rate compared to console games, downloaded/box PC games, and esports. The growth in mobile gaming is attributed to increased smartphone penetration and the popularity of casual games. Console games maintain a substantial portion of the market, driven by the release of new gaming consoles and high-quality game titles. While downloaded/box PC games maintain a steady market share, their growth is slower compared to mobile gaming. Esports is exhibiting rapid expansion, attracting a sizable audience and lucrative sponsorship deals, though it constitutes a smaller market segment.
Gaming Market Product Developments
Recent product innovations have focused on enhancing user experiences through improved graphics, immersive gameplay, and cross-platform compatibility. The introduction of VR and AR technologies is transforming gaming, creating new opportunities and expanding the market. Cloud gaming services are increasing accessibility to high-quality games, even on less powerful devices. This trend aims to expand the gaming market's reach to a broader consumer base. Competitiveness is spurred through creating unique game mechanics, innovative storylines, and compelling features designed to differentiate products.
Report Scope & Segmentation Analysis
This report segments the gaming market by gaming type:
- Mobile Games: This segment showcases rapid growth driven by smartphone penetration and accessibility. Market size in 2025 is estimated at xx Million, projected to reach xx Million by 2033. Competitive dynamics are characterized by a high level of innovation and intense competition.
- Console Games: This segment is characterized by high-quality graphics and immersive gameplay. Market size in 2025 is estimated at xx Million and is expected to grow to xx Million by 2033. Major players are constantly investing in new consoles and exclusive titles.
- Downloaded/Box PC Games: This segment maintains a significant share and provides a platform for complex and high-fidelity games. Market size in 2025 is estimated at xx Million, and is expected to reach xx Million by 2033. The market is driven by the release of new high-quality games.
- Esports: This fast-growing segment is driven by rising viewership and increasing investments. Market size in 2025 is estimated at xx Million, with a projection of xx Million by 2033. The segment is characterized by intense competition among players and teams.
Key Drivers of Gaming Market Growth
Several factors contribute to the gaming market's expansion:
- Technological Advancements: Continuous improvements in game engines, graphics, and VR/AR technology enhance the gaming experience, attracting new players.
- Increased Smartphone Penetration: The widespread adoption of smartphones provides accessibility to a massive audience, fueling growth in mobile gaming.
- Growth of Esports: The rising popularity of esports expands the market through sponsorships, viewership, and professional opportunities.
- Expansion of Cloud Gaming: Cloud gaming enables accessibility across devices and empowers wider market participation.
Challenges in the Gaming Market Sector
The gaming market faces several challenges:
- Regulatory Hurdles: Stringent regulations concerning content, data privacy, and anti-competitive behavior can pose difficulties for businesses.
- Supply Chain Issues: Disruptions to global supply chains, particularly impacting hardware components, can influence production and distribution.
- Intense Competition: The fiercely competitive nature of the market demands constant innovation and investment to maintain market share. This competition can lead to price wars and reduce profit margins.
Emerging Opportunities in Gaming Market
Several opportunities exist within the gaming sector:
- Expansion into New Markets: Untapped markets in developing economies provide significant growth potential.
- Development of Innovative Technologies: Emerging technologies like AI and blockchain can reshape gaming experiences and create new revenue streams.
- Integration of Metaverse and Web3: The integration of these technologies offers possibilities for immersive gaming experiences, NFTs, and community-driven development.
Leading Players in the Gaming Market Market
- Jam City Inc
- Electronic Arts Inc
- NetEase Inc
- Beijing Elex Technology Co Ltd
- 37 Interactive Entertainment
- Microsoft Corporation
- Sega Sammy Holdings Inc
- Square Enix Holdings Co Ltd
- Ubisoft Entertainment SA
- Tencent Holdings Ltd
- Nintendo Co Ltd
- ZeptoLab UK limited
- Realnetworks LLC (Gamehouse)
- Take-Two Interactive Software Inc
- Apple Inc
- Bandai Namco Holdings Inc
- Nexon Co Ltd
- Sony Corporation
- Capcom Co Ltd
Key Developments in Gaming Market Industry
- June 2024: Microsoft unveiled three new Xbox Series X and S console variants, including an all-digital model and a premium 2TB model. This significantly impacts the console market, expanding the range of choices for consumers and potentially increasing market share.
- April 2024: Sony launched the PlayStation 5 Slim in India, offering a lighter and smaller version of its flagship console. This launch aims to enhance accessibility and affordability, particularly in the Indian market.
Strategic Outlook for Gaming Market Market
The future of the gaming market is brimming with potential. Continued technological advancements, expanding accessibility through cloud gaming, and the maturation of esports promise sustained growth. The increasing integration of metaverse technologies and Web3 advancements will likely transform the way games are developed, distributed, and monetized, opening up new opportunities for innovation and revenue generation. The market's future growth is contingent upon sustained technological progress, the expansion of high-speed internet access, and the evolving preferences of the ever-growing gaming community.
Gaming Market Segmentation
-
1. Gaming Type
- 1.1. Mobile Games
- 1.2. Console Games
- 1.3. Downloaded/Box PC
- 1.4. E-sports
Gaming Market Segmentation By Geography
-
1. North America
- 1.1. United States
- 1.2. Canada
-
2. Europe
- 2.1. Germany
- 2.2. United Kingdom
- 2.3. France
- 2.4. Russia
- 2.5. Spain
- 2.6. Italy
-
3. Asia
- 3.1. China
- 3.2. Japan
- 3.3. South Korea
- 4. Australia and New Zealand
-
5. Latin America
- 5.1. Brazil
- 5.2. Argentina
- 5.3. Mexico
-
6. Middle East and Africa
- 6.1. United Arab Emirates
- 6.2. Saudi Arabia
- 6.3. Iran
- 6.4. Egypt
Gaming Market REPORT HIGHLIGHTS
| Aspects | Details |
|---|---|
| Study Period | 2019-2033 |
| Base Year | 2024 |
| Estimated Year | 2025 |
| Forecast Period | 2025-2033 |
| Historical Period | 2019-2024 |
| Growth Rate | CAGR of 10.17% from 2019-2033 |
| Segmentation |
|
Table of Contents
- 1. Introduction
- 1.1. Research Scope
- 1.2. Market Segmentation
- 1.3. Research Methodology
- 1.4. Definitions and Assumptions
- 2. Executive Summary
- 2.1. Introduction
- 3. Market Dynamics
- 3.1. Introduction
- 3.2. Market Drivers
- 3.2.1 Rising Internet Penetration; Emergence of Cloud Gaming; Adoption of Gaming Platforms
- 3.2.2 such as E-sports Betting and Fantasy Sites
- 3.3. Market Restrains
- 3.3.1 Issues such as Piracy
- 3.3.2 Laws and Regulations
- 3.3.3 and Concerns Relating to Fraud During Gaming Transactions
- 3.4. Market Trends
- 3.4.1. Console Games Gaming Type Segment Holds Significant Market Share
- 4. Market Factor Analysis
- 4.1. Porters Five Forces
- 4.2. Supply/Value Chain
- 4.3. PESTEL analysis
- 4.4. Market Entropy
- 4.5. Patent/Trademark Analysis
- 5. Global Gaming Market Analysis, Insights and Forecast, 2019-2031
- 5.1. Market Analysis, Insights and Forecast - by Gaming Type
- 5.1.1. Mobile Games
- 5.1.2. Console Games
- 5.1.3. Downloaded/Box PC
- 5.1.4. E-sports
- 5.2. Market Analysis, Insights and Forecast - by Region
- 5.2.1. North America
- 5.2.2. Europe
- 5.2.3. Asia
- 5.2.4. Australia and New Zealand
- 5.2.5. Latin America
- 5.2.6. Middle East and Africa
- 5.1. Market Analysis, Insights and Forecast - by Gaming Type
- 6. North America Gaming Market Analysis, Insights and Forecast, 2019-2031
- 6.1. Market Analysis, Insights and Forecast - by Gaming Type
- 6.1.1. Mobile Games
- 6.1.2. Console Games
- 6.1.3. Downloaded/Box PC
- 6.1.4. E-sports
- 6.1. Market Analysis, Insights and Forecast - by Gaming Type
- 7. Europe Gaming Market Analysis, Insights and Forecast, 2019-2031
- 7.1. Market Analysis, Insights and Forecast - by Gaming Type
- 7.1.1. Mobile Games
- 7.1.2. Console Games
- 7.1.3. Downloaded/Box PC
- 7.1.4. E-sports
- 7.1. Market Analysis, Insights and Forecast - by Gaming Type
- 8. Asia Gaming Market Analysis, Insights and Forecast, 2019-2031
- 8.1. Market Analysis, Insights and Forecast - by Gaming Type
- 8.1.1. Mobile Games
- 8.1.2. Console Games
- 8.1.3. Downloaded/Box PC
- 8.1.4. E-sports
- 8.1. Market Analysis, Insights and Forecast - by Gaming Type
- 9. Australia and New Zealand Gaming Market Analysis, Insights and Forecast, 2019-2031
- 9.1. Market Analysis, Insights and Forecast - by Gaming Type
- 9.1.1. Mobile Games
- 9.1.2. Console Games
- 9.1.3. Downloaded/Box PC
- 9.1.4. E-sports
- 9.1. Market Analysis, Insights and Forecast - by Gaming Type
- 10. Latin America Gaming Market Analysis, Insights and Forecast, 2019-2031
- 10.1. Market Analysis, Insights and Forecast - by Gaming Type
- 10.1.1. Mobile Games
- 10.1.2. Console Games
- 10.1.3. Downloaded/Box PC
- 10.1.4. E-sports
- 10.1. Market Analysis, Insights and Forecast - by Gaming Type
- 11. Middle East and Africa Gaming Market Analysis, Insights and Forecast, 2019-2031
- 11.1. Market Analysis, Insights and Forecast - by Gaming Type
- 11.1.1. Mobile Games
- 11.1.2. Console Games
- 11.1.3. Downloaded/Box PC
- 11.1.4. E-sports
- 11.1. Market Analysis, Insights and Forecast - by Gaming Type
- 12. North America Gaming Market Analysis, Insights and Forecast, 2019-2031
- 12.1. Market Analysis, Insights and Forecast - By Country/Sub-region
- 12.1.1 United States
- 12.1.2 Canada
- 13. Europe Gaming Market Analysis, Insights and Forecast, 2019-2031
- 13.1. Market Analysis, Insights and Forecast - By Country/Sub-region
- 13.1.1 Germany
- 13.1.2 United Kingdom
- 13.1.3 France
- 13.1.4 Russia
- 13.1.5 Spain
- 13.1.6 Italy
- 14. Asia Gaming Market Analysis, Insights and Forecast, 2019-2031
- 14.1. Market Analysis, Insights and Forecast - By Country/Sub-region
- 14.1.1 China
- 14.1.2 Japan
- 14.1.3 South Korea
- 15. Australia and New Zealand Gaming Market Analysis, Insights and Forecast, 2019-2031
- 15.1. Market Analysis, Insights and Forecast - By Country/Sub-region
- 15.1.1.
- 16. Latin America Gaming Market Analysis, Insights and Forecast, 2019-2031
- 16.1. Market Analysis, Insights and Forecast - By Country/Sub-region
- 16.1.1 Brazil
- 16.1.2 Argentina
- 16.1.3 Mexico
- 17. Middle East and Africa Gaming Market Analysis, Insights and Forecast, 2019-2031
- 17.1. Market Analysis, Insights and Forecast - By Country/Sub-region
- 17.1.1 United Arab Emirates
- 17.1.2 Saudi Arabia
- 17.1.3 Iran
- 17.1.4 Egypt
- 18. Competitive Analysis
- 18.1. Global Market Share Analysis 2024
- 18.2. Company Profiles
- 18.2.1 Jam City Inc
- 18.2.1.1. Overview
- 18.2.1.2. Products
- 18.2.1.3. SWOT Analysis
- 18.2.1.4. Recent Developments
- 18.2.1.5. Financials (Based on Availability)
- 18.2.2 Electronic Arts Inc
- 18.2.2.1. Overview
- 18.2.2.2. Products
- 18.2.2.3. SWOT Analysis
- 18.2.2.4. Recent Developments
- 18.2.2.5. Financials (Based on Availability)
- 18.2.3 NetEase Inc
- 18.2.3.1. Overview
- 18.2.3.2. Products
- 18.2.3.3. SWOT Analysis
- 18.2.3.4. Recent Developments
- 18.2.3.5. Financials (Based on Availability)
- 18.2.4 Beijing Elex Technology Co Ltd
- 18.2.4.1. Overview
- 18.2.4.2. Products
- 18.2.4.3. SWOT Analysis
- 18.2.4.4. Recent Developments
- 18.2.4.5. Financials (Based on Availability)
- 18.2.5 37 Interactive Entertainment
- 18.2.5.1. Overview
- 18.2.5.2. Products
- 18.2.5.3. SWOT Analysis
- 18.2.5.4. Recent Developments
- 18.2.5.5. Financials (Based on Availability)
- 18.2.6 Microsoft Corporation
- 18.2.6.1. Overview
- 18.2.6.2. Products
- 18.2.6.3. SWOT Analysis
- 18.2.6.4. Recent Developments
- 18.2.6.5. Financials (Based on Availability)
- 18.2.7 Sega Sammy Holdings Inc
- 18.2.7.1. Overview
- 18.2.7.2. Products
- 18.2.7.3. SWOT Analysis
- 18.2.7.4. Recent Developments
- 18.2.7.5. Financials (Based on Availability)
- 18.2.8 Square Enix Holdings Co Ltd
- 18.2.8.1. Overview
- 18.2.8.2. Products
- 18.2.8.3. SWOT Analysis
- 18.2.8.4. Recent Developments
- 18.2.8.5. Financials (Based on Availability)
- 18.2.9 Ubisoft Entertainment SA
- 18.2.9.1. Overview
- 18.2.9.2. Products
- 18.2.9.3. SWOT Analysis
- 18.2.9.4. Recent Developments
- 18.2.9.5. Financials (Based on Availability)
- 18.2.10 Tencent Holdings Ltd
- 18.2.10.1. Overview
- 18.2.10.2. Products
- 18.2.10.3. SWOT Analysis
- 18.2.10.4. Recent Developments
- 18.2.10.5. Financials (Based on Availability)
- 18.2.11 Nintendo Co Ltd
- 18.2.11.1. Overview
- 18.2.11.2. Products
- 18.2.11.3. SWOT Analysis
- 18.2.11.4. Recent Developments
- 18.2.11.5. Financials (Based on Availability)
- 18.2.12 ZeptoLab UK limited
- 18.2.12.1. Overview
- 18.2.12.2. Products
- 18.2.12.3. SWOT Analysis
- 18.2.12.4. Recent Developments
- 18.2.12.5. Financials (Based on Availability)
- 18.2.13 Realnetworks LLC (Gamehouse)
- 18.2.13.1. Overview
- 18.2.13.2. Products
- 18.2.13.3. SWOT Analysis
- 18.2.13.4. Recent Developments
- 18.2.13.5. Financials (Based on Availability)
- 18.2.14 Take-Two Interactive Software Inc
- 18.2.14.1. Overview
- 18.2.14.2. Products
- 18.2.14.3. SWOT Analysis
- 18.2.14.4. Recent Developments
- 18.2.14.5. Financials (Based on Availability)
- 18.2.15 Apple Inc
- 18.2.15.1. Overview
- 18.2.15.2. Products
- 18.2.15.3. SWOT Analysis
- 18.2.15.4. Recent Developments
- 18.2.15.5. Financials (Based on Availability)
- 18.2.16 Bandai Namco Holdings Inc
- 18.2.16.1. Overview
- 18.2.16.2. Products
- 18.2.16.3. SWOT Analysis
- 18.2.16.4. Recent Developments
- 18.2.16.5. Financials (Based on Availability)
- 18.2.17 Nexon Co Ltd
- 18.2.17.1. Overview
- 18.2.17.2. Products
- 18.2.17.3. SWOT Analysis
- 18.2.17.4. Recent Developments
- 18.2.17.5. Financials (Based on Availability)
- 18.2.18 Sony Corporation
- 18.2.18.1. Overview
- 18.2.18.2. Products
- 18.2.18.3. SWOT Analysis
- 18.2.18.4. Recent Developments
- 18.2.18.5. Financials (Based on Availability)
- 18.2.19 Capcom Co Ltd
- 18.2.19.1. Overview
- 18.2.19.2. Products
- 18.2.19.3. SWOT Analysis
- 18.2.19.4. Recent Developments
- 18.2.19.5. Financials (Based on Availability)
- 18.2.1 Jam City Inc
List of Figures
- Figure 1: Global Gaming Market Revenue Breakdown (Million, %) by Region 2024 & 2032
- Figure 2: North America Gaming Market Revenue (Million), by Country 2024 & 2032
- Figure 3: North America Gaming Market Revenue Share (%), by Country 2024 & 2032
- Figure 4: Europe Gaming Market Revenue (Million), by Country 2024 & 2032
- Figure 5: Europe Gaming Market Revenue Share (%), by Country 2024 & 2032
- Figure 6: Asia Gaming Market Revenue (Million), by Country 2024 & 2032
- Figure 7: Asia Gaming Market Revenue Share (%), by Country 2024 & 2032
- Figure 8: Australia and New Zealand Gaming Market Revenue (Million), by Country 2024 & 2032
- Figure 9: Australia and New Zealand Gaming Market Revenue Share (%), by Country 2024 & 2032
- Figure 10: Latin America Gaming Market Revenue (Million), by Country 2024 & 2032
- Figure 11: Latin America Gaming Market Revenue Share (%), by Country 2024 & 2032
- Figure 12: Middle East and Africa Gaming Market Revenue (Million), by Country 2024 & 2032
- Figure 13: Middle East and Africa Gaming Market Revenue Share (%), by Country 2024 & 2032
- Figure 14: North America Gaming Market Revenue (Million), by Gaming Type 2024 & 2032
- Figure 15: North America Gaming Market Revenue Share (%), by Gaming Type 2024 & 2032
- Figure 16: North America Gaming Market Revenue (Million), by Country 2024 & 2032
- Figure 17: North America Gaming Market Revenue Share (%), by Country 2024 & 2032
- Figure 18: Europe Gaming Market Revenue (Million), by Gaming Type 2024 & 2032
- Figure 19: Europe Gaming Market Revenue Share (%), by Gaming Type 2024 & 2032
- Figure 20: Europe Gaming Market Revenue (Million), by Country 2024 & 2032
- Figure 21: Europe Gaming Market Revenue Share (%), by Country 2024 & 2032
- Figure 22: Asia Gaming Market Revenue (Million), by Gaming Type 2024 & 2032
- Figure 23: Asia Gaming Market Revenue Share (%), by Gaming Type 2024 & 2032
- Figure 24: Asia Gaming Market Revenue (Million), by Country 2024 & 2032
- Figure 25: Asia Gaming Market Revenue Share (%), by Country 2024 & 2032
- Figure 26: Australia and New Zealand Gaming Market Revenue (Million), by Gaming Type 2024 & 2032
- Figure 27: Australia and New Zealand Gaming Market Revenue Share (%), by Gaming Type 2024 & 2032
- Figure 28: Australia and New Zealand Gaming Market Revenue (Million), by Country 2024 & 2032
- Figure 29: Australia and New Zealand Gaming Market Revenue Share (%), by Country 2024 & 2032
- Figure 30: Latin America Gaming Market Revenue (Million), by Gaming Type 2024 & 2032
- Figure 31: Latin America Gaming Market Revenue Share (%), by Gaming Type 2024 & 2032
- Figure 32: Latin America Gaming Market Revenue (Million), by Country 2024 & 2032
- Figure 33: Latin America Gaming Market Revenue Share (%), by Country 2024 & 2032
- Figure 34: Middle East and Africa Gaming Market Revenue (Million), by Gaming Type 2024 & 2032
- Figure 35: Middle East and Africa Gaming Market Revenue Share (%), by Gaming Type 2024 & 2032
- Figure 36: Middle East and Africa Gaming Market Revenue (Million), by Country 2024 & 2032
- Figure 37: Middle East and Africa Gaming Market Revenue Share (%), by Country 2024 & 2032
List of Tables
- Table 1: Global Gaming Market Revenue Million Forecast, by Region 2019 & 2032
- Table 2: Global Gaming Market Revenue Million Forecast, by Gaming Type 2019 & 2032
- Table 3: Global Gaming Market Revenue Million Forecast, by Region 2019 & 2032
- Table 4: Global Gaming Market Revenue Million Forecast, by Country 2019 & 2032
- Table 5: United States Gaming Market Revenue (Million) Forecast, by Application 2019 & 2032
- Table 6: Canada Gaming Market Revenue (Million) Forecast, by Application 2019 & 2032
- Table 7: Global Gaming Market Revenue Million Forecast, by Country 2019 & 2032
- Table 8: Germany Gaming Market Revenue (Million) Forecast, by Application 2019 & 2032
- Table 9: United Kingdom Gaming Market Revenue (Million) Forecast, by Application 2019 & 2032
- Table 10: France Gaming Market Revenue (Million) Forecast, by Application 2019 & 2032
- Table 11: Russia Gaming Market Revenue (Million) Forecast, by Application 2019 & 2032
- Table 12: Spain Gaming Market Revenue (Million) Forecast, by Application 2019 & 2032
- Table 13: Italy Gaming Market Revenue (Million) Forecast, by Application 2019 & 2032
- Table 14: Global Gaming Market Revenue Million Forecast, by Country 2019 & 2032
- Table 15: China Gaming Market Revenue (Million) Forecast, by Application 2019 & 2032
- Table 16: Japan Gaming Market Revenue (Million) Forecast, by Application 2019 & 2032
- Table 17: South Korea Gaming Market Revenue (Million) Forecast, by Application 2019 & 2032
- Table 18: Global Gaming Market Revenue Million Forecast, by Country 2019 & 2032
- Table 19: Gaming Market Revenue (Million) Forecast, by Application 2019 & 2032
- Table 20: Global Gaming Market Revenue Million Forecast, by Country 2019 & 2032
- Table 21: Brazil Gaming Market Revenue (Million) Forecast, by Application 2019 & 2032
- Table 22: Argentina Gaming Market Revenue (Million) Forecast, by Application 2019 & 2032
- Table 23: Mexico Gaming Market Revenue (Million) Forecast, by Application 2019 & 2032
- Table 24: Global Gaming Market Revenue Million Forecast, by Country 2019 & 2032
- Table 25: United Arab Emirates Gaming Market Revenue (Million) Forecast, by Application 2019 & 2032
- Table 26: Saudi Arabia Gaming Market Revenue (Million) Forecast, by Application 2019 & 2032
- Table 27: Iran Gaming Market Revenue (Million) Forecast, by Application 2019 & 2032
- Table 28: Egypt Gaming Market Revenue (Million) Forecast, by Application 2019 & 2032
- Table 29: Global Gaming Market Revenue Million Forecast, by Gaming Type 2019 & 2032
- Table 30: Global Gaming Market Revenue Million Forecast, by Country 2019 & 2032
- Table 31: United States Gaming Market Revenue (Million) Forecast, by Application 2019 & 2032
- Table 32: Canada Gaming Market Revenue (Million) Forecast, by Application 2019 & 2032
- Table 33: Global Gaming Market Revenue Million Forecast, by Gaming Type 2019 & 2032
- Table 34: Global Gaming Market Revenue Million Forecast, by Country 2019 & 2032
- Table 35: Germany Gaming Market Revenue (Million) Forecast, by Application 2019 & 2032
- Table 36: United Kingdom Gaming Market Revenue (Million) Forecast, by Application 2019 & 2032
- Table 37: France Gaming Market Revenue (Million) Forecast, by Application 2019 & 2032
- Table 38: Russia Gaming Market Revenue (Million) Forecast, by Application 2019 & 2032
- Table 39: Spain Gaming Market Revenue (Million) Forecast, by Application 2019 & 2032
- Table 40: Italy Gaming Market Revenue (Million) Forecast, by Application 2019 & 2032
- Table 41: Global Gaming Market Revenue Million Forecast, by Gaming Type 2019 & 2032
- Table 42: Global Gaming Market Revenue Million Forecast, by Country 2019 & 2032
- Table 43: China Gaming Market Revenue (Million) Forecast, by Application 2019 & 2032
- Table 44: Japan Gaming Market Revenue (Million) Forecast, by Application 2019 & 2032
- Table 45: South Korea Gaming Market Revenue (Million) Forecast, by Application 2019 & 2032
- Table 46: Global Gaming Market Revenue Million Forecast, by Gaming Type 2019 & 2032
- Table 47: Global Gaming Market Revenue Million Forecast, by Country 2019 & 2032
- Table 48: Global Gaming Market Revenue Million Forecast, by Gaming Type 2019 & 2032
- Table 49: Global Gaming Market Revenue Million Forecast, by Country 2019 & 2032
- Table 50: Brazil Gaming Market Revenue (Million) Forecast, by Application 2019 & 2032
- Table 51: Argentina Gaming Market Revenue (Million) Forecast, by Application 2019 & 2032
- Table 52: Mexico Gaming Market Revenue (Million) Forecast, by Application 2019 & 2032
- Table 53: Global Gaming Market Revenue Million Forecast, by Gaming Type 2019 & 2032
- Table 54: Global Gaming Market Revenue Million Forecast, by Country 2019 & 2032
- Table 55: United Arab Emirates Gaming Market Revenue (Million) Forecast, by Application 2019 & 2032
- Table 56: Saudi Arabia Gaming Market Revenue (Million) Forecast, by Application 2019 & 2032
- Table 57: Iran Gaming Market Revenue (Million) Forecast, by Application 2019 & 2032
- Table 58: Egypt Gaming Market Revenue (Million) Forecast, by Application 2019 & 2032
Frequently Asked Questions
1. What is the projected Compound Annual Growth Rate (CAGR) of the Gaming Market?
The projected CAGR is approximately 10.17%.
2. Which companies are prominent players in the Gaming Market?
Key companies in the market include Jam City Inc, Electronic Arts Inc, NetEase Inc, Beijing Elex Technology Co Ltd, 37 Interactive Entertainment, Microsoft Corporation, Sega Sammy Holdings Inc, Square Enix Holdings Co Ltd, Ubisoft Entertainment SA, Tencent Holdings Ltd, Nintendo Co Ltd, ZeptoLab UK limited, Realnetworks LLC (Gamehouse), Take-Two Interactive Software Inc, Apple Inc, Bandai Namco Holdings Inc, Nexon Co Ltd, Sony Corporation, Capcom Co Ltd.
3. What are the main segments of the Gaming Market?
The market segments include Gaming Type.
4. Can you provide details about the market size?
The market size is estimated to be USD 244.22 Million as of 2022.
5. What are some drivers contributing to market growth?
Rising Internet Penetration; Emergence of Cloud Gaming; Adoption of Gaming Platforms. such as E-sports Betting and Fantasy Sites.
6. What are the notable trends driving market growth?
Console Games Gaming Type Segment Holds Significant Market Share.
7. Are there any restraints impacting market growth?
Issues such as Piracy. Laws and Regulations. and Concerns Relating to Fraud During Gaming Transactions.
8. Can you provide examples of recent developments in the market?
June 2024: Microsoft unveiled an all-digital variant of its Xbox Series X and S consoles alongside previews for over a dozen games, notably the next "Call of Duty" installment. The tech giant showcased not just one but three consoles: a disc-less iteration of the Xbox Series X and S and a premium Series X model boasting a capacious 2-terabyte storage.
9. What pricing options are available for accessing the report?
Pricing options include single-user, multi-user, and enterprise licenses priced at USD 4750, USD 5250, and USD 8750 respectively.
10. Is the market size provided in terms of value or volume?
The market size is provided in terms of value, measured in Million.
11. Are there any specific market keywords associated with the report?
Yes, the market keyword associated with the report is "Gaming Market," which aids in identifying and referencing the specific market segment covered.
12. How do I determine which pricing option suits my needs best?
The pricing options vary based on user requirements and access needs. Individual users may opt for single-user licenses, while businesses requiring broader access may choose multi-user or enterprise licenses for cost-effective access to the report.
13. Are there any additional resources or data provided in the Gaming Market report?
While the report offers comprehensive insights, it's advisable to review the specific contents or supplementary materials provided to ascertain if additional resources or data are available.
14. How can I stay updated on further developments or reports in the Gaming Market?
To stay informed about further developments, trends, and reports in the Gaming Market, consider subscribing to industry newsletters, following relevant companies and organizations, or regularly checking reputable industry news sources and publications.
Methodology
Step 1 - Identification of Relevant Samples Size from Population Database


Step 2 - Approaches for Defining Global Market Size (Value, Volume* & Price*)

Note*: In applicable scenarios
Step 3 - Data Sources
Primary Research
- Web Analytics
- Survey Reports
- Research Institute
- Latest Research Reports
- Opinion Leaders
Secondary Research
- Annual Reports
- White Paper
- Latest Press Release
- Industry Association
- Paid Database
- Investor Presentations

Step 4 - Data Triangulation
Involves using different sources of information in order to increase the validity of a study
These sources are likely to be stakeholders in a program - participants, other researchers, program staff, other community members, and so on.
Then we put all data in single framework & apply various statistical tools to find out the dynamic on the market.
During the analysis stage, feedback from the stakeholder groups would be compared to determine areas of agreement as well as areas of divergence


