
Key Insights
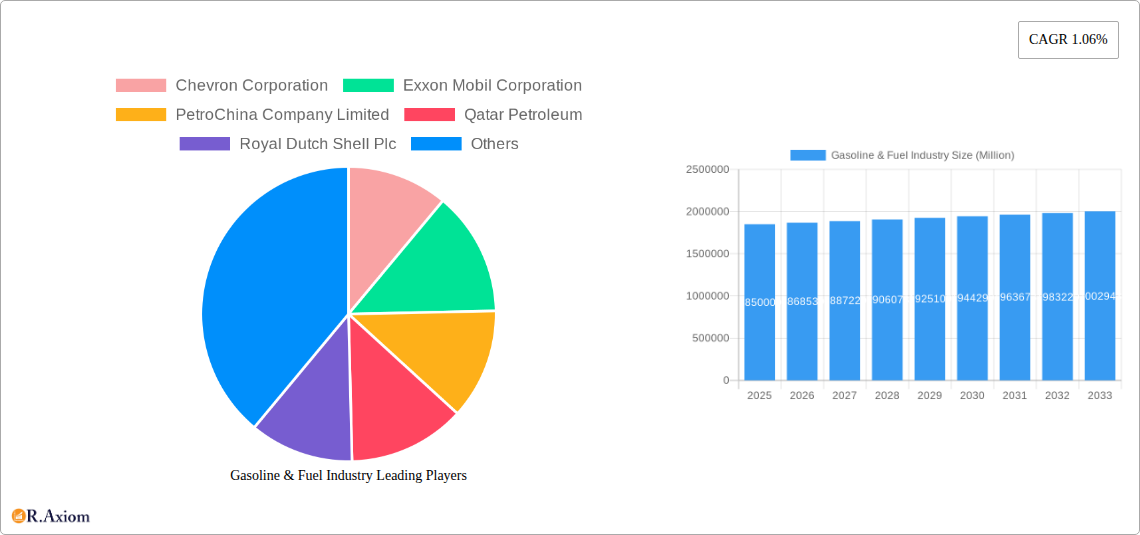
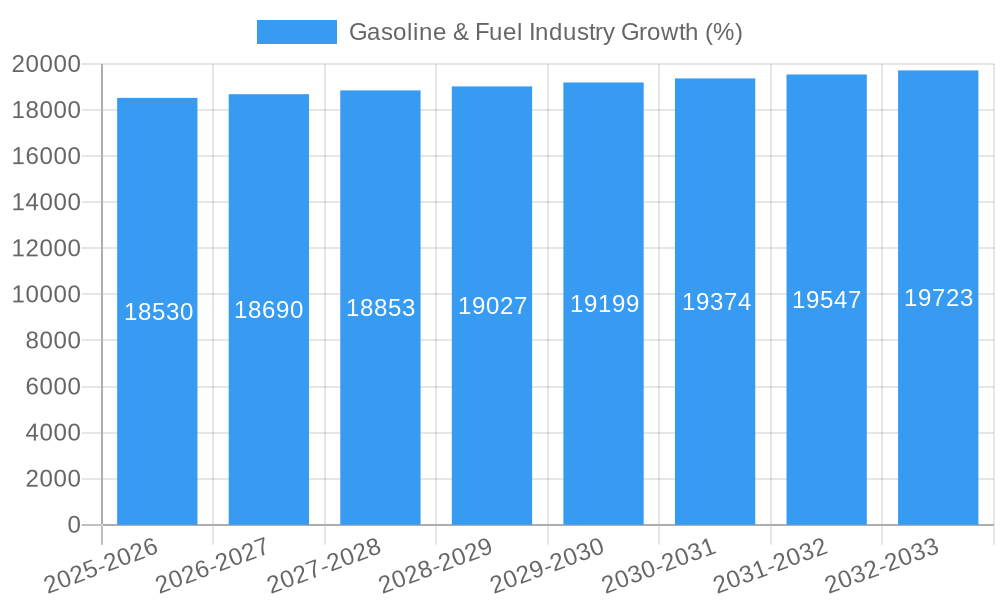
The global gasoline and fuel market, valued at $1.85 trillion in 2025, is projected to experience steady growth, driven primarily by increasing global vehicle ownership, particularly in developing economies. The Compound Annual Growth Rate (CAGR) of 1.06% over the forecast period (2025-2033) indicates a relatively stable market, influenced by factors such as fluctuating oil prices, government regulations aimed at reducing carbon emissions, and the gradual adoption of alternative fuel vehicles. Major players like Chevron, ExxonMobil, and Saudi Aramco continue to dominate the market, leveraging their extensive refining and distribution networks. However, the industry faces challenges including pressure to transition towards cleaner energy sources, increasing environmental concerns leading to stricter emission standards, and geopolitical instability impacting oil supply chains. The market segmentation (data not provided) likely includes various fuel types (gasoline, diesel, jet fuel), geographical regions, and distribution channels (retail, wholesale, etc.). The growth trajectory suggests a continued reliance on traditional fuels in the short-to-medium term, with the long-term outlook significantly influenced by the pace of the energy transition and technological advancements in alternative fuels.
While the overall growth is moderate, specific segments within the gasoline and fuel market may exhibit varying growth rates. For example, the demand for high-octane gasoline might increase due to the proliferation of high-performance vehicles. Conversely, the demand for diesel fuel might experience slower growth due to stricter emission norms and increased adoption of electric vehicles in certain regions. Regional variations are also expected, with developing economies showing potentially higher growth rates compared to mature markets. The competitive landscape is marked by intense rivalry amongst the major players, focusing on factors such as operational efficiency, cost optimization, and market share expansion. Successful companies will need to strategically balance their traditional fuel businesses with investments in renewable energy and alternative fuel technologies to ensure long-term sustainability and profitability.
Gasoline & Fuel Industry: A Comprehensive Market Analysis (2019-2033)
This in-depth report provides a comprehensive analysis of the global gasoline & fuel industry, covering market dynamics, key players, and future trends. The study period spans from 2019 to 2033, with 2025 as the base and estimated year. The report incorporates detailed forecasts from 2025 to 2033, analyzing historical data from 2019 to 2024. This report is invaluable for industry stakeholders, investors, and strategists seeking to navigate the complexities of this ever-evolving sector.
Gasoline & Fuel Industry Market Concentration & Innovation
The gasoline and fuel industry exhibits a high degree of concentration, with a few major players controlling a significant portion of the global market. Companies such as Chevron Corporation, Exxon Mobil Corporation, PetroChina Company Limited, Qatar Petroleum, Royal Dutch Shell Plc, Reliance Industries Ltd, Saudi Arabian Oil Co, SK energy Co Ltd, NK Rosneft' PAO, and BP plc collectively hold a market share exceeding xx%. This concentration stems from significant capital investments required for exploration, refining, and distribution. However, the industry is also characterized by ongoing innovation, driven by factors such as:
- Stringent environmental regulations: Governments worldwide are implementing stricter emission standards, pushing companies to invest in cleaner fuels and technologies.
- Technological advancements: The development of biofuels, synthetic fuels, and other alternative energy sources is transforming the industry landscape.
- Consumer preference shifts: Growing environmental awareness is driving demand for sustainable fuel options, creating opportunities for innovative companies.
- Mergers and Acquisitions (M&A): Significant M&A activity, with deal values totaling $xx Million in the past five years, further consolidates the industry and fosters innovation through resource integration. For example, the acquisition of X by Y in 2022 resulted in a market share shift of xx%.
Gasoline & Fuel Industry Industry Trends & Insights
The gasoline and fuel industry is undergoing a period of significant transformation, driven by several key trends. Global market growth is expected to reach a CAGR of xx% during the forecast period (2025-2033), primarily fueled by increasing global energy demand, particularly in developing economies. However, this growth is tempered by the increasing adoption of electric vehicles and the push for decarbonization. Key trends include:
- Rise of Electric Vehicles (EVs): The increasing adoption of EVs poses a significant challenge to traditional gasoline and diesel fuel demand, although the penetration rate remains at xx% in 2025, this is expected to increase to xx% by 2033.
- Growth of Biofuels and Renewable Fuels: The market for biofuels and renewable fuels is experiencing strong growth, driven by government incentives and growing environmental concerns. Market penetration of biofuels is projected to reach xx% by 2033.
- Technological Disruptions: Advancements in fuel efficiency technologies and the development of alternative fuels are reshaping the industry, leading to increased competition and innovation.
- Shifting Consumer Preferences: Consumers are becoming increasingly environmentally conscious, leading to increased demand for sustainable fuel options and influencing the industry towards greener practices.
- Geopolitical Instability: Geopolitical events and tensions continue to cause significant volatility in crude oil prices, affecting the profitability of fuel companies.
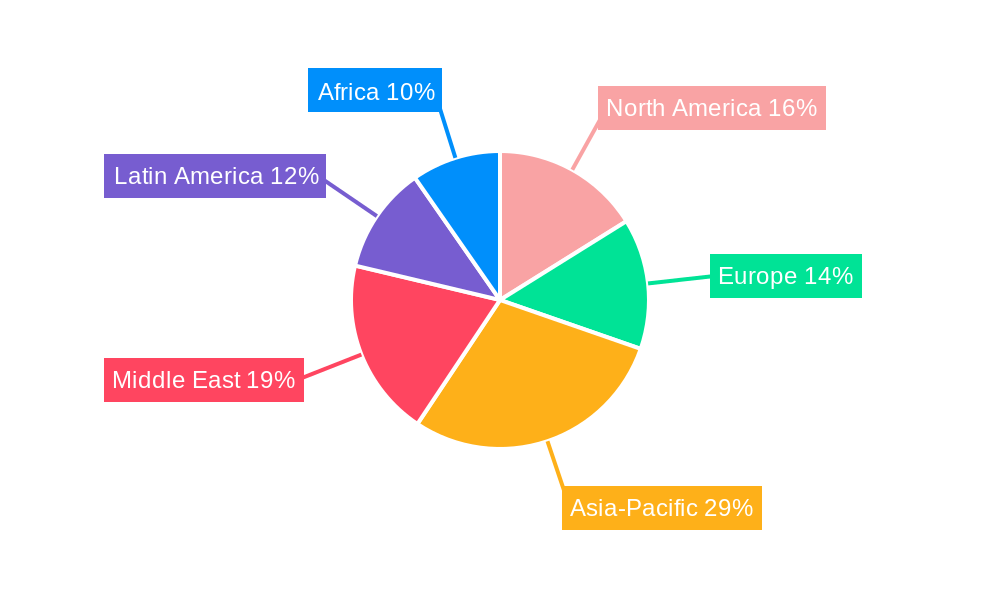
Dominant Markets & Segments in Gasoline & Fuel Industry
The gasoline and fuel industry is geographically diverse, with dominance varying across regions and segments.
- North America: North America remains a dominant market, driven by robust economic growth and high vehicle ownership. Key growth drivers include favorable government policies, developed infrastructure, and significant exploration and production activities.
- Asia-Pacific: The Asia-Pacific region is another key market with rapid growth projected, driven primarily by increasing urbanization, industrialization, and rising disposable incomes in developing economies. The region also benefits from substantial investments in infrastructure development.
- Europe: The European Union's stringent environmental regulations have affected the market significantly. The increasing share of renewable energy and electric vehicles, coupled with high taxes, leads to a slower growth rate compared to other regions.
- Middle East & Africa: This region remains a crucial player, primarily due to its substantial crude oil reserves and substantial production capacity.
Gasoline & Fuel Industry Product Developments
The industry is witnessing significant product innovation, focusing on enhancing fuel efficiency, reducing emissions, and developing alternative fuel sources. These developments include the introduction of higher-octane gasoline formulations, improved diesel blends, and the growth of biofuels like ethanol and biodiesel. Advancements in fuel additives are also improving engine performance and reducing emissions. The focus is on meeting stringent regulatory requirements and catering to shifting consumer preferences towards cleaner and more efficient fuel options.
Report Scope & Segmentation Analysis
This report segments the gasoline & fuel industry based on fuel type (gasoline, diesel, biofuels, others), application (automotive, industrial, aviation), and geography. Growth projections for each segment are provided, along with an in-depth analysis of market size and competitive dynamics. The competitive landscape is further analyzed by region, revealing key market players and their respective market shares.
Key Drivers of Gasoline & Fuel Industry Growth
Several factors fuel the growth of the gasoline and fuel industry. These include:
- Growing global energy demand: Rising global population and economic growth drive energy consumption, boosting demand for gasoline and other fuels.
- Increased vehicle ownership: The global vehicle fleet continues to expand, particularly in developing economies.
- Government policies and subsidies: Government support for the fuel industry through tax incentives and subsidies influences market growth. For example, the government subsidy of xx Million in 2024 for biofuel production significantly impacted market share.
Challenges in the Gasoline & Fuel Industry Sector
The industry faces several challenges:
- Environmental concerns and regulations: Stricter emission standards and regulations related to greenhouse gas emissions present a major hurdle for traditional fuel producers.
- Price volatility: Fluctuations in crude oil prices significantly impact profitability and investment decisions. The price volatility cost the industry an estimated $xx Million in 2023 alone.
- Competition from alternative fuels: The rise of electric vehicles and alternative fuels presents a significant competitive threat.
Emerging Opportunities in Gasoline & Fuel Industry
Despite the challenges, several opportunities exist:
- Growing demand for cleaner fuels: The increasing demand for biofuels, synthetic fuels, and other sustainable alternatives creates opportunities for innovation and growth.
- Technological advancements in fuel efficiency: Developments in fuel technology, such as fuel additives and engine improvements, offer potential for enhancing fuel efficiency and reducing emissions.
- Expansion into new markets: Untapped markets in developing economies present significant growth potential.
Leading Players in the Gasoline & Fuel Industry Market
- Chevron Corporation
- Exxon Mobil Corporation
- PetroChina Company Limited
- Qatar Petroleum
- Royal Dutch Shell Plc
- Reliance Industries Ltd
- Saudi Arabian Oil Co
- SK energy Co Ltd
- NK Rosneft' PAO
- BP plc
- *List Not Exhaustive
Key Developments in Gasoline & Fuel Industry Industry
- October 2023: Aramco and ENOWA signed a joint development agreement to build a synthetic electro-fuel demonstration plant, aiming to produce 35 barrels per day of low-carbon synthetic gasoline. This signifies a significant move towards sustainable fuel production.
- July 2022: The U.S. Department of Energy awarded contracts for the purchase of 1 Million barrels of crude oil per day for six months from the Strategic Petroleum Reserve to address the global supply disruption caused by the Russia-Ukraine war. This highlights the impact of geopolitical events on market dynamics.
Strategic Outlook for Gasoline & Fuel Industry Market
The future of the gasoline & fuel industry hinges on adapting to evolving consumer preferences and stringent environmental regulations. Growth will be driven by technological advancements in cleaner fuels, and strategic partnerships will play a crucial role in navigating the challenges and capturing emerging opportunities. Investment in research and development, coupled with sustainable practices, will be key to long-term success. The market is poised for growth, though at a moderate pace, with the focus shifting towards sustainable and environmentally responsible practices.
Gasoline & Fuel Industry Segmentation
-
1. End-User
- 1.1. Transporation
- 1.2. Power Generation
- 1.3. Others
Gasoline & Fuel Industry Segmentation By Geography
-
1. North America
- 1.1. United States
- 1.2. Canada
- 1.3. Rest of North America
-
2. Europe
- 2.1. Germany
- 2.2. France
- 2.3. United Kingdom
- 2.4. Rest of Europe
-
3. Asia Pacific
- 3.1. China
- 3.2. India
- 3.3. Japan
- 3.4. South Korea
- 3.5. Rest of Asia Pacific
-
4. South America
- 4.1. Brazil
- 4.2. Argentina
- 4.3. Rest of South America
-
5. Middle East and Africa
- 5.1. Saudi Arabia
- 5.2. United Arab Emirates
- 5.3. South Africa
- 5.4. Rest of Middle East and Africa
Gasoline & Fuel Industry REPORT HIGHLIGHTS
| Aspects | Details |
|---|---|
| Study Period | 2019-2033 |
| Base Year | 2024 |
| Estimated Year | 2025 |
| Forecast Period | 2025-2033 |
| Historical Period | 2019-2024 |
| Growth Rate | CAGR of 1.06% from 2019-2033 |
| Segmentation |
|
Table of Contents
- 1. Introduction
- 1.1. Research Scope
- 1.2. Market Segmentation
- 1.3. Research Methodology
- 1.4. Definitions and Assumptions
- 2. Executive Summary
- 2.1. Introduction
- 3. Market Dynamics
- 3.1. Introduction
- 3.2. Market Drivers
- 3.2.1 4.; Rising Adoption of Automobiles such as Passenger Cars
- 3.2.2 Motorcycles Across the World4.; Easy Availability of Gasoline
- 3.3. Market Restrains
- 3.3.1 4.; Rising Adoption of Automobiles such as Passenger Cars
- 3.3.2 Motorcycles Across the World4.; Easy Availability of Gasoline
- 3.4. Market Trends
- 3.4.1. Transportation Segment is Expected to Dominate in the Market
- 4. Market Factor Analysis
- 4.1. Porters Five Forces
- 4.2. Supply/Value Chain
- 4.3. PESTEL analysis
- 4.4. Market Entropy
- 4.5. Patent/Trademark Analysis
- 5. Global Gasoline & Fuel Industry Analysis, Insights and Forecast, 2019-2031
- 5.1. Market Analysis, Insights and Forecast - by End-User
- 5.1.1. Transporation
- 5.1.2. Power Generation
- 5.1.3. Others
- 5.2. Market Analysis, Insights and Forecast - by Region
- 5.2.1. North America
- 5.2.2. Europe
- 5.2.3. Asia Pacific
- 5.2.4. South America
- 5.2.5. Middle East and Africa
- 5.1. Market Analysis, Insights and Forecast - by End-User
- 6. North America Gasoline & Fuel Industry Analysis, Insights and Forecast, 2019-2031
- 6.1. Market Analysis, Insights and Forecast - by End-User
- 6.1.1. Transporation
- 6.1.2. Power Generation
- 6.1.3. Others
- 6.1. Market Analysis, Insights and Forecast - by End-User
- 7. Europe Gasoline & Fuel Industry Analysis, Insights and Forecast, 2019-2031
- 7.1. Market Analysis, Insights and Forecast - by End-User
- 7.1.1. Transporation
- 7.1.2. Power Generation
- 7.1.3. Others
- 7.1. Market Analysis, Insights and Forecast - by End-User
- 8. Asia Pacific Gasoline & Fuel Industry Analysis, Insights and Forecast, 2019-2031
- 8.1. Market Analysis, Insights and Forecast - by End-User
- 8.1.1. Transporation
- 8.1.2. Power Generation
- 8.1.3. Others
- 8.1. Market Analysis, Insights and Forecast - by End-User
- 9. South America Gasoline & Fuel Industry Analysis, Insights and Forecast, 2019-2031
- 9.1. Market Analysis, Insights and Forecast - by End-User
- 9.1.1. Transporation
- 9.1.2. Power Generation
- 9.1.3. Others
- 9.1. Market Analysis, Insights and Forecast - by End-User
- 10. Middle East and Africa Gasoline & Fuel Industry Analysis, Insights and Forecast, 2019-2031
- 10.1. Market Analysis, Insights and Forecast - by End-User
- 10.1.1. Transporation
- 10.1.2. Power Generation
- 10.1.3. Others
- 10.1. Market Analysis, Insights and Forecast - by End-User
- 11. Competitive Analysis
- 11.1. Global Market Share Analysis 2024
- 11.2. Company Profiles
- 11.2.1 Chevron Corporation
- 11.2.1.1. Overview
- 11.2.1.2. Products
- 11.2.1.3. SWOT Analysis
- 11.2.1.4. Recent Developments
- 11.2.1.5. Financials (Based on Availability)
- 11.2.2 Exxon Mobil Corporation
- 11.2.2.1. Overview
- 11.2.2.2. Products
- 11.2.2.3. SWOT Analysis
- 11.2.2.4. Recent Developments
- 11.2.2.5. Financials (Based on Availability)
- 11.2.3 PetroChina Company Limited
- 11.2.3.1. Overview
- 11.2.3.2. Products
- 11.2.3.3. SWOT Analysis
- 11.2.3.4. Recent Developments
- 11.2.3.5. Financials (Based on Availability)
- 11.2.4 Qatar Petroleum
- 11.2.4.1. Overview
- 11.2.4.2. Products
- 11.2.4.3. SWOT Analysis
- 11.2.4.4. Recent Developments
- 11.2.4.5. Financials (Based on Availability)
- 11.2.5 Royal Dutch Shell Plc
- 11.2.5.1. Overview
- 11.2.5.2. Products
- 11.2.5.3. SWOT Analysis
- 11.2.5.4. Recent Developments
- 11.2.5.5. Financials (Based on Availability)
- 11.2.6 Reliance Industries Ltd
- 11.2.6.1. Overview
- 11.2.6.2. Products
- 11.2.6.3. SWOT Analysis
- 11.2.6.4. Recent Developments
- 11.2.6.5. Financials (Based on Availability)
- 11.2.7 Saudi Arabian Oil Co
- 11.2.7.1. Overview
- 11.2.7.2. Products
- 11.2.7.3. SWOT Analysis
- 11.2.7.4. Recent Developments
- 11.2.7.5. Financials (Based on Availability)
- 11.2.8 SK energy Co Ltd
- 11.2.8.1. Overview
- 11.2.8.2. Products
- 11.2.8.3. SWOT Analysis
- 11.2.8.4. Recent Developments
- 11.2.8.5. Financials (Based on Availability)
- 11.2.9 NK Rosneft' PAO
- 11.2.9.1. Overview
- 11.2.9.2. Products
- 11.2.9.3. SWOT Analysis
- 11.2.9.4. Recent Developments
- 11.2.9.5. Financials (Based on Availability)
- 11.2.10 BP plc*List Not Exhaustive
- 11.2.10.1. Overview
- 11.2.10.2. Products
- 11.2.10.3. SWOT Analysis
- 11.2.10.4. Recent Developments
- 11.2.10.5. Financials (Based on Availability)
- 11.2.1 Chevron Corporation
List of Figures
- Figure 1: Global Gasoline & Fuel Industry Revenue Breakdown (Million, %) by Region 2024 & 2032
- Figure 2: Global Gasoline & Fuel Industry Volume Breakdown (Trillion, %) by Region 2024 & 2032
- Figure 3: North America Gasoline & Fuel Industry Revenue (Million), by End-User 2024 & 2032
- Figure 4: North America Gasoline & Fuel Industry Volume (Trillion), by End-User 2024 & 2032
- Figure 5: North America Gasoline & Fuel Industry Revenue Share (%), by End-User 2024 & 2032
- Figure 6: North America Gasoline & Fuel Industry Volume Share (%), by End-User 2024 & 2032
- Figure 7: North America Gasoline & Fuel Industry Revenue (Million), by Country 2024 & 2032
- Figure 8: North America Gasoline & Fuel Industry Volume (Trillion), by Country 2024 & 2032
- Figure 9: North America Gasoline & Fuel Industry Revenue Share (%), by Country 2024 & 2032
- Figure 10: North America Gasoline & Fuel Industry Volume Share (%), by Country 2024 & 2032
- Figure 11: Europe Gasoline & Fuel Industry Revenue (Million), by End-User 2024 & 2032
- Figure 12: Europe Gasoline & Fuel Industry Volume (Trillion), by End-User 2024 & 2032
- Figure 13: Europe Gasoline & Fuel Industry Revenue Share (%), by End-User 2024 & 2032
- Figure 14: Europe Gasoline & Fuel Industry Volume Share (%), by End-User 2024 & 2032
- Figure 15: Europe Gasoline & Fuel Industry Revenue (Million), by Country 2024 & 2032
- Figure 16: Europe Gasoline & Fuel Industry Volume (Trillion), by Country 2024 & 2032
- Figure 17: Europe Gasoline & Fuel Industry Revenue Share (%), by Country 2024 & 2032
- Figure 18: Europe Gasoline & Fuel Industry Volume Share (%), by Country 2024 & 2032
- Figure 19: Asia Pacific Gasoline & Fuel Industry Revenue (Million), by End-User 2024 & 2032
- Figure 20: Asia Pacific Gasoline & Fuel Industry Volume (Trillion), by End-User 2024 & 2032
- Figure 21: Asia Pacific Gasoline & Fuel Industry Revenue Share (%), by End-User 2024 & 2032
- Figure 22: Asia Pacific Gasoline & Fuel Industry Volume Share (%), by End-User 2024 & 2032
- Figure 23: Asia Pacific Gasoline & Fuel Industry Revenue (Million), by Country 2024 & 2032
- Figure 24: Asia Pacific Gasoline & Fuel Industry Volume (Trillion), by Country 2024 & 2032
- Figure 25: Asia Pacific Gasoline & Fuel Industry Revenue Share (%), by Country 2024 & 2032
- Figure 26: Asia Pacific Gasoline & Fuel Industry Volume Share (%), by Country 2024 & 2032
- Figure 27: South America Gasoline & Fuel Industry Revenue (Million), by End-User 2024 & 2032
- Figure 28: South America Gasoline & Fuel Industry Volume (Trillion), by End-User 2024 & 2032
- Figure 29: South America Gasoline & Fuel Industry Revenue Share (%), by End-User 2024 & 2032
- Figure 30: South America Gasoline & Fuel Industry Volume Share (%), by End-User 2024 & 2032
- Figure 31: South America Gasoline & Fuel Industry Revenue (Million), by Country 2024 & 2032
- Figure 32: South America Gasoline & Fuel Industry Volume (Trillion), by Country 2024 & 2032
- Figure 33: South America Gasoline & Fuel Industry Revenue Share (%), by Country 2024 & 2032
- Figure 34: South America Gasoline & Fuel Industry Volume Share (%), by Country 2024 & 2032
- Figure 35: Middle East and Africa Gasoline & Fuel Industry Revenue (Million), by End-User 2024 & 2032
- Figure 36: Middle East and Africa Gasoline & Fuel Industry Volume (Trillion), by End-User 2024 & 2032
- Figure 37: Middle East and Africa Gasoline & Fuel Industry Revenue Share (%), by End-User 2024 & 2032
- Figure 38: Middle East and Africa Gasoline & Fuel Industry Volume Share (%), by End-User 2024 & 2032
- Figure 39: Middle East and Africa Gasoline & Fuel Industry Revenue (Million), by Country 2024 & 2032
- Figure 40: Middle East and Africa Gasoline & Fuel Industry Volume (Trillion), by Country 2024 & 2032
- Figure 41: Middle East and Africa Gasoline & Fuel Industry Revenue Share (%), by Country 2024 & 2032
- Figure 42: Middle East and Africa Gasoline & Fuel Industry Volume Share (%), by Country 2024 & 2032
List of Tables
- Table 1: Global Gasoline & Fuel Industry Revenue Million Forecast, by Region 2019 & 2032
- Table 2: Global Gasoline & Fuel Industry Volume Trillion Forecast, by Region 2019 & 2032
- Table 3: Global Gasoline & Fuel Industry Revenue Million Forecast, by End-User 2019 & 2032
- Table 4: Global Gasoline & Fuel Industry Volume Trillion Forecast, by End-User 2019 & 2032
- Table 5: Global Gasoline & Fuel Industry Revenue Million Forecast, by Region 2019 & 2032
- Table 6: Global Gasoline & Fuel Industry Volume Trillion Forecast, by Region 2019 & 2032
- Table 7: Global Gasoline & Fuel Industry Revenue Million Forecast, by End-User 2019 & 2032
- Table 8: Global Gasoline & Fuel Industry Volume Trillion Forecast, by End-User 2019 & 2032
- Table 9: Global Gasoline & Fuel Industry Revenue Million Forecast, by Country 2019 & 2032
- Table 10: Global Gasoline & Fuel Industry Volume Trillion Forecast, by Country 2019 & 2032
- Table 11: United States Gasoline & Fuel Industry Revenue (Million) Forecast, by Application 2019 & 2032
- Table 12: United States Gasoline & Fuel Industry Volume (Trillion) Forecast, by Application 2019 & 2032
- Table 13: Canada Gasoline & Fuel Industry Revenue (Million) Forecast, by Application 2019 & 2032
- Table 14: Canada Gasoline & Fuel Industry Volume (Trillion) Forecast, by Application 2019 & 2032
- Table 15: Rest of North America Gasoline & Fuel Industry Revenue (Million) Forecast, by Application 2019 & 2032
- Table 16: Rest of North America Gasoline & Fuel Industry Volume (Trillion) Forecast, by Application 2019 & 2032
- Table 17: Global Gasoline & Fuel Industry Revenue Million Forecast, by End-User 2019 & 2032
- Table 18: Global Gasoline & Fuel Industry Volume Trillion Forecast, by End-User 2019 & 2032
- Table 19: Global Gasoline & Fuel Industry Revenue Million Forecast, by Country 2019 & 2032
- Table 20: Global Gasoline & Fuel Industry Volume Trillion Forecast, by Country 2019 & 2032
- Table 21: Germany Gasoline & Fuel Industry Revenue (Million) Forecast, by Application 2019 & 2032
- Table 22: Germany Gasoline & Fuel Industry Volume (Trillion) Forecast, by Application 2019 & 2032
- Table 23: France Gasoline & Fuel Industry Revenue (Million) Forecast, by Application 2019 & 2032
- Table 24: France Gasoline & Fuel Industry Volume (Trillion) Forecast, by Application 2019 & 2032
- Table 25: United Kingdom Gasoline & Fuel Industry Revenue (Million) Forecast, by Application 2019 & 2032
- Table 26: United Kingdom Gasoline & Fuel Industry Volume (Trillion) Forecast, by Application 2019 & 2032
- Table 27: Rest of Europe Gasoline & Fuel Industry Revenue (Million) Forecast, by Application 2019 & 2032
- Table 28: Rest of Europe Gasoline & Fuel Industry Volume (Trillion) Forecast, by Application 2019 & 2032
- Table 29: Global Gasoline & Fuel Industry Revenue Million Forecast, by End-User 2019 & 2032
- Table 30: Global Gasoline & Fuel Industry Volume Trillion Forecast, by End-User 2019 & 2032
- Table 31: Global Gasoline & Fuel Industry Revenue Million Forecast, by Country 2019 & 2032
- Table 32: Global Gasoline & Fuel Industry Volume Trillion Forecast, by Country 2019 & 2032
- Table 33: China Gasoline & Fuel Industry Revenue (Million) Forecast, by Application 2019 & 2032
- Table 34: China Gasoline & Fuel Industry Volume (Trillion) Forecast, by Application 2019 & 2032
- Table 35: India Gasoline & Fuel Industry Revenue (Million) Forecast, by Application 2019 & 2032
- Table 36: India Gasoline & Fuel Industry Volume (Trillion) Forecast, by Application 2019 & 2032
- Table 37: Japan Gasoline & Fuel Industry Revenue (Million) Forecast, by Application 2019 & 2032
- Table 38: Japan Gasoline & Fuel Industry Volume (Trillion) Forecast, by Application 2019 & 2032
- Table 39: South Korea Gasoline & Fuel Industry Revenue (Million) Forecast, by Application 2019 & 2032
- Table 40: South Korea Gasoline & Fuel Industry Volume (Trillion) Forecast, by Application 2019 & 2032
- Table 41: Rest of Asia Pacific Gasoline & Fuel Industry Revenue (Million) Forecast, by Application 2019 & 2032
- Table 42: Rest of Asia Pacific Gasoline & Fuel Industry Volume (Trillion) Forecast, by Application 2019 & 2032
- Table 43: Global Gasoline & Fuel Industry Revenue Million Forecast, by End-User 2019 & 2032
- Table 44: Global Gasoline & Fuel Industry Volume Trillion Forecast, by End-User 2019 & 2032
- Table 45: Global Gasoline & Fuel Industry Revenue Million Forecast, by Country 2019 & 2032
- Table 46: Global Gasoline & Fuel Industry Volume Trillion Forecast, by Country 2019 & 2032
- Table 47: Brazil Gasoline & Fuel Industry Revenue (Million) Forecast, by Application 2019 & 2032
- Table 48: Brazil Gasoline & Fuel Industry Volume (Trillion) Forecast, by Application 2019 & 2032
- Table 49: Argentina Gasoline & Fuel Industry Revenue (Million) Forecast, by Application 2019 & 2032
- Table 50: Argentina Gasoline & Fuel Industry Volume (Trillion) Forecast, by Application 2019 & 2032
- Table 51: Rest of South America Gasoline & Fuel Industry Revenue (Million) Forecast, by Application 2019 & 2032
- Table 52: Rest of South America Gasoline & Fuel Industry Volume (Trillion) Forecast, by Application 2019 & 2032
- Table 53: Global Gasoline & Fuel Industry Revenue Million Forecast, by End-User 2019 & 2032
- Table 54: Global Gasoline & Fuel Industry Volume Trillion Forecast, by End-User 2019 & 2032
- Table 55: Global Gasoline & Fuel Industry Revenue Million Forecast, by Country 2019 & 2032
- Table 56: Global Gasoline & Fuel Industry Volume Trillion Forecast, by Country 2019 & 2032
- Table 57: Saudi Arabia Gasoline & Fuel Industry Revenue (Million) Forecast, by Application 2019 & 2032
- Table 58: Saudi Arabia Gasoline & Fuel Industry Volume (Trillion) Forecast, by Application 2019 & 2032
- Table 59: United Arab Emirates Gasoline & Fuel Industry Revenue (Million) Forecast, by Application 2019 & 2032
- Table 60: United Arab Emirates Gasoline & Fuel Industry Volume (Trillion) Forecast, by Application 2019 & 2032
- Table 61: South Africa Gasoline & Fuel Industry Revenue (Million) Forecast, by Application 2019 & 2032
- Table 62: South Africa Gasoline & Fuel Industry Volume (Trillion) Forecast, by Application 2019 & 2032
- Table 63: Rest of Middle East and Africa Gasoline & Fuel Industry Revenue (Million) Forecast, by Application 2019 & 2032
- Table 64: Rest of Middle East and Africa Gasoline & Fuel Industry Volume (Trillion) Forecast, by Application 2019 & 2032
Frequently Asked Questions
1. What is the projected Compound Annual Growth Rate (CAGR) of the Gasoline & Fuel Industry?
The projected CAGR is approximately 1.06%.
2. Which companies are prominent players in the Gasoline & Fuel Industry?
Key companies in the market include Chevron Corporation, Exxon Mobil Corporation, PetroChina Company Limited, Qatar Petroleum, Royal Dutch Shell Plc, Reliance Industries Ltd, Saudi Arabian Oil Co, SK energy Co Ltd, NK Rosneft' PAO, BP plc*List Not Exhaustive.
3. What are the main segments of the Gasoline & Fuel Industry?
The market segments include End-User.
4. Can you provide details about the market size?
The market size is estimated to be USD 1.85 Million as of 2022.
5. What are some drivers contributing to market growth?
4.; Rising Adoption of Automobiles such as Passenger Cars. Motorcycles Across the World4.; Easy Availability of Gasoline.
6. What are the notable trends driving market growth?
Transportation Segment is Expected to Dominate in the Market.
7. Are there any restraints impacting market growth?
4.; Rising Adoption of Automobiles such as Passenger Cars. Motorcycles Across the World4.; Easy Availability of Gasoline.
8. Can you provide examples of recent developments in the market?
In October 2023, Aramco and ENOWA, NEOM’s energy and water company, have signed a joint development agreement to construct and establish a first-of-its-kind synthetic electro-fuel (e-fuel) demonstration plant aimed to display technological feasibility and commercial viability by developing thirty five barrels per day of low-carbon, synthetic gasoline from renewable-based hydrogen and captured carbon dioxide (CO2).
9. What pricing options are available for accessing the report?
Pricing options include single-user, multi-user, and enterprise licenses priced at USD 4750, USD 5250, and USD 8750 respectively.
10. Is the market size provided in terms of value or volume?
The market size is provided in terms of value, measured in Million and volume, measured in Trillion.
11. Are there any specific market keywords associated with the report?
Yes, the market keyword associated with the report is "Gasoline & Fuel Industry," which aids in identifying and referencing the specific market segment covered.
12. How do I determine which pricing option suits my needs best?
The pricing options vary based on user requirements and access needs. Individual users may opt for single-user licenses, while businesses requiring broader access may choose multi-user or enterprise licenses for cost-effective access to the report.
13. Are there any additional resources or data provided in the Gasoline & Fuel Industry report?
While the report offers comprehensive insights, it's advisable to review the specific contents or supplementary materials provided to ascertain if additional resources or data are available.
14. How can I stay updated on further developments or reports in the Gasoline & Fuel Industry?
To stay informed about further developments, trends, and reports in the Gasoline & Fuel Industry, consider subscribing to industry newsletters, following relevant companies and organizations, or regularly checking reputable industry news sources and publications.
Methodology
Step 1 - Identification of Relevant Samples Size from Population Database


Step 2 - Approaches for Defining Global Market Size (Value, Volume* & Price*)

Note*: In applicable scenarios
Step 3 - Data Sources
Primary Research
- Web Analytics
- Survey Reports
- Research Institute
- Latest Research Reports
- Opinion Leaders
Secondary Research
- Annual Reports
- White Paper
- Latest Press Release
- Industry Association
- Paid Database
- Investor Presentations

Step 4 - Data Triangulation
Involves using different sources of information in order to increase the validity of a study
These sources are likely to be stakeholders in a program - participants, other researchers, program staff, other community members, and so on.
Then we put all data in single framework & apply various statistical tools to find out the dynamic on the market.
During the analysis stage, feedback from the stakeholder groups would be compared to determine areas of agreement as well as areas of divergence


