
Key Insights
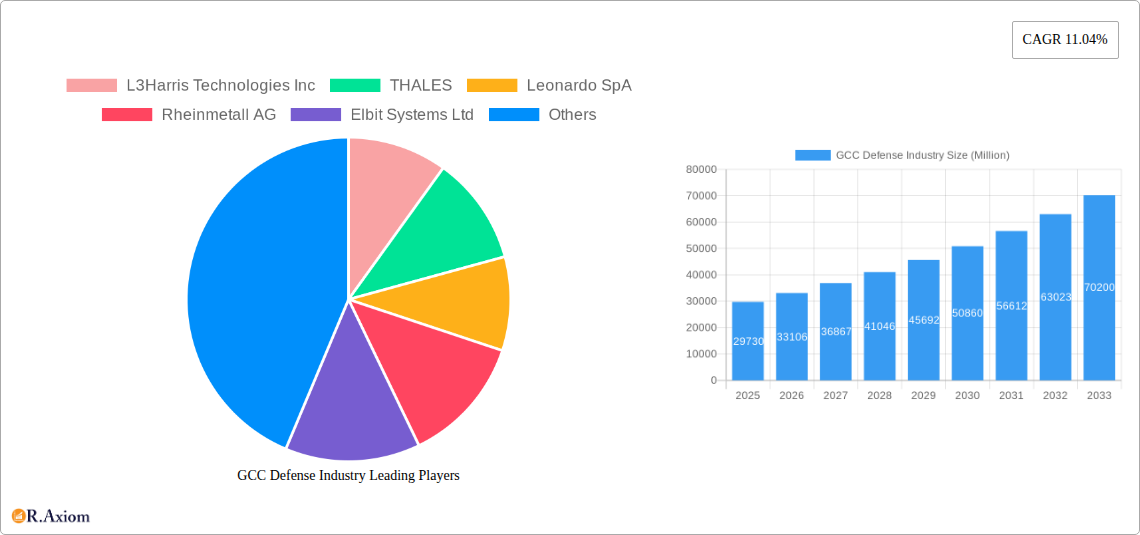
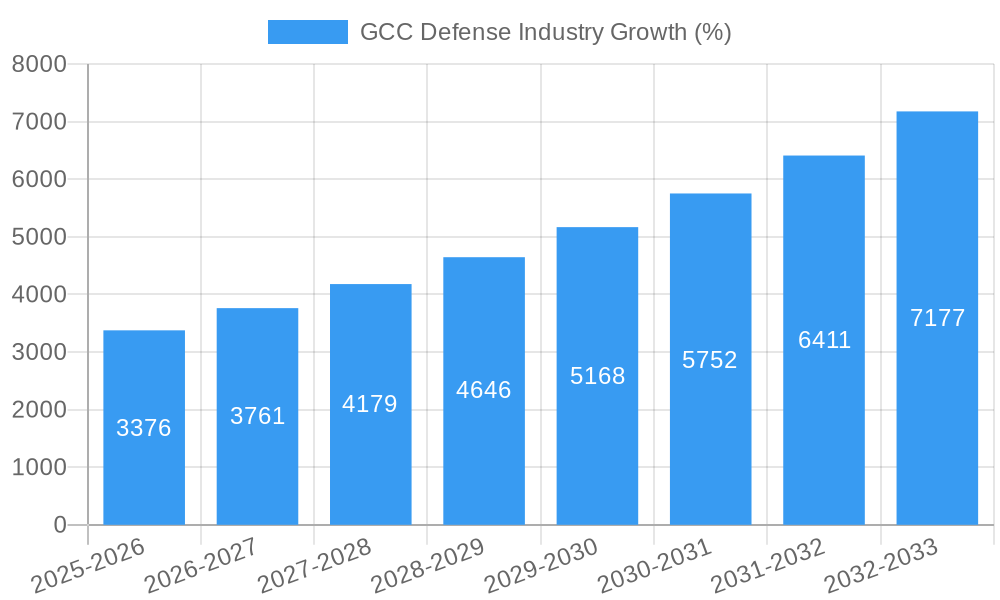
The GCC (Gulf Cooperation Council) defense industry is experiencing robust growth, projected to reach a market size of $29.73 billion in 2025 and maintain a Compound Annual Growth Rate (CAGR) of 11.04% from 2025 to 2033. This expansion is driven by several key factors. Geopolitical instability in the region necessitates increased defense spending, particularly in areas like advanced weaponry, cybersecurity, and personnel training. The modernization of armed forces across the GCC nations, including the army, navy, and air force, further fuels market growth. Technological advancements in areas such as unmanned aerial vehicles (UAVs), communication systems, and protection equipment are also significant contributors. Furthermore, increased investment in domestic defense manufacturing capabilities and strategic partnerships with international defense contractors are shaping the market landscape. Growth is expected across all segments, with particular strength in communication systems, air-based vehicles (including UAVs and fighter jets), and sophisticated weapons and ammunition. However, potential economic fluctuations and global shifts in defense priorities could present challenges to sustained growth.
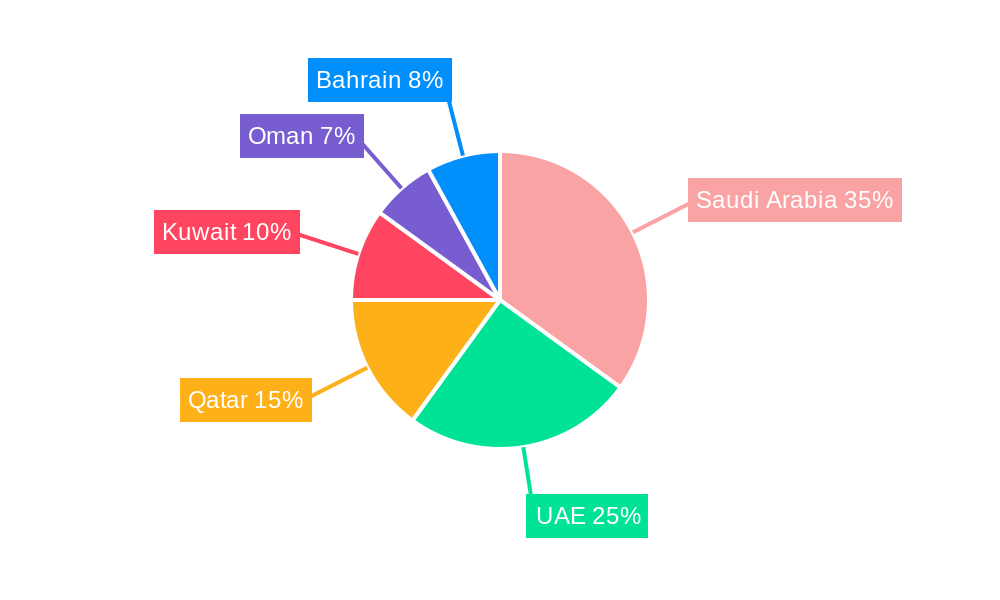
The segmentation of the market highlights the diverse needs of the GCC defense sector. The demand for personnel training and protection equipment is high, driven by the need for highly skilled and well-protected personnel. The significant investment in air-based vehicles signifies the importance of air superiority and strategic projection capabilities within the region’s defense strategies. The involvement of major international players like Lockheed Martin, Thales, and BAE Systems, alongside regional players like ASELSAN and EDGE Group, signifies the competitive nature of the industry and the opportunities for both established and emerging players. The regional breakdown – with Saudi Arabia, the UAE, and Qatar as leading spenders – indicates the concentration of market activity within these key nations. Ongoing investments in infrastructure and technology will likely continue to drive sustained growth over the forecast period.
GCC Defense Industry Market Report: 2019-2033
This comprehensive report provides an in-depth analysis of the GCC defense industry, covering market size, segmentation, key players, growth drivers, challenges, and future opportunities. The study period spans 2019-2033, with 2025 as the base and estimated year. The forecast period is 2025-2033, and the historical period is 2019-2024. This report is essential for industry stakeholders, investors, and government agencies seeking to understand the dynamics of this strategically important market. The total market value is estimated at xx Million in 2025 and is projected to reach xx Million by 2033.
GCC Defense Industry Market Concentration & Innovation
The GCC defense industry exhibits a concentrated market structure, with a few major multinational corporations holding significant market share. Companies like Lockheed Martin Corporation, THALES, BAE Systems PLC, and The Boeing Company dominate various segments. However, the rise of regional players like EDGE Group PJSC and Saudi Arabian Military Industries (SAMI) is gradually altering this landscape.
Market share is highly dependent on the specific segment, with some companies specializing in particular areas like air-based vehicles or communication systems. For instance, Lockheed Martin and Boeing hold substantial shares in the air-based vehicle segment, while Thales and L3Harris Technologies Inc. are prominent in communication systems. The estimated combined market share of the top 5 players in 2025 is xx%.
Innovation in the GCC defense industry is driven by several factors:
- Technological advancements: The constant drive for superior weaponry and defense systems fuels innovation in areas like AI, cybersecurity, and unmanned aerial vehicles.
- Geopolitical factors: Regional instability and security concerns create a high demand for advanced defense technologies, pushing companies to develop cutting-edge solutions.
- Government investments: Significant government spending on defense modernization and infrastructure development is another key driver of innovation.
- Mergers and Acquisitions (M&A): M&A activity plays a crucial role in consolidating market share and integrating new technologies. In the past five years, the total value of M&A deals in the GCC defense industry is estimated to be approximately xx Million. Examples include [mention specific recent M&A deals, if available, with deal values].
Regulatory frameworks vary across GCC countries, influencing innovation and market entry. The industry also faces the challenge of potential product substitutes and evolving end-user trends (e.g., increased focus on cybersecurity).
GCC Defense Industry Industry Trends & Insights
The GCC defense industry is experiencing robust growth, driven by several factors. The Compound Annual Growth Rate (CAGR) during the forecast period (2025-2033) is projected to be xx%. This growth is fueled by:
- Increased defense budgets: GCC countries consistently allocate substantial portions of their GDP to defense spending.
- Modernization efforts: A significant push towards modernizing armed forces and upgrading existing equipment is boosting market demand.
- Regional geopolitical uncertainties: The persistent security challenges in the region are a major driver of defense procurement.
- Technological advancements: The integration of new technologies, such as AI, big data, and autonomous systems, is transforming the defense landscape.
Technological disruptions, particularly in areas like cyber warfare and unmanned systems, are reshaping the competitive dynamics. Consumer preferences are shifting towards more sophisticated and integrated systems that offer superior performance and interoperability. The market is witnessing increased competition, particularly amongst multinational players and regional companies. Market penetration of advanced technologies varies significantly across segments, with higher penetration rates observed in communication systems and weapons and ammunition compared to personnel training and protection.
Dominant Markets & Segments in GCC Defense Industry
The Saudi Arabian defense market holds the most significant share within the GCC, followed by the UAE. This dominance is attributable to:
- High defense expenditure: Saudi Arabia and the UAE have consistently high defense budgets.
- Strategic geopolitical positioning: Their strategic location and geopolitical importance contribute to higher defense spending.
- Infrastructure development: Significant investments in military infrastructure further fuel the market's growth.
Among the segments, the Air-based Vehicles segment is currently the most dominant, particularly the Weapons and Ammunition sub-segment. This is due to the high demand for advanced fighter jets, helicopters, and associated weaponry.
- Key Drivers for Air-based Vehicles:
- Regional security concerns
- Modernization of air forces
- Technological advancements in aviation technology
The Protection Equipment segment, particularly Communication Systems, also shows strong growth potential due to the increasing need for secure and reliable communication infrastructure within armed forces.
- Key Drivers for Communication Systems:
- Network-centric warfare initiatives
- Increased emphasis on cybersecurity
- Advancements in satellite and communication technologies
The Army segment dominates the armed forces sector due to its size and the high demand for land-based equipment and weaponry. The Personnel Training and Protection segment is characterized by steady growth, driven by the need for enhanced personnel safety and effective training programs.
GCC Defense Industry Product Developments
Recent years have witnessed significant product innovations, focusing on enhancing capabilities and integrating advanced technologies. The focus is on developing autonomous systems, improving cybersecurity measures, and integrating AI into defense systems. These innovations cater to the evolving needs of the defense forces and provide companies with a competitive advantage in the market. The market is witnessing increased adoption of precision-guided munitions, drones, and advanced communication systems, reflecting global trends.
Report Scope & Segmentation Analysis
This report segments the GCC defense industry by:
Protection Equipment: This segment includes communication systems, vehicles, and other protective gear. Growth is driven by the need for advanced communication and protection systems. The market size is estimated at xx Million in 2025, with a projected CAGR of xx% during the forecast period. Competition is intense, with both international and regional companies vying for market share.
Air-based Vehicles: This segment encompasses aircraft, helicopters, and related weaponry. Growth is propelled by modernization programs and regional security concerns. The market size is estimated at xx Million in 2025, with a projected CAGR of xx% during the forecast period. Key players are Lockheed Martin, Boeing, and Airbus.
By Armed Forces: The market is segmented by Army, Navy, and Air Force. Each branch has specific procurement needs, leading to varying market dynamics.
By Type: This segment includes personnel training and protection, which shows steady growth driven by the emphasis on personnel safety and training effectiveness.
Key Drivers of GCC Defense Industry Growth
The GCC defense industry's growth is driven by several factors:
- High defense spending: Consistent allocation of significant portions of GDP to defense.
- Geopolitical instability: Regional security concerns drive demand for advanced defense systems.
- Modernization initiatives: Programs to upgrade armed forces and enhance capabilities.
- Technological advancements: The integration of AI, autonomous systems, and cyber warfare capabilities.
Challenges in the GCC Defense Industry Sector
The GCC defense industry faces several challenges:
- Economic fluctuations: Oil price volatility can impact defense budgets.
- Supply chain disruptions: Global events can affect the availability of components and technologies.
- Intense competition: Both international and regional companies compete fiercely.
- Regulatory hurdles: Navigating diverse regulatory frameworks across GCC countries can be complex.
Emerging Opportunities in GCC Defense Industry
Several opportunities exist for growth in the GCC defense industry:
- Cybersecurity: Growing demand for robust cybersecurity solutions for defense systems.
- Unmanned systems: The rising adoption of drones and other unmanned systems.
- AI integration: The integration of AI into defense systems and decision-making.
- Joint ventures and partnerships: Collaboration between international and regional companies.
Leading Players in the GCC Defense Industry Market
- L3Harris Technologies Inc
- THALES
- Leonardo SpA
- Rheinmetall AG
- Elbit Systems Ltd
- Lockheed Martin Corporation
- Airbus SE
- ASELSAN AS
- IAI
- BAE Systems PLC
- RTX Corporation
- Dahra Engineering & Security Services LLC
- EDGE Group PJSC
- Saudi Arabian Military Industries (SAMI)
- Northrop Grumman Corporation
- The Boeing Company
Key Developments in GCC Defense Industry Industry
February 2024: Lockheed Martin Corporation signed an agreement with Saudi Arabian companies to manufacture components of its Terminal High Altitude Area Defense (THAAD) missile defense system. This significantly boosts Lockheed Martin's presence in the regional market and strengthens Saudi Arabia's missile defense capabilities.
March 2023: Bahrain announced the expected delivery of the latest F-16s in 2024 and 2025. This strengthens Bahrain's air power and signifies continued investment in advanced military technology within the region.
Strategic Outlook for GCC Defense Industry Market
The GCC defense industry is poised for continued growth, driven by sustained high defense spending, regional security concerns, and ongoing modernization efforts. Opportunities exist in areas like cybersecurity, unmanned systems, and AI integration. The market will likely witness increased competition and a greater emphasis on technological innovation and strategic partnerships. The long-term outlook remains positive, with significant growth potential across various segments.
GCC Defense Industry Segmentation
-
1. Armed Forces
- 1.1. Army
- 1.2. Navy
- 1.3. Air Force
-
2. Type
-
2.1. Personnel Training and Protection
- 2.1.1. Training and Simulation
- 2.1.2. Protection Equipment
- 2.2. Communication Systems
-
2.3. Vehicles
- 2.3.1. Land-based Vehicles
- 2.3.2. Sea-based Vehicles
- 2.3.3. Air-based Vehicles
-
2.4. Weapons and Ammunition
- 2.4.1. Artillery and Mortar Systems
- 2.4.2. Infantry Weapons
- 2.4.3. Missiles and Missile Defense Systems
-
2.1. Personnel Training and Protection
-
3. Geography
- 3.1. Saudi Arabia
- 3.2. United Arab Emirates
- 3.3. Qatar
- 3.4. Kuwait
- 3.5. Bahrain
- 3.6. Oman
GCC Defense Industry Segmentation By Geography
- 1. Saudi Arabia
- 2. United Arab Emirates
- 3. Qatar
- 4. Kuwait
- 5. Bahrain
- 6. Oman
GCC Defense Industry REPORT HIGHLIGHTS
| Aspects | Details |
|---|---|
| Study Period | 2019-2033 |
| Base Year | 2024 |
| Estimated Year | 2025 |
| Forecast Period | 2025-2033 |
| Historical Period | 2019-2024 |
| Growth Rate | CAGR of 11.04% from 2019-2033 |
| Segmentation |
|
Table of Contents
- 1. Introduction
- 1.1. Research Scope
- 1.2. Market Segmentation
- 1.3. Research Methodology
- 1.4. Definitions and Assumptions
- 2. Executive Summary
- 2.1. Introduction
- 3. Market Dynamics
- 3.1. Introduction
- 3.2. Market Drivers
- 3.3. Market Restrains
- 3.4. Market Trends
- 3.4.1. Airforce Segment to Dominate Market Share During the Forecast Period
- 4. Market Factor Analysis
- 4.1. Porters Five Forces
- 4.2. Supply/Value Chain
- 4.3. PESTEL analysis
- 4.4. Market Entropy
- 4.5. Patent/Trademark Analysis
- 5. Global GCC Defense Industry Analysis, Insights and Forecast, 2019-2031
- 5.1. Market Analysis, Insights and Forecast - by Armed Forces
- 5.1.1. Army
- 5.1.2. Navy
- 5.1.3. Air Force
- 5.2. Market Analysis, Insights and Forecast - by Type
- 5.2.1. Personnel Training and Protection
- 5.2.1.1. Training and Simulation
- 5.2.1.2. Protection Equipment
- 5.2.2. Communication Systems
- 5.2.3. Vehicles
- 5.2.3.1. Land-based Vehicles
- 5.2.3.2. Sea-based Vehicles
- 5.2.3.3. Air-based Vehicles
- 5.2.4. Weapons and Ammunition
- 5.2.4.1. Artillery and Mortar Systems
- 5.2.4.2. Infantry Weapons
- 5.2.4.3. Missiles and Missile Defense Systems
- 5.2.1. Personnel Training and Protection
- 5.3. Market Analysis, Insights and Forecast - by Geography
- 5.3.1. Saudi Arabia
- 5.3.2. United Arab Emirates
- 5.3.3. Qatar
- 5.3.4. Kuwait
- 5.3.5. Bahrain
- 5.3.6. Oman
- 5.4. Market Analysis, Insights and Forecast - by Region
- 5.4.1. Saudi Arabia
- 5.4.2. United Arab Emirates
- 5.4.3. Qatar
- 5.4.4. Kuwait
- 5.4.5. Bahrain
- 5.4.6. Oman
- 5.1. Market Analysis, Insights and Forecast - by Armed Forces
- 6. Saudi Arabia GCC Defense Industry Analysis, Insights and Forecast, 2019-2031
- 6.1. Market Analysis, Insights and Forecast - by Armed Forces
- 6.1.1. Army
- 6.1.2. Navy
- 6.1.3. Air Force
- 6.2. Market Analysis, Insights and Forecast - by Type
- 6.2.1. Personnel Training and Protection
- 6.2.1.1. Training and Simulation
- 6.2.1.2. Protection Equipment
- 6.2.2. Communication Systems
- 6.2.3. Vehicles
- 6.2.3.1. Land-based Vehicles
- 6.2.3.2. Sea-based Vehicles
- 6.2.3.3. Air-based Vehicles
- 6.2.4. Weapons and Ammunition
- 6.2.4.1. Artillery and Mortar Systems
- 6.2.4.2. Infantry Weapons
- 6.2.4.3. Missiles and Missile Defense Systems
- 6.2.1. Personnel Training and Protection
- 6.3. Market Analysis, Insights and Forecast - by Geography
- 6.3.1. Saudi Arabia
- 6.3.2. United Arab Emirates
- 6.3.3. Qatar
- 6.3.4. Kuwait
- 6.3.5. Bahrain
- 6.3.6. Oman
- 6.1. Market Analysis, Insights and Forecast - by Armed Forces
- 7. United Arab Emirates GCC Defense Industry Analysis, Insights and Forecast, 2019-2031
- 7.1. Market Analysis, Insights and Forecast - by Armed Forces
- 7.1.1. Army
- 7.1.2. Navy
- 7.1.3. Air Force
- 7.2. Market Analysis, Insights and Forecast - by Type
- 7.2.1. Personnel Training and Protection
- 7.2.1.1. Training and Simulation
- 7.2.1.2. Protection Equipment
- 7.2.2. Communication Systems
- 7.2.3. Vehicles
- 7.2.3.1. Land-based Vehicles
- 7.2.3.2. Sea-based Vehicles
- 7.2.3.3. Air-based Vehicles
- 7.2.4. Weapons and Ammunition
- 7.2.4.1. Artillery and Mortar Systems
- 7.2.4.2. Infantry Weapons
- 7.2.4.3. Missiles and Missile Defense Systems
- 7.2.1. Personnel Training and Protection
- 7.3. Market Analysis, Insights and Forecast - by Geography
- 7.3.1. Saudi Arabia
- 7.3.2. United Arab Emirates
- 7.3.3. Qatar
- 7.3.4. Kuwait
- 7.3.5. Bahrain
- 7.3.6. Oman
- 7.1. Market Analysis, Insights and Forecast - by Armed Forces
- 8. Qatar GCC Defense Industry Analysis, Insights and Forecast, 2019-2031
- 8.1. Market Analysis, Insights and Forecast - by Armed Forces
- 8.1.1. Army
- 8.1.2. Navy
- 8.1.3. Air Force
- 8.2. Market Analysis, Insights and Forecast - by Type
- 8.2.1. Personnel Training and Protection
- 8.2.1.1. Training and Simulation
- 8.2.1.2. Protection Equipment
- 8.2.2. Communication Systems
- 8.2.3. Vehicles
- 8.2.3.1. Land-based Vehicles
- 8.2.3.2. Sea-based Vehicles
- 8.2.3.3. Air-based Vehicles
- 8.2.4. Weapons and Ammunition
- 8.2.4.1. Artillery and Mortar Systems
- 8.2.4.2. Infantry Weapons
- 8.2.4.3. Missiles and Missile Defense Systems
- 8.2.1. Personnel Training and Protection
- 8.3. Market Analysis, Insights and Forecast - by Geography
- 8.3.1. Saudi Arabia
- 8.3.2. United Arab Emirates
- 8.3.3. Qatar
- 8.3.4. Kuwait
- 8.3.5. Bahrain
- 8.3.6. Oman
- 8.1. Market Analysis, Insights and Forecast - by Armed Forces
- 9. Kuwait GCC Defense Industry Analysis, Insights and Forecast, 2019-2031
- 9.1. Market Analysis, Insights and Forecast - by Armed Forces
- 9.1.1. Army
- 9.1.2. Navy
- 9.1.3. Air Force
- 9.2. Market Analysis, Insights and Forecast - by Type
- 9.2.1. Personnel Training and Protection
- 9.2.1.1. Training and Simulation
- 9.2.1.2. Protection Equipment
- 9.2.2. Communication Systems
- 9.2.3. Vehicles
- 9.2.3.1. Land-based Vehicles
- 9.2.3.2. Sea-based Vehicles
- 9.2.3.3. Air-based Vehicles
- 9.2.4. Weapons and Ammunition
- 9.2.4.1. Artillery and Mortar Systems
- 9.2.4.2. Infantry Weapons
- 9.2.4.3. Missiles and Missile Defense Systems
- 9.2.1. Personnel Training and Protection
- 9.3. Market Analysis, Insights and Forecast - by Geography
- 9.3.1. Saudi Arabia
- 9.3.2. United Arab Emirates
- 9.3.3. Qatar
- 9.3.4. Kuwait
- 9.3.5. Bahrain
- 9.3.6. Oman
- 9.1. Market Analysis, Insights and Forecast - by Armed Forces
- 10. Bahrain GCC Defense Industry Analysis, Insights and Forecast, 2019-2031
- 10.1. Market Analysis, Insights and Forecast - by Armed Forces
- 10.1.1. Army
- 10.1.2. Navy
- 10.1.3. Air Force
- 10.2. Market Analysis, Insights and Forecast - by Type
- 10.2.1. Personnel Training and Protection
- 10.2.1.1. Training and Simulation
- 10.2.1.2. Protection Equipment
- 10.2.2. Communication Systems
- 10.2.3. Vehicles
- 10.2.3.1. Land-based Vehicles
- 10.2.3.2. Sea-based Vehicles
- 10.2.3.3. Air-based Vehicles
- 10.2.4. Weapons and Ammunition
- 10.2.4.1. Artillery and Mortar Systems
- 10.2.4.2. Infantry Weapons
- 10.2.4.3. Missiles and Missile Defense Systems
- 10.2.1. Personnel Training and Protection
- 10.3. Market Analysis, Insights and Forecast - by Geography
- 10.3.1. Saudi Arabia
- 10.3.2. United Arab Emirates
- 10.3.3. Qatar
- 10.3.4. Kuwait
- 10.3.5. Bahrain
- 10.3.6. Oman
- 10.1. Market Analysis, Insights and Forecast - by Armed Forces
- 11. Oman GCC Defense Industry Analysis, Insights and Forecast, 2019-2031
- 11.1. Market Analysis, Insights and Forecast - by Armed Forces
- 11.1.1. Army
- 11.1.2. Navy
- 11.1.3. Air Force
- 11.2. Market Analysis, Insights and Forecast - by Type
- 11.2.1. Personnel Training and Protection
- 11.2.1.1. Training and Simulation
- 11.2.1.2. Protection Equipment
- 11.2.2. Communication Systems
- 11.2.3. Vehicles
- 11.2.3.1. Land-based Vehicles
- 11.2.3.2. Sea-based Vehicles
- 11.2.3.3. Air-based Vehicles
- 11.2.4. Weapons and Ammunition
- 11.2.4.1. Artillery and Mortar Systems
- 11.2.4.2. Infantry Weapons
- 11.2.4.3. Missiles and Missile Defense Systems
- 11.2.1. Personnel Training and Protection
- 11.3. Market Analysis, Insights and Forecast - by Geography
- 11.3.1. Saudi Arabia
- 11.3.2. United Arab Emirates
- 11.3.3. Qatar
- 11.3.4. Kuwait
- 11.3.5. Bahrain
- 11.3.6. Oman
- 11.1. Market Analysis, Insights and Forecast - by Armed Forces
- 12. Saudi Arabia GCC Defense Industry Analysis, Insights and Forecast, 2019-2031
- 12.1. Market Analysis, Insights and Forecast - By Country/Sub-region
- 12.1.1.
- 13. United Arab Emirates GCC Defense Industry Analysis, Insights and Forecast, 2019-2031
- 13.1. Market Analysis, Insights and Forecast - By Country/Sub-region
- 13.1.1.
- 14. Qatar GCC Defense Industry Analysis, Insights and Forecast, 2019-2031
- 14.1. Market Analysis, Insights and Forecast - By Country/Sub-region
- 14.1.1.
- 15. Kuwait GCC Defense Industry Analysis, Insights and Forecast, 2019-2031
- 15.1. Market Analysis, Insights and Forecast - By Country/Sub-region
- 15.1.1.
- 16. Bahrain GCC Defense Industry Analysis, Insights and Forecast, 2019-2031
- 16.1. Market Analysis, Insights and Forecast - By Country/Sub-region
- 16.1.1.
- 17. Oman GCC Defense Industry Analysis, Insights and Forecast, 2019-2031
- 17.1. Market Analysis, Insights and Forecast - By Country/Sub-region
- 17.1.1.
- 18. Competitive Analysis
- 18.1. Global Market Share Analysis 2024
- 18.2. Company Profiles
- 18.2.1 L3Harris Technologies Inc
- 18.2.1.1. Overview
- 18.2.1.2. Products
- 18.2.1.3. SWOT Analysis
- 18.2.1.4. Recent Developments
- 18.2.1.5. Financials (Based on Availability)
- 18.2.2 THALES
- 18.2.2.1. Overview
- 18.2.2.2. Products
- 18.2.2.3. SWOT Analysis
- 18.2.2.4. Recent Developments
- 18.2.2.5. Financials (Based on Availability)
- 18.2.3 Leonardo SpA
- 18.2.3.1. Overview
- 18.2.3.2. Products
- 18.2.3.3. SWOT Analysis
- 18.2.3.4. Recent Developments
- 18.2.3.5. Financials (Based on Availability)
- 18.2.4 Rheinmetall AG
- 18.2.4.1. Overview
- 18.2.4.2. Products
- 18.2.4.3. SWOT Analysis
- 18.2.4.4. Recent Developments
- 18.2.4.5. Financials (Based on Availability)
- 18.2.5 Elbit Systems Ltd
- 18.2.5.1. Overview
- 18.2.5.2. Products
- 18.2.5.3. SWOT Analysis
- 18.2.5.4. Recent Developments
- 18.2.5.5. Financials (Based on Availability)
- 18.2.6 Lockheed Martin Corporation
- 18.2.6.1. Overview
- 18.2.6.2. Products
- 18.2.6.3. SWOT Analysis
- 18.2.6.4. Recent Developments
- 18.2.6.5. Financials (Based on Availability)
- 18.2.7 Airbus SE
- 18.2.7.1. Overview
- 18.2.7.2. Products
- 18.2.7.3. SWOT Analysis
- 18.2.7.4. Recent Developments
- 18.2.7.5. Financials (Based on Availability)
- 18.2.8 ASELSAN AS
- 18.2.8.1. Overview
- 18.2.8.2. Products
- 18.2.8.3. SWOT Analysis
- 18.2.8.4. Recent Developments
- 18.2.8.5. Financials (Based on Availability)
- 18.2.9 IAI
- 18.2.9.1. Overview
- 18.2.9.2. Products
- 18.2.9.3. SWOT Analysis
- 18.2.9.4. Recent Developments
- 18.2.9.5. Financials (Based on Availability)
- 18.2.10 BAE Systems PLC
- 18.2.10.1. Overview
- 18.2.10.2. Products
- 18.2.10.3. SWOT Analysis
- 18.2.10.4. Recent Developments
- 18.2.10.5. Financials (Based on Availability)
- 18.2.11 RTX Corporation
- 18.2.11.1. Overview
- 18.2.11.2. Products
- 18.2.11.3. SWOT Analysis
- 18.2.11.4. Recent Developments
- 18.2.11.5. Financials (Based on Availability)
- 18.2.12 Dahra Engineering & Security Services LLC
- 18.2.12.1. Overview
- 18.2.12.2. Products
- 18.2.12.3. SWOT Analysis
- 18.2.12.4. Recent Developments
- 18.2.12.5. Financials (Based on Availability)
- 18.2.13 EDGE Group PJSC
- 18.2.13.1. Overview
- 18.2.13.2. Products
- 18.2.13.3. SWOT Analysis
- 18.2.13.4. Recent Developments
- 18.2.13.5. Financials (Based on Availability)
- 18.2.14 Saudi Arabian Military Industries (SAMI
- 18.2.14.1. Overview
- 18.2.14.2. Products
- 18.2.14.3. SWOT Analysis
- 18.2.14.4. Recent Developments
- 18.2.14.5. Financials (Based on Availability)
- 18.2.15 Northrop Grumman Corporation
- 18.2.15.1. Overview
- 18.2.15.2. Products
- 18.2.15.3. SWOT Analysis
- 18.2.15.4. Recent Developments
- 18.2.15.5. Financials (Based on Availability)
- 18.2.16 The Boeing Company
- 18.2.16.1. Overview
- 18.2.16.2. Products
- 18.2.16.3. SWOT Analysis
- 18.2.16.4. Recent Developments
- 18.2.16.5. Financials (Based on Availability)
- 18.2.1 L3Harris Technologies Inc
List of Figures
- Figure 1: Global GCC Defense Industry Revenue Breakdown (Million, %) by Region 2024 & 2032
- Figure 2: Saudi Arabia GCC Defense Industry Revenue (Million), by Country 2024 & 2032
- Figure 3: Saudi Arabia GCC Defense Industry Revenue Share (%), by Country 2024 & 2032
- Figure 4: United Arab Emirates GCC Defense Industry Revenue (Million), by Country 2024 & 2032
- Figure 5: United Arab Emirates GCC Defense Industry Revenue Share (%), by Country 2024 & 2032
- Figure 6: Qatar GCC Defense Industry Revenue (Million), by Country 2024 & 2032
- Figure 7: Qatar GCC Defense Industry Revenue Share (%), by Country 2024 & 2032
- Figure 8: Kuwait GCC Defense Industry Revenue (Million), by Country 2024 & 2032
- Figure 9: Kuwait GCC Defense Industry Revenue Share (%), by Country 2024 & 2032
- Figure 10: Bahrain GCC Defense Industry Revenue (Million), by Country 2024 & 2032
- Figure 11: Bahrain GCC Defense Industry Revenue Share (%), by Country 2024 & 2032
- Figure 12: Oman GCC Defense Industry Revenue (Million), by Country 2024 & 2032
- Figure 13: Oman GCC Defense Industry Revenue Share (%), by Country 2024 & 2032
- Figure 14: Saudi Arabia GCC Defense Industry Revenue (Million), by Armed Forces 2024 & 2032
- Figure 15: Saudi Arabia GCC Defense Industry Revenue Share (%), by Armed Forces 2024 & 2032
- Figure 16: Saudi Arabia GCC Defense Industry Revenue (Million), by Type 2024 & 2032
- Figure 17: Saudi Arabia GCC Defense Industry Revenue Share (%), by Type 2024 & 2032
- Figure 18: Saudi Arabia GCC Defense Industry Revenue (Million), by Geography 2024 & 2032
- Figure 19: Saudi Arabia GCC Defense Industry Revenue Share (%), by Geography 2024 & 2032
- Figure 20: Saudi Arabia GCC Defense Industry Revenue (Million), by Country 2024 & 2032
- Figure 21: Saudi Arabia GCC Defense Industry Revenue Share (%), by Country 2024 & 2032
- Figure 22: United Arab Emirates GCC Defense Industry Revenue (Million), by Armed Forces 2024 & 2032
- Figure 23: United Arab Emirates GCC Defense Industry Revenue Share (%), by Armed Forces 2024 & 2032
- Figure 24: United Arab Emirates GCC Defense Industry Revenue (Million), by Type 2024 & 2032
- Figure 25: United Arab Emirates GCC Defense Industry Revenue Share (%), by Type 2024 & 2032
- Figure 26: United Arab Emirates GCC Defense Industry Revenue (Million), by Geography 2024 & 2032
- Figure 27: United Arab Emirates GCC Defense Industry Revenue Share (%), by Geography 2024 & 2032
- Figure 28: United Arab Emirates GCC Defense Industry Revenue (Million), by Country 2024 & 2032
- Figure 29: United Arab Emirates GCC Defense Industry Revenue Share (%), by Country 2024 & 2032
- Figure 30: Qatar GCC Defense Industry Revenue (Million), by Armed Forces 2024 & 2032
- Figure 31: Qatar GCC Defense Industry Revenue Share (%), by Armed Forces 2024 & 2032
- Figure 32: Qatar GCC Defense Industry Revenue (Million), by Type 2024 & 2032
- Figure 33: Qatar GCC Defense Industry Revenue Share (%), by Type 2024 & 2032
- Figure 34: Qatar GCC Defense Industry Revenue (Million), by Geography 2024 & 2032
- Figure 35: Qatar GCC Defense Industry Revenue Share (%), by Geography 2024 & 2032
- Figure 36: Qatar GCC Defense Industry Revenue (Million), by Country 2024 & 2032
- Figure 37: Qatar GCC Defense Industry Revenue Share (%), by Country 2024 & 2032
- Figure 38: Kuwait GCC Defense Industry Revenue (Million), by Armed Forces 2024 & 2032
- Figure 39: Kuwait GCC Defense Industry Revenue Share (%), by Armed Forces 2024 & 2032
- Figure 40: Kuwait GCC Defense Industry Revenue (Million), by Type 2024 & 2032
- Figure 41: Kuwait GCC Defense Industry Revenue Share (%), by Type 2024 & 2032
- Figure 42: Kuwait GCC Defense Industry Revenue (Million), by Geography 2024 & 2032
- Figure 43: Kuwait GCC Defense Industry Revenue Share (%), by Geography 2024 & 2032
- Figure 44: Kuwait GCC Defense Industry Revenue (Million), by Country 2024 & 2032
- Figure 45: Kuwait GCC Defense Industry Revenue Share (%), by Country 2024 & 2032
- Figure 46: Bahrain GCC Defense Industry Revenue (Million), by Armed Forces 2024 & 2032
- Figure 47: Bahrain GCC Defense Industry Revenue Share (%), by Armed Forces 2024 & 2032
- Figure 48: Bahrain GCC Defense Industry Revenue (Million), by Type 2024 & 2032
- Figure 49: Bahrain GCC Defense Industry Revenue Share (%), by Type 2024 & 2032
- Figure 50: Bahrain GCC Defense Industry Revenue (Million), by Geography 2024 & 2032
- Figure 51: Bahrain GCC Defense Industry Revenue Share (%), by Geography 2024 & 2032
- Figure 52: Bahrain GCC Defense Industry Revenue (Million), by Country 2024 & 2032
- Figure 53: Bahrain GCC Defense Industry Revenue Share (%), by Country 2024 & 2032
- Figure 54: Oman GCC Defense Industry Revenue (Million), by Armed Forces 2024 & 2032
- Figure 55: Oman GCC Defense Industry Revenue Share (%), by Armed Forces 2024 & 2032
- Figure 56: Oman GCC Defense Industry Revenue (Million), by Type 2024 & 2032
- Figure 57: Oman GCC Defense Industry Revenue Share (%), by Type 2024 & 2032
- Figure 58: Oman GCC Defense Industry Revenue (Million), by Geography 2024 & 2032
- Figure 59: Oman GCC Defense Industry Revenue Share (%), by Geography 2024 & 2032
- Figure 60: Oman GCC Defense Industry Revenue (Million), by Country 2024 & 2032
- Figure 61: Oman GCC Defense Industry Revenue Share (%), by Country 2024 & 2032
List of Tables
- Table 1: Global GCC Defense Industry Revenue Million Forecast, by Region 2019 & 2032
- Table 2: Global GCC Defense Industry Revenue Million Forecast, by Armed Forces 2019 & 2032
- Table 3: Global GCC Defense Industry Revenue Million Forecast, by Type 2019 & 2032
- Table 4: Global GCC Defense Industry Revenue Million Forecast, by Geography 2019 & 2032
- Table 5: Global GCC Defense Industry Revenue Million Forecast, by Region 2019 & 2032
- Table 6: Global GCC Defense Industry Revenue Million Forecast, by Country 2019 & 2032
- Table 7: GCC Defense Industry Revenue (Million) Forecast, by Application 2019 & 2032
- Table 8: Global GCC Defense Industry Revenue Million Forecast, by Country 2019 & 2032
- Table 9: GCC Defense Industry Revenue (Million) Forecast, by Application 2019 & 2032
- Table 10: Global GCC Defense Industry Revenue Million Forecast, by Country 2019 & 2032
- Table 11: GCC Defense Industry Revenue (Million) Forecast, by Application 2019 & 2032
- Table 12: Global GCC Defense Industry Revenue Million Forecast, by Country 2019 & 2032
- Table 13: GCC Defense Industry Revenue (Million) Forecast, by Application 2019 & 2032
- Table 14: Global GCC Defense Industry Revenue Million Forecast, by Country 2019 & 2032
- Table 15: GCC Defense Industry Revenue (Million) Forecast, by Application 2019 & 2032
- Table 16: Global GCC Defense Industry Revenue Million Forecast, by Country 2019 & 2032
- Table 17: GCC Defense Industry Revenue (Million) Forecast, by Application 2019 & 2032
- Table 18: Global GCC Defense Industry Revenue Million Forecast, by Armed Forces 2019 & 2032
- Table 19: Global GCC Defense Industry Revenue Million Forecast, by Type 2019 & 2032
- Table 20: Global GCC Defense Industry Revenue Million Forecast, by Geography 2019 & 2032
- Table 21: Global GCC Defense Industry Revenue Million Forecast, by Country 2019 & 2032
- Table 22: Global GCC Defense Industry Revenue Million Forecast, by Armed Forces 2019 & 2032
- Table 23: Global GCC Defense Industry Revenue Million Forecast, by Type 2019 & 2032
- Table 24: Global GCC Defense Industry Revenue Million Forecast, by Geography 2019 & 2032
- Table 25: Global GCC Defense Industry Revenue Million Forecast, by Country 2019 & 2032
- Table 26: Global GCC Defense Industry Revenue Million Forecast, by Armed Forces 2019 & 2032
- Table 27: Global GCC Defense Industry Revenue Million Forecast, by Type 2019 & 2032
- Table 28: Global GCC Defense Industry Revenue Million Forecast, by Geography 2019 & 2032
- Table 29: Global GCC Defense Industry Revenue Million Forecast, by Country 2019 & 2032
- Table 30: Global GCC Defense Industry Revenue Million Forecast, by Armed Forces 2019 & 2032
- Table 31: Global GCC Defense Industry Revenue Million Forecast, by Type 2019 & 2032
- Table 32: Global GCC Defense Industry Revenue Million Forecast, by Geography 2019 & 2032
- Table 33: Global GCC Defense Industry Revenue Million Forecast, by Country 2019 & 2032
- Table 34: Global GCC Defense Industry Revenue Million Forecast, by Armed Forces 2019 & 2032
- Table 35: Global GCC Defense Industry Revenue Million Forecast, by Type 2019 & 2032
- Table 36: Global GCC Defense Industry Revenue Million Forecast, by Geography 2019 & 2032
- Table 37: Global GCC Defense Industry Revenue Million Forecast, by Country 2019 & 2032
- Table 38: Global GCC Defense Industry Revenue Million Forecast, by Armed Forces 2019 & 2032
- Table 39: Global GCC Defense Industry Revenue Million Forecast, by Type 2019 & 2032
- Table 40: Global GCC Defense Industry Revenue Million Forecast, by Geography 2019 & 2032
- Table 41: Global GCC Defense Industry Revenue Million Forecast, by Country 2019 & 2032
Frequently Asked Questions
1. What is the projected Compound Annual Growth Rate (CAGR) of the GCC Defense Industry?
The projected CAGR is approximately 11.04%.
2. Which companies are prominent players in the GCC Defense Industry?
Key companies in the market include L3Harris Technologies Inc, THALES, Leonardo SpA, Rheinmetall AG, Elbit Systems Ltd, Lockheed Martin Corporation, Airbus SE, ASELSAN AS, IAI, BAE Systems PLC, RTX Corporation, Dahra Engineering & Security Services LLC, EDGE Group PJSC, Saudi Arabian Military Industries (SAMI, Northrop Grumman Corporation, The Boeing Company.
3. What are the main segments of the GCC Defense Industry?
The market segments include Armed Forces, Type, Geography.
4. Can you provide details about the market size?
The market size is estimated to be USD 29.73 Million as of 2022.
5. What are some drivers contributing to market growth?
N/A
6. What are the notable trends driving market growth?
Airforce Segment to Dominate Market Share During the Forecast Period.
7. Are there any restraints impacting market growth?
N/A
8. Can you provide examples of recent developments in the market?
February 2024: Lockheed Martin Corporation signed an agreement with Saudi Arabian companies to manufacture components of its Terminal High Altitude Area Defense (THAAD) missile defense system. This move comes as the United States continues to conduct military operations in the Middle East.
9. What pricing options are available for accessing the report?
Pricing options include single-user, multi-user, and enterprise licenses priced at USD 4750, USD 5250, and USD 8750 respectively.
10. Is the market size provided in terms of value or volume?
The market size is provided in terms of value, measured in Million.
11. Are there any specific market keywords associated with the report?
Yes, the market keyword associated with the report is "GCC Defense Industry," which aids in identifying and referencing the specific market segment covered.
12. How do I determine which pricing option suits my needs best?
The pricing options vary based on user requirements and access needs. Individual users may opt for single-user licenses, while businesses requiring broader access may choose multi-user or enterprise licenses for cost-effective access to the report.
13. Are there any additional resources or data provided in the GCC Defense Industry report?
While the report offers comprehensive insights, it's advisable to review the specific contents or supplementary materials provided to ascertain if additional resources or data are available.
14. How can I stay updated on further developments or reports in the GCC Defense Industry?
To stay informed about further developments, trends, and reports in the GCC Defense Industry, consider subscribing to industry newsletters, following relevant companies and organizations, or regularly checking reputable industry news sources and publications.
Methodology
Step 1 - Identification of Relevant Samples Size from Population Database


Step 2 - Approaches for Defining Global Market Size (Value, Volume* & Price*)

Note*: In applicable scenarios
Step 3 - Data Sources
Primary Research
- Web Analytics
- Survey Reports
- Research Institute
- Latest Research Reports
- Opinion Leaders
Secondary Research
- Annual Reports
- White Paper
- Latest Press Release
- Industry Association
- Paid Database
- Investor Presentations

Step 4 - Data Triangulation
Involves using different sources of information in order to increase the validity of a study
These sources are likely to be stakeholders in a program - participants, other researchers, program staff, other community members, and so on.
Then we put all data in single framework & apply various statistical tools to find out the dynamic on the market.
During the analysis stage, feedback from the stakeholder groups would be compared to determine areas of agreement as well as areas of divergence


