
Key Insights
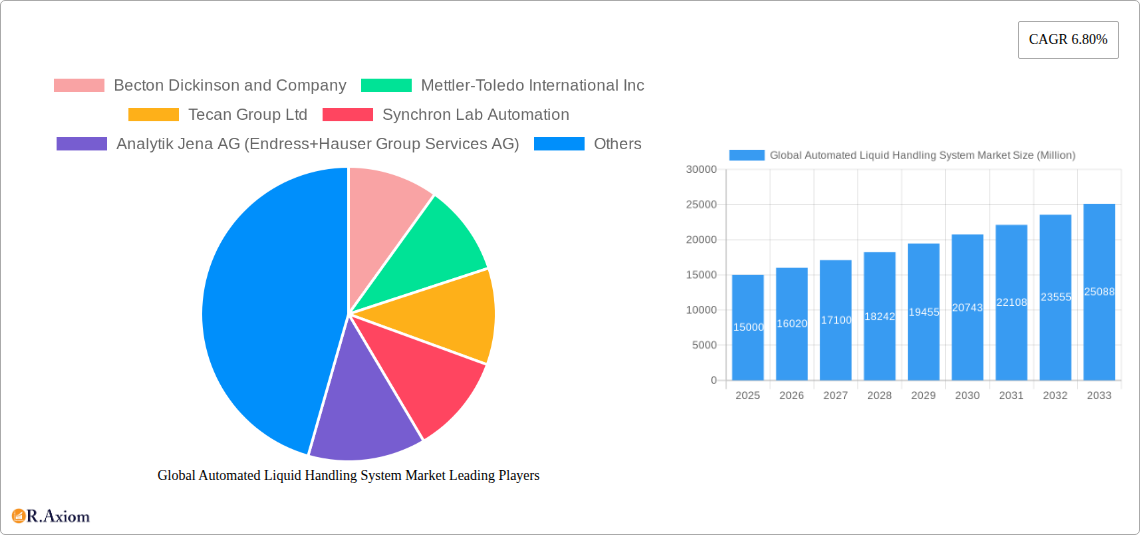
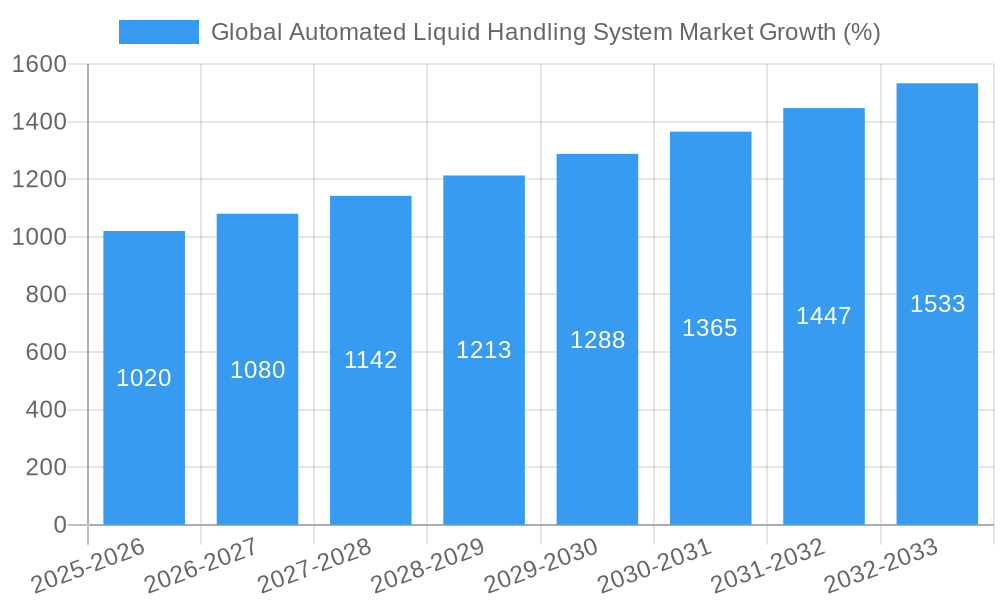
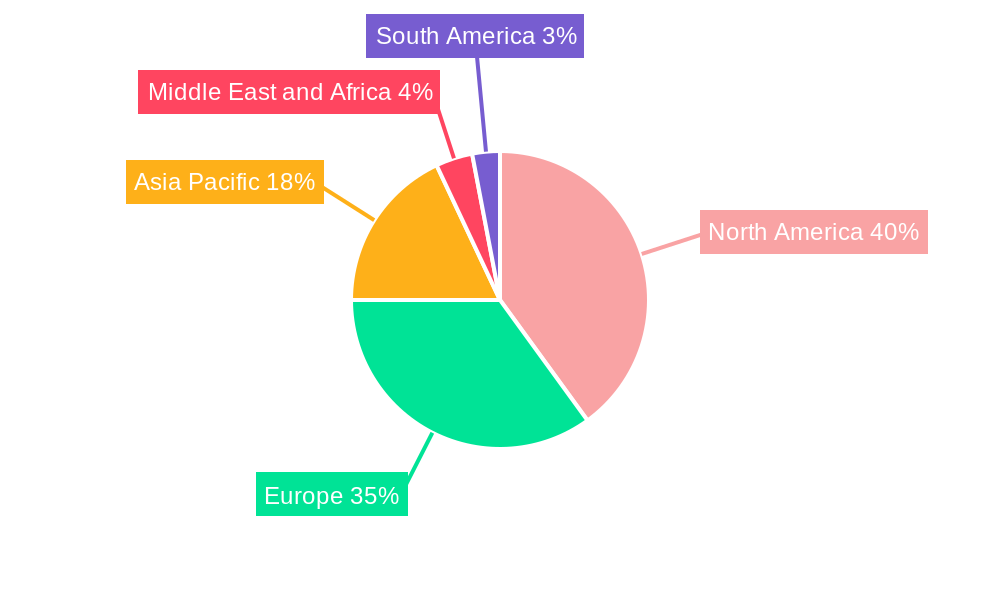
The global automated liquid handling system market is experiencing robust growth, driven by increasing automation in life sciences research and pharmaceutical development. The market's expansion is fueled by the rising demand for high-throughput screening, precision in liquid handling, and the need for reduced human error in laboratories. The 6.80% CAGR indicates a consistently expanding market, projected to reach significant value over the forecast period (2025-2033). Key segments driving this growth include automated liquid handling systems, particularly workstations and pipettors, within the pharmaceutical and biotechnology end-user sector. Contract research organizations (CROs) also represent a substantial and growing market segment, contributing to the overall market size. Technological advancements, such as the integration of artificial intelligence and miniaturization techniques, further enhance the market's appeal. The market is geographically diverse, with North America and Europe currently holding significant market shares, but the Asia-Pacific region is expected to witness substantial growth driven by increasing investments in research and development infrastructure. Competitive dynamics are characterized by a mix of established players and emerging companies offering innovative solutions. This results in a dynamic environment where continuous innovation and strategic partnerships are vital for market success.
Despite the positive outlook, the market faces certain challenges. High initial investment costs associated with automated systems can be a barrier to entry for smaller research institutions. Furthermore, the need for skilled personnel to operate and maintain these complex systems requires ongoing training and support. However, these constraints are likely to be offset by the long-term cost savings and efficiency gains offered by automation. The increasing prevalence of outsourcing of laboratory services, coupled with ongoing advancements in automation technology, are anticipated to mitigate these challenges and further accelerate market growth in the coming years. The focus is shifting towards user-friendly systems and integrated solutions that streamline workflows and enhance overall laboratory productivity.
This comprehensive report provides a detailed analysis of the global automated liquid handling system market, offering invaluable insights for stakeholders across the pharmaceutical, biotechnology, research, and contract research organization (CRO) sectors. The study period covers 2019-2033, with 2025 as the base and estimated year, and a forecast period of 2025-2033. The report utilizes a robust methodology, incorporating both historical data (2019-2024) and future projections to deliver an accurate and actionable market overview. The market size is valued in Millions.
Global Automated Liquid Handling System Market Concentration & Innovation
This section analyzes the competitive landscape of the global automated liquid handling system market, examining market concentration, innovation drivers, regulatory influences, and strategic activities (M&A). The market is moderately concentrated, with key players like Thermo Fisher Scientific, Danaher Corporation (Beckman Coulter Inc), and Tecan Group Ltd holding significant market share. However, the presence of numerous smaller players creates a dynamic competitive environment.
- Market Concentration: The Herfindahl-Hirschman Index (HHI) is estimated at xx, indicating a moderately concentrated market. The top 5 players collectively hold an estimated xx% market share in 2025.
- Innovation Drivers: Miniaturization, increased automation, integration with advanced analytics, and the demand for high-throughput screening are key drivers of innovation. The development of AI-powered systems and robotic automation is also significantly impacting the market.
- Regulatory Framework: Stringent regulatory requirements for quality control and data management in pharmaceutical and life science industries influence market growth and technology adoption. Compliance with standards like FDA guidelines is crucial.
- Product Substitutes: Manual liquid handling systems represent a primary substitute, but their limitations in throughput and accuracy are driving market shift towards automation.
- End-User Trends: Increasing outsourcing of research activities to CROs, along with the growth of personalized medicine and advanced therapies, fuels market demand.
- M&A Activities: Recent years have witnessed several mergers and acquisitions, with deal values totaling approximately xx Million in the past five years. These activities aim to expand product portfolios, enhance technological capabilities, and gain access to new markets.
Global Automated Liquid Handling System Market Industry Trends & Insights
The global automated liquid handling system market is experiencing robust growth, driven by several factors. Technological advancements, increasing demand from pharmaceutical and biotechnology companies, and rising adoption in academic and research institutions are key contributors. The market is projected to achieve a CAGR of xx% during the forecast period (2025-2033).
The market penetration of automated liquid handling systems is highest in developed regions, with North America and Europe accounting for a significant portion of global sales. However, emerging economies in Asia-Pacific are showing rapid growth due to rising investments in healthcare infrastructure and research facilities. The market is also witnessing a shift towards integrated and modular systems, which offer greater flexibility and customization. Competitive dynamics are intense, with established players focusing on innovation and strategic partnerships to maintain their market position while new entrants challenge the status quo.
Dominant Markets & Segments in Global Automated Liquid Handling System Market
The pharmaceutical and biotechnology sector dominates the end-user segment, accounting for approximately xx% of the market share in 2025. This is driven by the high volume of liquid handling procedures required in drug discovery, development, and manufacturing. The automated liquid handling systems segment within the 'By Type' category holds the largest market share, reflecting the increasing preference for high-throughput, precise, and efficient liquid handling solutions.
Leading Region/Country: North America is the leading region, followed by Europe. Within North America, the US holds the largest market share. Key drivers include robust research funding, a large pharmaceutical industry, and a well-developed healthcare infrastructure.
Dominant Segment (By Type): Automated liquid handling systems are the dominant segment due to their superior efficiency and precision.
Dominant Segment (By Product): Liquid handling workstations constitute the largest product segment due to their versatility and capacity for integrating various functions.
Dominant Segment (By End User): Pharmaceutical and biotechnology companies dominate the end-user segment due to their high volume of liquid handling needs.
Key Drivers (by Region):
- North America: Strong R&D investments, advanced healthcare infrastructure, and a significant pharmaceutical industry.
- Europe: Growing adoption of automation in research and healthcare, stringent regulatory frameworks driving quality control.
- Asia-Pacific: Rapid growth of pharmaceutical and biotechnology industries, increasing research funding, and expanding healthcare infrastructure.
Global Automated Liquid Handling System Market Product Developments
Recent years have witnessed significant product innovations, focusing on increased throughput, enhanced precision, and improved ease of use. Manufacturers are incorporating advanced technologies such as AI, machine learning, and robotics to enhance system capabilities. The trend is towards modular and customizable systems that can be adapted to specific research and manufacturing needs. This facilitates greater flexibility and cost-effectiveness for end-users.
Report Scope & Segmentation Analysis
This report segments the global automated liquid handling system market by type (automated and semi-automated), product (liquid handling workstations, pipettors, microplate reagent dispensers, microplate washers, consumables, and other products), and end-user (contract research organizations, pharmaceutical and biotechnology companies, and academic and research institutes). Each segment’s growth projections, market size, and competitive dynamics are analyzed in detail. The market is expected to witness significant growth across all segments, driven by factors like increasing automation in research labs and the rising demand for high-throughput screening.
Key Drivers of Global Automated Liquid Handling System Market Growth
Several factors are driving the market's growth. Technological advancements resulting in increased precision and automation are key. The increasing demand for high-throughput screening in drug discovery and development is also a significant driver. Furthermore, rising investments in research and development across various sectors, coupled with supportive regulatory frameworks, are fueling market expansion.
Challenges in the Global Automated Liquid Handling System Market Sector
The market faces challenges including high initial investment costs, the need for skilled personnel to operate complex systems, and the potential for integration difficulties with existing laboratory equipment. Supply chain disruptions and price fluctuations of raw materials can impact production costs. Intense competition and the need for continuous innovation to stay ahead of the curve also pose challenges.
Emerging Opportunities in Global Automated Liquid Handling System Market
The market presents several emerging opportunities. The development of miniaturized systems, integration with advanced analytics platforms, and the incorporation of AI for improved decision-making and automation present significant growth prospects. Expanding into emerging markets and focusing on customized solutions tailored to specific customer needs also offer potential.
Leading Players in the Global Automated Liquid Handling System Market Market
- Becton Dickinson and Company
- Mettler-Toledo International Inc
- Tecan Group Ltd
- Synchron Lab Automation
- Analytik Jena AG (Endress+Hauser Group Services AG)
- Aurora Biomed Inc
- Eppendorf AG
- Formulatrix Inc
- Corning Incorporated
- Hamilton Company
- Hudson Robotics Inc
- Thermo Fisher Scientific
- Agilent Technologies
- Danaher Corporation (Beckman Coulter Inc)
- Perkin Elmer Inc
Key Developments in Global Automated Liquid Handling System Market Industry
- June 2022: Beckman Coulter Life Sciences (Danaher Corporation) launched the Biomek NGeniuS liquid handling system, enhancing accessibility to next-generation sequencing for research labs.
- February 2022: Festo introduced a modular gantry robot platform for automated liquid handling systems, facilitating quicker development of customized solutions for laboratories.
Strategic Outlook for Global Automated Liquid Handling System Market Market
The global automated liquid handling system market is poised for continued growth, driven by ongoing technological advancements and the increasing demand for efficient and precise liquid handling solutions across diverse industries. Strategic partnerships, collaborations, and investments in R&D will be crucial for players seeking to capture market share. Focus on providing customized solutions, integrating AI and advanced analytics, and expanding into emerging markets will be critical success factors.
Global Automated Liquid Handling System Market Segmentation
-
1. Type
- 1.1. Automated Liquid Handling System
- 1.2. Semi-automated Liquid Handling System
-
2. Product
- 2.1. Liquid Handling Workstation
- 2.2. Pipettors
- 2.3. Microplate Reagent Dispensers
- 2.4. Microplate Washers
- 2.5. Consumables
- 2.6. Other Products
-
3. End User
- 3.1. Contract Research Organizations
- 3.2. Pharmaceutical and Biotechnology
- 3.3. Academic and Research Institutes
Global Automated Liquid Handling System Market Segmentation By Geography
-
1. North America
- 1.1. United States
- 1.2. Canada
- 1.3. Mexico
-
2. Europe
- 2.1. Germany
- 2.2. United Kingdom
- 2.3. France
- 2.4. Italy
- 2.5. Spain
- 2.6. Rest of Europe
-
3. Asia Pacific
- 3.1. China
- 3.2. Japan
- 3.3. India
- 3.4. Australia
- 3.5. South Korea
- 3.6. Rest of Asia Pacific
-
4. Middle East and Africa
- 4.1. GCC
- 4.2. South Africa
- 4.3. Rest of Middle East and Africa
-
5. South America
- 5.1. Brazil
- 5.2. Argentina
- 5.3. Rest of South America
Global Automated Liquid Handling System Market REPORT HIGHLIGHTS
| Aspects | Details |
|---|---|
| Study Period | 2019-2033 |
| Base Year | 2024 |
| Estimated Year | 2025 |
| Forecast Period | 2025-2033 |
| Historical Period | 2019-2024 |
| Growth Rate | CAGR of 6.80% from 2019-2033 |
| Segmentation |
|
Table of Contents
- 1. Introduction
- 1.1. Research Scope
- 1.2. Market Segmentation
- 1.3. Research Methodology
- 1.4. Definitions and Assumptions
- 2. Executive Summary
- 2.1. Introduction
- 3. Market Dynamics
- 3.1. Introduction
- 3.2. Market Drivers
- 3.2.1. Flexibility and Adaptability of Lab Automation Systems; Technological Advancements in Automated Liquid Handling Systems
- 3.3. Market Restrains
- 3.3.1. Slower Adoption Rates in Small- and Medium-sized Organizations
- 3.4. Market Trends
- 3.4.1. Liquid Handling Workstation are Expected to Witness Healthy Growth Over the Forecast Period
- 4. Market Factor Analysis
- 4.1. Porters Five Forces
- 4.2. Supply/Value Chain
- 4.3. PESTEL analysis
- 4.4. Market Entropy
- 4.5. Patent/Trademark Analysis
- 5. Global Automated Liquid Handling System Market Analysis, Insights and Forecast, 2019-2031
- 5.1. Market Analysis, Insights and Forecast - by Type
- 5.1.1. Automated Liquid Handling System
- 5.1.2. Semi-automated Liquid Handling System
- 5.2. Market Analysis, Insights and Forecast - by Product
- 5.2.1. Liquid Handling Workstation
- 5.2.2. Pipettors
- 5.2.3. Microplate Reagent Dispensers
- 5.2.4. Microplate Washers
- 5.2.5. Consumables
- 5.2.6. Other Products
- 5.3. Market Analysis, Insights and Forecast - by End User
- 5.3.1. Contract Research Organizations
- 5.3.2. Pharmaceutical and Biotechnology
- 5.3.3. Academic and Research Institutes
- 5.4. Market Analysis, Insights and Forecast - by Region
- 5.4.1. North America
- 5.4.2. Europe
- 5.4.3. Asia Pacific
- 5.4.4. Middle East and Africa
- 5.4.5. South America
- 5.1. Market Analysis, Insights and Forecast - by Type
- 6. North America Global Automated Liquid Handling System Market Analysis, Insights and Forecast, 2019-2031
- 6.1. Market Analysis, Insights and Forecast - by Type
- 6.1.1. Automated Liquid Handling System
- 6.1.2. Semi-automated Liquid Handling System
- 6.2. Market Analysis, Insights and Forecast - by Product
- 6.2.1. Liquid Handling Workstation
- 6.2.2. Pipettors
- 6.2.3. Microplate Reagent Dispensers
- 6.2.4. Microplate Washers
- 6.2.5. Consumables
- 6.2.6. Other Products
- 6.3. Market Analysis, Insights and Forecast - by End User
- 6.3.1. Contract Research Organizations
- 6.3.2. Pharmaceutical and Biotechnology
- 6.3.3. Academic and Research Institutes
- 6.1. Market Analysis, Insights and Forecast - by Type
- 7. Europe Global Automated Liquid Handling System Market Analysis, Insights and Forecast, 2019-2031
- 7.1. Market Analysis, Insights and Forecast - by Type
- 7.1.1. Automated Liquid Handling System
- 7.1.2. Semi-automated Liquid Handling System
- 7.2. Market Analysis, Insights and Forecast - by Product
- 7.2.1. Liquid Handling Workstation
- 7.2.2. Pipettors
- 7.2.3. Microplate Reagent Dispensers
- 7.2.4. Microplate Washers
- 7.2.5. Consumables
- 7.2.6. Other Products
- 7.3. Market Analysis, Insights and Forecast - by End User
- 7.3.1. Contract Research Organizations
- 7.3.2. Pharmaceutical and Biotechnology
- 7.3.3. Academic and Research Institutes
- 7.1. Market Analysis, Insights and Forecast - by Type
- 8. Asia Pacific Global Automated Liquid Handling System Market Analysis, Insights and Forecast, 2019-2031
- 8.1. Market Analysis, Insights and Forecast - by Type
- 8.1.1. Automated Liquid Handling System
- 8.1.2. Semi-automated Liquid Handling System
- 8.2. Market Analysis, Insights and Forecast - by Product
- 8.2.1. Liquid Handling Workstation
- 8.2.2. Pipettors
- 8.2.3. Microplate Reagent Dispensers
- 8.2.4. Microplate Washers
- 8.2.5. Consumables
- 8.2.6. Other Products
- 8.3. Market Analysis, Insights and Forecast - by End User
- 8.3.1. Contract Research Organizations
- 8.3.2. Pharmaceutical and Biotechnology
- 8.3.3. Academic and Research Institutes
- 8.1. Market Analysis, Insights and Forecast - by Type
- 9. Middle East and Africa Global Automated Liquid Handling System Market Analysis, Insights and Forecast, 2019-2031
- 9.1. Market Analysis, Insights and Forecast - by Type
- 9.1.1. Automated Liquid Handling System
- 9.1.2. Semi-automated Liquid Handling System
- 9.2. Market Analysis, Insights and Forecast - by Product
- 9.2.1. Liquid Handling Workstation
- 9.2.2. Pipettors
- 9.2.3. Microplate Reagent Dispensers
- 9.2.4. Microplate Washers
- 9.2.5. Consumables
- 9.2.6. Other Products
- 9.3. Market Analysis, Insights and Forecast - by End User
- 9.3.1. Contract Research Organizations
- 9.3.2. Pharmaceutical and Biotechnology
- 9.3.3. Academic and Research Institutes
- 9.1. Market Analysis, Insights and Forecast - by Type
- 10. South America Global Automated Liquid Handling System Market Analysis, Insights and Forecast, 2019-2031
- 10.1. Market Analysis, Insights and Forecast - by Type
- 10.1.1. Automated Liquid Handling System
- 10.1.2. Semi-automated Liquid Handling System
- 10.2. Market Analysis, Insights and Forecast - by Product
- 10.2.1. Liquid Handling Workstation
- 10.2.2. Pipettors
- 10.2.3. Microplate Reagent Dispensers
- 10.2.4. Microplate Washers
- 10.2.5. Consumables
- 10.2.6. Other Products
- 10.3. Market Analysis, Insights and Forecast - by End User
- 10.3.1. Contract Research Organizations
- 10.3.2. Pharmaceutical and Biotechnology
- 10.3.3. Academic and Research Institutes
- 10.1. Market Analysis, Insights and Forecast - by Type
- 11. North America Global Automated Liquid Handling System Market Analysis, Insights and Forecast, 2019-2031
- 11.1. Market Analysis, Insights and Forecast - By Country/Sub-region
- 11.1.1 United States
- 11.1.2 Canada
- 11.1.3 Mexico
- 12. Europe Global Automated Liquid Handling System Market Analysis, Insights and Forecast, 2019-2031
- 12.1. Market Analysis, Insights and Forecast - By Country/Sub-region
- 12.1.1 Germany
- 12.1.2 United Kingdom
- 12.1.3 France
- 12.1.4 Italy
- 12.1.5 Spain
- 12.1.6 Rest of Europe
- 13. Asia Pacific Global Automated Liquid Handling System Market Analysis, Insights and Forecast, 2019-2031
- 13.1. Market Analysis, Insights and Forecast - By Country/Sub-region
- 13.1.1 China
- 13.1.2 Japan
- 13.1.3 India
- 13.1.4 Australia
- 13.1.5 South Korea
- 13.1.6 Rest of Asia Pacific
- 14. Middle East and Africa Global Automated Liquid Handling System Market Analysis, Insights and Forecast, 2019-2031
- 14.1. Market Analysis, Insights and Forecast - By Country/Sub-region
- 14.1.1 GCC
- 14.1.2 South Africa
- 14.1.3 Rest of Middle East and Africa
- 15. South America Global Automated Liquid Handling System Market Analysis, Insights and Forecast, 2019-2031
- 15.1. Market Analysis, Insights and Forecast - By Country/Sub-region
- 15.1.1 Brazil
- 15.1.2 Argentina
- 15.1.3 Rest of South America
- 16. Competitive Analysis
- 16.1. Market Share Analysis 2024
- 16.2. Company Profiles
- 16.2.1 Becton Dickinson and Company
- 16.2.1.1. Overview
- 16.2.1.2. Products
- 16.2.1.3. SWOT Analysis
- 16.2.1.4. Recent Developments
- 16.2.1.5. Financials (Based on Availability)
- 16.2.2 Mettler-Toledo International Inc
- 16.2.2.1. Overview
- 16.2.2.2. Products
- 16.2.2.3. SWOT Analysis
- 16.2.2.4. Recent Developments
- 16.2.2.5. Financials (Based on Availability)
- 16.2.3 Tecan Group Ltd
- 16.2.3.1. Overview
- 16.2.3.2. Products
- 16.2.3.3. SWOT Analysis
- 16.2.3.4. Recent Developments
- 16.2.3.5. Financials (Based on Availability)
- 16.2.4 Synchron Lab Automation
- 16.2.4.1. Overview
- 16.2.4.2. Products
- 16.2.4.3. SWOT Analysis
- 16.2.4.4. Recent Developments
- 16.2.4.5. Financials (Based on Availability)
- 16.2.5 Analytik Jena AG (Endress+Hauser Group Services AG)
- 16.2.5.1. Overview
- 16.2.5.2. Products
- 16.2.5.3. SWOT Analysis
- 16.2.5.4. Recent Developments
- 16.2.5.5. Financials (Based on Availability)
- 16.2.6 Aurora Biomed Inc
- 16.2.6.1. Overview
- 16.2.6.2. Products
- 16.2.6.3. SWOT Analysis
- 16.2.6.4. Recent Developments
- 16.2.6.5. Financials (Based on Availability)
- 16.2.7 Eppendorf AG
- 16.2.7.1. Overview
- 16.2.7.2. Products
- 16.2.7.3. SWOT Analysis
- 16.2.7.4. Recent Developments
- 16.2.7.5. Financials (Based on Availability)
- 16.2.8 Formulatrix Inc
- 16.2.8.1. Overview
- 16.2.8.2. Products
- 16.2.8.3. SWOT Analysis
- 16.2.8.4. Recent Developments
- 16.2.8.5. Financials (Based on Availability)
- 16.2.9 Corning Incorporated
- 16.2.9.1. Overview
- 16.2.9.2. Products
- 16.2.9.3. SWOT Analysis
- 16.2.9.4. Recent Developments
- 16.2.9.5. Financials (Based on Availability)
- 16.2.10 Hamilton Company
- 16.2.10.1. Overview
- 16.2.10.2. Products
- 16.2.10.3. SWOT Analysis
- 16.2.10.4. Recent Developments
- 16.2.10.5. Financials (Based on Availability)
- 16.2.11 Hudson Robotics Inc
- 16.2.11.1. Overview
- 16.2.11.2. Products
- 16.2.11.3. SWOT Analysis
- 16.2.11.4. Recent Developments
- 16.2.11.5. Financials (Based on Availability)
- 16.2.12 Thermo Fisher Scientific
- 16.2.12.1. Overview
- 16.2.12.2. Products
- 16.2.12.3. SWOT Analysis
- 16.2.12.4. Recent Developments
- 16.2.12.5. Financials (Based on Availability)
- 16.2.13 Agilent Technologies
- 16.2.13.1. Overview
- 16.2.13.2. Products
- 16.2.13.3. SWOT Analysis
- 16.2.13.4. Recent Developments
- 16.2.13.5. Financials (Based on Availability)
- 16.2.14 Danaher Corporation (Beckman Coulter Inc )
- 16.2.14.1. Overview
- 16.2.14.2. Products
- 16.2.14.3. SWOT Analysis
- 16.2.14.4. Recent Developments
- 16.2.14.5. Financials (Based on Availability)
- 16.2.15 Perkin Elmer Inc
- 16.2.15.1. Overview
- 16.2.15.2. Products
- 16.2.15.3. SWOT Analysis
- 16.2.15.4. Recent Developments
- 16.2.15.5. Financials (Based on Availability)
- 16.2.1 Becton Dickinson and Company
List of Figures
- Figure 1: Global Global Automated Liquid Handling System Market Revenue Breakdown (Million, %) by Region 2024 & 2032
- Figure 2: Global Global Automated Liquid Handling System Market Volume Breakdown (K Unit, %) by Region 2024 & 2032
- Figure 3: North America Global Automated Liquid Handling System Market Revenue (Million), by Country 2024 & 2032
- Figure 4: North America Global Automated Liquid Handling System Market Volume (K Unit), by Country 2024 & 2032
- Figure 5: North America Global Automated Liquid Handling System Market Revenue Share (%), by Country 2024 & 2032
- Figure 6: North America Global Automated Liquid Handling System Market Volume Share (%), by Country 2024 & 2032
- Figure 7: Europe Global Automated Liquid Handling System Market Revenue (Million), by Country 2024 & 2032
- Figure 8: Europe Global Automated Liquid Handling System Market Volume (K Unit), by Country 2024 & 2032
- Figure 9: Europe Global Automated Liquid Handling System Market Revenue Share (%), by Country 2024 & 2032
- Figure 10: Europe Global Automated Liquid Handling System Market Volume Share (%), by Country 2024 & 2032
- Figure 11: Asia Pacific Global Automated Liquid Handling System Market Revenue (Million), by Country 2024 & 2032
- Figure 12: Asia Pacific Global Automated Liquid Handling System Market Volume (K Unit), by Country 2024 & 2032
- Figure 13: Asia Pacific Global Automated Liquid Handling System Market Revenue Share (%), by Country 2024 & 2032
- Figure 14: Asia Pacific Global Automated Liquid Handling System Market Volume Share (%), by Country 2024 & 2032
- Figure 15: Middle East and Africa Global Automated Liquid Handling System Market Revenue (Million), by Country 2024 & 2032
- Figure 16: Middle East and Africa Global Automated Liquid Handling System Market Volume (K Unit), by Country 2024 & 2032
- Figure 17: Middle East and Africa Global Automated Liquid Handling System Market Revenue Share (%), by Country 2024 & 2032
- Figure 18: Middle East and Africa Global Automated Liquid Handling System Market Volume Share (%), by Country 2024 & 2032
- Figure 19: South America Global Automated Liquid Handling System Market Revenue (Million), by Country 2024 & 2032
- Figure 20: South America Global Automated Liquid Handling System Market Volume (K Unit), by Country 2024 & 2032
- Figure 21: South America Global Automated Liquid Handling System Market Revenue Share (%), by Country 2024 & 2032
- Figure 22: South America Global Automated Liquid Handling System Market Volume Share (%), by Country 2024 & 2032
- Figure 23: North America Global Automated Liquid Handling System Market Revenue (Million), by Type 2024 & 2032
- Figure 24: North America Global Automated Liquid Handling System Market Volume (K Unit), by Type 2024 & 2032
- Figure 25: North America Global Automated Liquid Handling System Market Revenue Share (%), by Type 2024 & 2032
- Figure 26: North America Global Automated Liquid Handling System Market Volume Share (%), by Type 2024 & 2032
- Figure 27: North America Global Automated Liquid Handling System Market Revenue (Million), by Product 2024 & 2032
- Figure 28: North America Global Automated Liquid Handling System Market Volume (K Unit), by Product 2024 & 2032
- Figure 29: North America Global Automated Liquid Handling System Market Revenue Share (%), by Product 2024 & 2032
- Figure 30: North America Global Automated Liquid Handling System Market Volume Share (%), by Product 2024 & 2032
- Figure 31: North America Global Automated Liquid Handling System Market Revenue (Million), by End User 2024 & 2032
- Figure 32: North America Global Automated Liquid Handling System Market Volume (K Unit), by End User 2024 & 2032
- Figure 33: North America Global Automated Liquid Handling System Market Revenue Share (%), by End User 2024 & 2032
- Figure 34: North America Global Automated Liquid Handling System Market Volume Share (%), by End User 2024 & 2032
- Figure 35: North America Global Automated Liquid Handling System Market Revenue (Million), by Country 2024 & 2032
- Figure 36: North America Global Automated Liquid Handling System Market Volume (K Unit), by Country 2024 & 2032
- Figure 37: North America Global Automated Liquid Handling System Market Revenue Share (%), by Country 2024 & 2032
- Figure 38: North America Global Automated Liquid Handling System Market Volume Share (%), by Country 2024 & 2032
- Figure 39: Europe Global Automated Liquid Handling System Market Revenue (Million), by Type 2024 & 2032
- Figure 40: Europe Global Automated Liquid Handling System Market Volume (K Unit), by Type 2024 & 2032
- Figure 41: Europe Global Automated Liquid Handling System Market Revenue Share (%), by Type 2024 & 2032
- Figure 42: Europe Global Automated Liquid Handling System Market Volume Share (%), by Type 2024 & 2032
- Figure 43: Europe Global Automated Liquid Handling System Market Revenue (Million), by Product 2024 & 2032
- Figure 44: Europe Global Automated Liquid Handling System Market Volume (K Unit), by Product 2024 & 2032
- Figure 45: Europe Global Automated Liquid Handling System Market Revenue Share (%), by Product 2024 & 2032
- Figure 46: Europe Global Automated Liquid Handling System Market Volume Share (%), by Product 2024 & 2032
- Figure 47: Europe Global Automated Liquid Handling System Market Revenue (Million), by End User 2024 & 2032
- Figure 48: Europe Global Automated Liquid Handling System Market Volume (K Unit), by End User 2024 & 2032
- Figure 49: Europe Global Automated Liquid Handling System Market Revenue Share (%), by End User 2024 & 2032
- Figure 50: Europe Global Automated Liquid Handling System Market Volume Share (%), by End User 2024 & 2032
- Figure 51: Europe Global Automated Liquid Handling System Market Revenue (Million), by Country 2024 & 2032
- Figure 52: Europe Global Automated Liquid Handling System Market Volume (K Unit), by Country 2024 & 2032
- Figure 53: Europe Global Automated Liquid Handling System Market Revenue Share (%), by Country 2024 & 2032
- Figure 54: Europe Global Automated Liquid Handling System Market Volume Share (%), by Country 2024 & 2032
- Figure 55: Asia Pacific Global Automated Liquid Handling System Market Revenue (Million), by Type 2024 & 2032
- Figure 56: Asia Pacific Global Automated Liquid Handling System Market Volume (K Unit), by Type 2024 & 2032
- Figure 57: Asia Pacific Global Automated Liquid Handling System Market Revenue Share (%), by Type 2024 & 2032
- Figure 58: Asia Pacific Global Automated Liquid Handling System Market Volume Share (%), by Type 2024 & 2032
- Figure 59: Asia Pacific Global Automated Liquid Handling System Market Revenue (Million), by Product 2024 & 2032
- Figure 60: Asia Pacific Global Automated Liquid Handling System Market Volume (K Unit), by Product 2024 & 2032
- Figure 61: Asia Pacific Global Automated Liquid Handling System Market Revenue Share (%), by Product 2024 & 2032
- Figure 62: Asia Pacific Global Automated Liquid Handling System Market Volume Share (%), by Product 2024 & 2032
- Figure 63: Asia Pacific Global Automated Liquid Handling System Market Revenue (Million), by End User 2024 & 2032
- Figure 64: Asia Pacific Global Automated Liquid Handling System Market Volume (K Unit), by End User 2024 & 2032
- Figure 65: Asia Pacific Global Automated Liquid Handling System Market Revenue Share (%), by End User 2024 & 2032
- Figure 66: Asia Pacific Global Automated Liquid Handling System Market Volume Share (%), by End User 2024 & 2032
- Figure 67: Asia Pacific Global Automated Liquid Handling System Market Revenue (Million), by Country 2024 & 2032
- Figure 68: Asia Pacific Global Automated Liquid Handling System Market Volume (K Unit), by Country 2024 & 2032
- Figure 69: Asia Pacific Global Automated Liquid Handling System Market Revenue Share (%), by Country 2024 & 2032
- Figure 70: Asia Pacific Global Automated Liquid Handling System Market Volume Share (%), by Country 2024 & 2032
- Figure 71: Middle East and Africa Global Automated Liquid Handling System Market Revenue (Million), by Type 2024 & 2032
- Figure 72: Middle East and Africa Global Automated Liquid Handling System Market Volume (K Unit), by Type 2024 & 2032
- Figure 73: Middle East and Africa Global Automated Liquid Handling System Market Revenue Share (%), by Type 2024 & 2032
- Figure 74: Middle East and Africa Global Automated Liquid Handling System Market Volume Share (%), by Type 2024 & 2032
- Figure 75: Middle East and Africa Global Automated Liquid Handling System Market Revenue (Million), by Product 2024 & 2032
- Figure 76: Middle East and Africa Global Automated Liquid Handling System Market Volume (K Unit), by Product 2024 & 2032
- Figure 77: Middle East and Africa Global Automated Liquid Handling System Market Revenue Share (%), by Product 2024 & 2032
- Figure 78: Middle East and Africa Global Automated Liquid Handling System Market Volume Share (%), by Product 2024 & 2032
- Figure 79: Middle East and Africa Global Automated Liquid Handling System Market Revenue (Million), by End User 2024 & 2032
- Figure 80: Middle East and Africa Global Automated Liquid Handling System Market Volume (K Unit), by End User 2024 & 2032
- Figure 81: Middle East and Africa Global Automated Liquid Handling System Market Revenue Share (%), by End User 2024 & 2032
- Figure 82: Middle East and Africa Global Automated Liquid Handling System Market Volume Share (%), by End User 2024 & 2032
- Figure 83: Middle East and Africa Global Automated Liquid Handling System Market Revenue (Million), by Country 2024 & 2032
- Figure 84: Middle East and Africa Global Automated Liquid Handling System Market Volume (K Unit), by Country 2024 & 2032
- Figure 85: Middle East and Africa Global Automated Liquid Handling System Market Revenue Share (%), by Country 2024 & 2032
- Figure 86: Middle East and Africa Global Automated Liquid Handling System Market Volume Share (%), by Country 2024 & 2032
- Figure 87: South America Global Automated Liquid Handling System Market Revenue (Million), by Type 2024 & 2032
- Figure 88: South America Global Automated Liquid Handling System Market Volume (K Unit), by Type 2024 & 2032
- Figure 89: South America Global Automated Liquid Handling System Market Revenue Share (%), by Type 2024 & 2032
- Figure 90: South America Global Automated Liquid Handling System Market Volume Share (%), by Type 2024 & 2032
- Figure 91: South America Global Automated Liquid Handling System Market Revenue (Million), by Product 2024 & 2032
- Figure 92: South America Global Automated Liquid Handling System Market Volume (K Unit), by Product 2024 & 2032
- Figure 93: South America Global Automated Liquid Handling System Market Revenue Share (%), by Product 2024 & 2032
- Figure 94: South America Global Automated Liquid Handling System Market Volume Share (%), by Product 2024 & 2032
- Figure 95: South America Global Automated Liquid Handling System Market Revenue (Million), by End User 2024 & 2032
- Figure 96: South America Global Automated Liquid Handling System Market Volume (K Unit), by End User 2024 & 2032
- Figure 97: South America Global Automated Liquid Handling System Market Revenue Share (%), by End User 2024 & 2032
- Figure 98: South America Global Automated Liquid Handling System Market Volume Share (%), by End User 2024 & 2032
- Figure 99: South America Global Automated Liquid Handling System Market Revenue (Million), by Country 2024 & 2032
- Figure 100: South America Global Automated Liquid Handling System Market Volume (K Unit), by Country 2024 & 2032
- Figure 101: South America Global Automated Liquid Handling System Market Revenue Share (%), by Country 2024 & 2032
- Figure 102: South America Global Automated Liquid Handling System Market Volume Share (%), by Country 2024 & 2032
List of Tables
- Table 1: Global Automated Liquid Handling System Market Revenue Million Forecast, by Region 2019 & 2032
- Table 2: Global Automated Liquid Handling System Market Volume K Unit Forecast, by Region 2019 & 2032
- Table 3: Global Automated Liquid Handling System Market Revenue Million Forecast, by Type 2019 & 2032
- Table 4: Global Automated Liquid Handling System Market Volume K Unit Forecast, by Type 2019 & 2032
- Table 5: Global Automated Liquid Handling System Market Revenue Million Forecast, by Product 2019 & 2032
- Table 6: Global Automated Liquid Handling System Market Volume K Unit Forecast, by Product 2019 & 2032
- Table 7: Global Automated Liquid Handling System Market Revenue Million Forecast, by End User 2019 & 2032
- Table 8: Global Automated Liquid Handling System Market Volume K Unit Forecast, by End User 2019 & 2032
- Table 9: Global Automated Liquid Handling System Market Revenue Million Forecast, by Region 2019 & 2032
- Table 10: Global Automated Liquid Handling System Market Volume K Unit Forecast, by Region 2019 & 2032
- Table 11: Global Automated Liquid Handling System Market Revenue Million Forecast, by Country 2019 & 2032
- Table 12: Global Automated Liquid Handling System Market Volume K Unit Forecast, by Country 2019 & 2032
- Table 13: United States Global Automated Liquid Handling System Market Revenue (Million) Forecast, by Application 2019 & 2032
- Table 14: United States Global Automated Liquid Handling System Market Volume (K Unit) Forecast, by Application 2019 & 2032
- Table 15: Canada Global Automated Liquid Handling System Market Revenue (Million) Forecast, by Application 2019 & 2032
- Table 16: Canada Global Automated Liquid Handling System Market Volume (K Unit) Forecast, by Application 2019 & 2032
- Table 17: Mexico Global Automated Liquid Handling System Market Revenue (Million) Forecast, by Application 2019 & 2032
- Table 18: Mexico Global Automated Liquid Handling System Market Volume (K Unit) Forecast, by Application 2019 & 2032
- Table 19: Global Automated Liquid Handling System Market Revenue Million Forecast, by Country 2019 & 2032
- Table 20: Global Automated Liquid Handling System Market Volume K Unit Forecast, by Country 2019 & 2032
- Table 21: Germany Global Automated Liquid Handling System Market Revenue (Million) Forecast, by Application 2019 & 2032
- Table 22: Germany Global Automated Liquid Handling System Market Volume (K Unit) Forecast, by Application 2019 & 2032
- Table 23: United Kingdom Global Automated Liquid Handling System Market Revenue (Million) Forecast, by Application 2019 & 2032
- Table 24: United Kingdom Global Automated Liquid Handling System Market Volume (K Unit) Forecast, by Application 2019 & 2032
- Table 25: France Global Automated Liquid Handling System Market Revenue (Million) Forecast, by Application 2019 & 2032
- Table 26: France Global Automated Liquid Handling System Market Volume (K Unit) Forecast, by Application 2019 & 2032
- Table 27: Italy Global Automated Liquid Handling System Market Revenue (Million) Forecast, by Application 2019 & 2032
- Table 28: Italy Global Automated Liquid Handling System Market Volume (K Unit) Forecast, by Application 2019 & 2032
- Table 29: Spain Global Automated Liquid Handling System Market Revenue (Million) Forecast, by Application 2019 & 2032
- Table 30: Spain Global Automated Liquid Handling System Market Volume (K Unit) Forecast, by Application 2019 & 2032
- Table 31: Rest of Europe Global Automated Liquid Handling System Market Revenue (Million) Forecast, by Application 2019 & 2032
- Table 32: Rest of Europe Global Automated Liquid Handling System Market Volume (K Unit) Forecast, by Application 2019 & 2032
- Table 33: Global Automated Liquid Handling System Market Revenue Million Forecast, by Country 2019 & 2032
- Table 34: Global Automated Liquid Handling System Market Volume K Unit Forecast, by Country 2019 & 2032
- Table 35: China Global Automated Liquid Handling System Market Revenue (Million) Forecast, by Application 2019 & 2032
- Table 36: China Global Automated Liquid Handling System Market Volume (K Unit) Forecast, by Application 2019 & 2032
- Table 37: Japan Global Automated Liquid Handling System Market Revenue (Million) Forecast, by Application 2019 & 2032
- Table 38: Japan Global Automated Liquid Handling System Market Volume (K Unit) Forecast, by Application 2019 & 2032
- Table 39: India Global Automated Liquid Handling System Market Revenue (Million) Forecast, by Application 2019 & 2032
- Table 40: India Global Automated Liquid Handling System Market Volume (K Unit) Forecast, by Application 2019 & 2032
- Table 41: Australia Global Automated Liquid Handling System Market Revenue (Million) Forecast, by Application 2019 & 2032
- Table 42: Australia Global Automated Liquid Handling System Market Volume (K Unit) Forecast, by Application 2019 & 2032
- Table 43: South Korea Global Automated Liquid Handling System Market Revenue (Million) Forecast, by Application 2019 & 2032
- Table 44: South Korea Global Automated Liquid Handling System Market Volume (K Unit) Forecast, by Application 2019 & 2032
- Table 45: Rest of Asia Pacific Global Automated Liquid Handling System Market Revenue (Million) Forecast, by Application 2019 & 2032
- Table 46: Rest of Asia Pacific Global Automated Liquid Handling System Market Volume (K Unit) Forecast, by Application 2019 & 2032
- Table 47: Global Automated Liquid Handling System Market Revenue Million Forecast, by Country 2019 & 2032
- Table 48: Global Automated Liquid Handling System Market Volume K Unit Forecast, by Country 2019 & 2032
- Table 49: GCC Global Automated Liquid Handling System Market Revenue (Million) Forecast, by Application 2019 & 2032
- Table 50: GCC Global Automated Liquid Handling System Market Volume (K Unit) Forecast, by Application 2019 & 2032
- Table 51: South Africa Global Automated Liquid Handling System Market Revenue (Million) Forecast, by Application 2019 & 2032
- Table 52: South Africa Global Automated Liquid Handling System Market Volume (K Unit) Forecast, by Application 2019 & 2032
- Table 53: Rest of Middle East and Africa Global Automated Liquid Handling System Market Revenue (Million) Forecast, by Application 2019 & 2032
- Table 54: Rest of Middle East and Africa Global Automated Liquid Handling System Market Volume (K Unit) Forecast, by Application 2019 & 2032
- Table 55: Global Automated Liquid Handling System Market Revenue Million Forecast, by Country 2019 & 2032
- Table 56: Global Automated Liquid Handling System Market Volume K Unit Forecast, by Country 2019 & 2032
- Table 57: Brazil Global Automated Liquid Handling System Market Revenue (Million) Forecast, by Application 2019 & 2032
- Table 58: Brazil Global Automated Liquid Handling System Market Volume (K Unit) Forecast, by Application 2019 & 2032
- Table 59: Argentina Global Automated Liquid Handling System Market Revenue (Million) Forecast, by Application 2019 & 2032
- Table 60: Argentina Global Automated Liquid Handling System Market Volume (K Unit) Forecast, by Application 2019 & 2032
- Table 61: Rest of South America Global Automated Liquid Handling System Market Revenue (Million) Forecast, by Application 2019 & 2032
- Table 62: Rest of South America Global Automated Liquid Handling System Market Volume (K Unit) Forecast, by Application 2019 & 2032
- Table 63: Global Automated Liquid Handling System Market Revenue Million Forecast, by Type 2019 & 2032
- Table 64: Global Automated Liquid Handling System Market Volume K Unit Forecast, by Type 2019 & 2032
- Table 65: Global Automated Liquid Handling System Market Revenue Million Forecast, by Product 2019 & 2032
- Table 66: Global Automated Liquid Handling System Market Volume K Unit Forecast, by Product 2019 & 2032
- Table 67: Global Automated Liquid Handling System Market Revenue Million Forecast, by End User 2019 & 2032
- Table 68: Global Automated Liquid Handling System Market Volume K Unit Forecast, by End User 2019 & 2032
- Table 69: Global Automated Liquid Handling System Market Revenue Million Forecast, by Country 2019 & 2032
- Table 70: Global Automated Liquid Handling System Market Volume K Unit Forecast, by Country 2019 & 2032
- Table 71: United States Global Automated Liquid Handling System Market Revenue (Million) Forecast, by Application 2019 & 2032
- Table 72: United States Global Automated Liquid Handling System Market Volume (K Unit) Forecast, by Application 2019 & 2032
- Table 73: Canada Global Automated Liquid Handling System Market Revenue (Million) Forecast, by Application 2019 & 2032
- Table 74: Canada Global Automated Liquid Handling System Market Volume (K Unit) Forecast, by Application 2019 & 2032
- Table 75: Mexico Global Automated Liquid Handling System Market Revenue (Million) Forecast, by Application 2019 & 2032
- Table 76: Mexico Global Automated Liquid Handling System Market Volume (K Unit) Forecast, by Application 2019 & 2032
- Table 77: Global Automated Liquid Handling System Market Revenue Million Forecast, by Type 2019 & 2032
- Table 78: Global Automated Liquid Handling System Market Volume K Unit Forecast, by Type 2019 & 2032
- Table 79: Global Automated Liquid Handling System Market Revenue Million Forecast, by Product 2019 & 2032
- Table 80: Global Automated Liquid Handling System Market Volume K Unit Forecast, by Product 2019 & 2032
- Table 81: Global Automated Liquid Handling System Market Revenue Million Forecast, by End User 2019 & 2032
- Table 82: Global Automated Liquid Handling System Market Volume K Unit Forecast, by End User 2019 & 2032
- Table 83: Global Automated Liquid Handling System Market Revenue Million Forecast, by Country 2019 & 2032
- Table 84: Global Automated Liquid Handling System Market Volume K Unit Forecast, by Country 2019 & 2032
- Table 85: Germany Global Automated Liquid Handling System Market Revenue (Million) Forecast, by Application 2019 & 2032
- Table 86: Germany Global Automated Liquid Handling System Market Volume (K Unit) Forecast, by Application 2019 & 2032
- Table 87: United Kingdom Global Automated Liquid Handling System Market Revenue (Million) Forecast, by Application 2019 & 2032
- Table 88: United Kingdom Global Automated Liquid Handling System Market Volume (K Unit) Forecast, by Application 2019 & 2032
- Table 89: France Global Automated Liquid Handling System Market Revenue (Million) Forecast, by Application 2019 & 2032
- Table 90: France Global Automated Liquid Handling System Market Volume (K Unit) Forecast, by Application 2019 & 2032
- Table 91: Italy Global Automated Liquid Handling System Market Revenue (Million) Forecast, by Application 2019 & 2032
- Table 92: Italy Global Automated Liquid Handling System Market Volume (K Unit) Forecast, by Application 2019 & 2032
- Table 93: Spain Global Automated Liquid Handling System Market Revenue (Million) Forecast, by Application 2019 & 2032
- Table 94: Spain Global Automated Liquid Handling System Market Volume (K Unit) Forecast, by Application 2019 & 2032
- Table 95: Rest of Europe Global Automated Liquid Handling System Market Revenue (Million) Forecast, by Application 2019 & 2032
- Table 96: Rest of Europe Global Automated Liquid Handling System Market Volume (K Unit) Forecast, by Application 2019 & 2032
- Table 97: Global Automated Liquid Handling System Market Revenue Million Forecast, by Type 2019 & 2032
- Table 98: Global Automated Liquid Handling System Market Volume K Unit Forecast, by Type 2019 & 2032
- Table 99: Global Automated Liquid Handling System Market Revenue Million Forecast, by Product 2019 & 2032
- Table 100: Global Automated Liquid Handling System Market Volume K Unit Forecast, by Product 2019 & 2032
- Table 101: Global Automated Liquid Handling System Market Revenue Million Forecast, by End User 2019 & 2032
- Table 102: Global Automated Liquid Handling System Market Volume K Unit Forecast, by End User 2019 & 2032
- Table 103: Global Automated Liquid Handling System Market Revenue Million Forecast, by Country 2019 & 2032
- Table 104: Global Automated Liquid Handling System Market Volume K Unit Forecast, by Country 2019 & 2032
- Table 105: China Global Automated Liquid Handling System Market Revenue (Million) Forecast, by Application 2019 & 2032
- Table 106: China Global Automated Liquid Handling System Market Volume (K Unit) Forecast, by Application 2019 & 2032
- Table 107: Japan Global Automated Liquid Handling System Market Revenue (Million) Forecast, by Application 2019 & 2032
- Table 108: Japan Global Automated Liquid Handling System Market Volume (K Unit) Forecast, by Application 2019 & 2032
- Table 109: India Global Automated Liquid Handling System Market Revenue (Million) Forecast, by Application 2019 & 2032
- Table 110: India Global Automated Liquid Handling System Market Volume (K Unit) Forecast, by Application 2019 & 2032
- Table 111: Australia Global Automated Liquid Handling System Market Revenue (Million) Forecast, by Application 2019 & 2032
- Table 112: Australia Global Automated Liquid Handling System Market Volume (K Unit) Forecast, by Application 2019 & 2032
- Table 113: South Korea Global Automated Liquid Handling System Market Revenue (Million) Forecast, by Application 2019 & 2032
- Table 114: South Korea Global Automated Liquid Handling System Market Volume (K Unit) Forecast, by Application 2019 & 2032
- Table 115: Rest of Asia Pacific Global Automated Liquid Handling System Market Revenue (Million) Forecast, by Application 2019 & 2032
- Table 116: Rest of Asia Pacific Global Automated Liquid Handling System Market Volume (K Unit) Forecast, by Application 2019 & 2032
- Table 117: Global Automated Liquid Handling System Market Revenue Million Forecast, by Type 2019 & 2032
- Table 118: Global Automated Liquid Handling System Market Volume K Unit Forecast, by Type 2019 & 2032
- Table 119: Global Automated Liquid Handling System Market Revenue Million Forecast, by Product 2019 & 2032
- Table 120: Global Automated Liquid Handling System Market Volume K Unit Forecast, by Product 2019 & 2032
- Table 121: Global Automated Liquid Handling System Market Revenue Million Forecast, by End User 2019 & 2032
- Table 122: Global Automated Liquid Handling System Market Volume K Unit Forecast, by End User 2019 & 2032
- Table 123: Global Automated Liquid Handling System Market Revenue Million Forecast, by Country 2019 & 2032
- Table 124: Global Automated Liquid Handling System Market Volume K Unit Forecast, by Country 2019 & 2032
- Table 125: GCC Global Automated Liquid Handling System Market Revenue (Million) Forecast, by Application 2019 & 2032
- Table 126: GCC Global Automated Liquid Handling System Market Volume (K Unit) Forecast, by Application 2019 & 2032
- Table 127: South Africa Global Automated Liquid Handling System Market Revenue (Million) Forecast, by Application 2019 & 2032
- Table 128: South Africa Global Automated Liquid Handling System Market Volume (K Unit) Forecast, by Application 2019 & 2032
- Table 129: Rest of Middle East and Africa Global Automated Liquid Handling System Market Revenue (Million) Forecast, by Application 2019 & 2032
- Table 130: Rest of Middle East and Africa Global Automated Liquid Handling System Market Volume (K Unit) Forecast, by Application 2019 & 2032
- Table 131: Global Automated Liquid Handling System Market Revenue Million Forecast, by Type 2019 & 2032
- Table 132: Global Automated Liquid Handling System Market Volume K Unit Forecast, by Type 2019 & 2032
- Table 133: Global Automated Liquid Handling System Market Revenue Million Forecast, by Product 2019 & 2032
- Table 134: Global Automated Liquid Handling System Market Volume K Unit Forecast, by Product 2019 & 2032
- Table 135: Global Automated Liquid Handling System Market Revenue Million Forecast, by End User 2019 & 2032
- Table 136: Global Automated Liquid Handling System Market Volume K Unit Forecast, by End User 2019 & 2032
- Table 137: Global Automated Liquid Handling System Market Revenue Million Forecast, by Country 2019 & 2032
- Table 138: Global Automated Liquid Handling System Market Volume K Unit Forecast, by Country 2019 & 2032
- Table 139: Brazil Global Automated Liquid Handling System Market Revenue (Million) Forecast, by Application 2019 & 2032
- Table 140: Brazil Global Automated Liquid Handling System Market Volume (K Unit) Forecast, by Application 2019 & 2032
- Table 141: Argentina Global Automated Liquid Handling System Market Revenue (Million) Forecast, by Application 2019 & 2032
- Table 142: Argentina Global Automated Liquid Handling System Market Volume (K Unit) Forecast, by Application 2019 & 2032
- Table 143: Rest of South America Global Automated Liquid Handling System Market Revenue (Million) Forecast, by Application 2019 & 2032
- Table 144: Rest of South America Global Automated Liquid Handling System Market Volume (K Unit) Forecast, by Application 2019 & 2032
Frequently Asked Questions
1. What is the projected Compound Annual Growth Rate (CAGR) of the Global Automated Liquid Handling System Market?
The projected CAGR is approximately 6.80%.
2. Which companies are prominent players in the Global Automated Liquid Handling System Market?
Key companies in the market include Becton Dickinson and Company, Mettler-Toledo International Inc, Tecan Group Ltd, Synchron Lab Automation, Analytik Jena AG (Endress+Hauser Group Services AG), Aurora Biomed Inc, Eppendorf AG, Formulatrix Inc, Corning Incorporated, Hamilton Company, Hudson Robotics Inc, Thermo Fisher Scientific, Agilent Technologies, Danaher Corporation (Beckman Coulter Inc ), Perkin Elmer Inc.
3. What are the main segments of the Global Automated Liquid Handling System Market?
The market segments include Type, Product, End User.
4. Can you provide details about the market size?
The market size is estimated to be USD XX Million as of 2022.
5. What are some drivers contributing to market growth?
Flexibility and Adaptability of Lab Automation Systems; Technological Advancements in Automated Liquid Handling Systems.
6. What are the notable trends driving market growth?
Liquid Handling Workstation are Expected to Witness Healthy Growth Over the Forecast Period.
7. Are there any restraints impacting market growth?
Slower Adoption Rates in Small- and Medium-sized Organizations.
8. Can you provide examples of recent developments in the market?
In June 2022, Beckman Coulter Life Sciences, and a company of Danaher Corporationunleashes the power of next-generation sequencing and makes it more accessible for research labs of all sizes with the launched of the Biomek NGeniuS liquid handling system
9. What pricing options are available for accessing the report?
Pricing options include single-user, multi-user, and enterprise licenses priced at USD 4750, USD 5250, and USD 8750 respectively.
10. Is the market size provided in terms of value or volume?
The market size is provided in terms of value, measured in Million and volume, measured in K Unit.
11. Are there any specific market keywords associated with the report?
Yes, the market keyword associated with the report is "Global Automated Liquid Handling System Market," which aids in identifying and referencing the specific market segment covered.
12. How do I determine which pricing option suits my needs best?
The pricing options vary based on user requirements and access needs. Individual users may opt for single-user licenses, while businesses requiring broader access may choose multi-user or enterprise licenses for cost-effective access to the report.
13. Are there any additional resources or data provided in the Global Automated Liquid Handling System Market report?
While the report offers comprehensive insights, it's advisable to review the specific contents or supplementary materials provided to ascertain if additional resources or data are available.
14. How can I stay updated on further developments or reports in the Global Automated Liquid Handling System Market?
To stay informed about further developments, trends, and reports in the Global Automated Liquid Handling System Market, consider subscribing to industry newsletters, following relevant companies and organizations, or regularly checking reputable industry news sources and publications.
Methodology
Step 1 - Identification of Relevant Samples Size from Population Database


Step 2 - Approaches for Defining Global Market Size (Value, Volume* & Price*)

Note*: In applicable scenarios
Step 3 - Data Sources
Primary Research
- Web Analytics
- Survey Reports
- Research Institute
- Latest Research Reports
- Opinion Leaders
Secondary Research
- Annual Reports
- White Paper
- Latest Press Release
- Industry Association
- Paid Database
- Investor Presentations

Step 4 - Data Triangulation
Involves using different sources of information in order to increase the validity of a study
These sources are likely to be stakeholders in a program - participants, other researchers, program staff, other community members, and so on.
Then we put all data in single framework & apply various statistical tools to find out the dynamic on the market.
During the analysis stage, feedback from the stakeholder groups would be compared to determine areas of agreement as well as areas of divergence


