
Key Insights
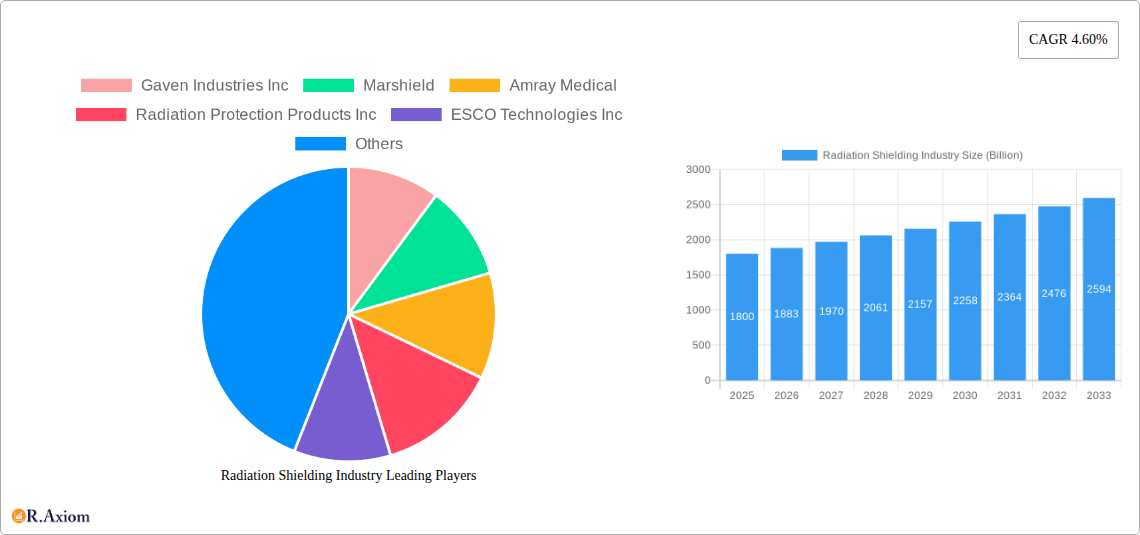
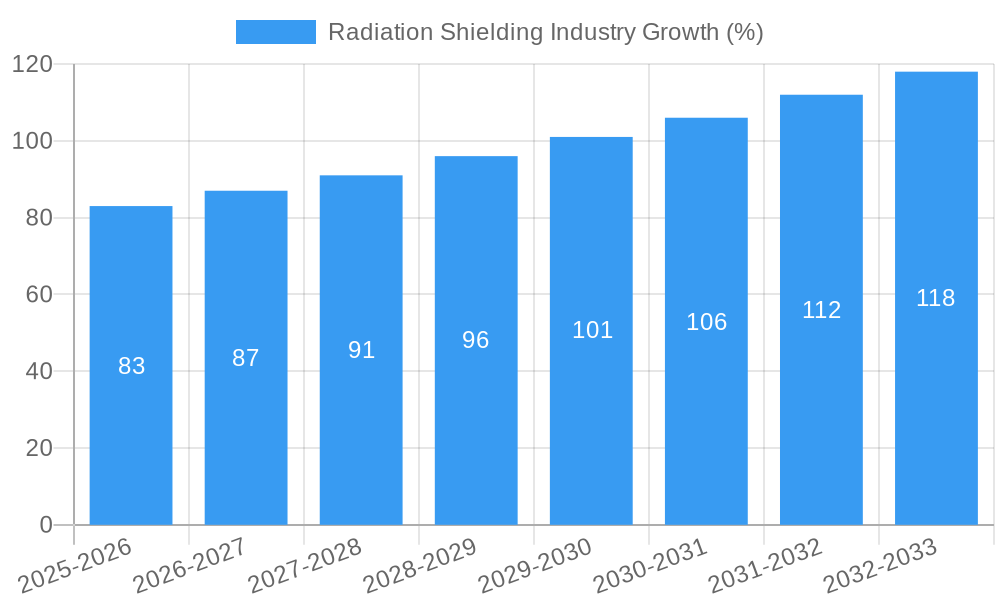
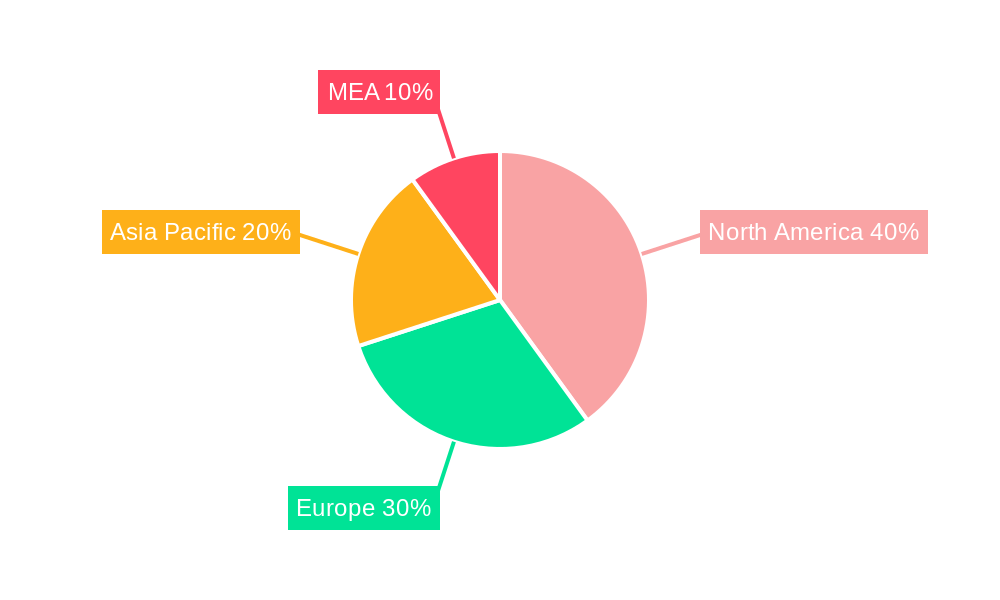
The global radiation shielding market, valued at $1.8 billion in 2025, is projected to experience robust growth, driven by a compound annual growth rate (CAGR) of 4.60% from 2025 to 2033. This expansion is fueled by several key factors. The increasing prevalence of cancer and other diseases requiring radiation therapy is a primary driver, leading to a higher demand for effective shielding solutions in hospitals and diagnostic centers. Furthermore, the growth of research institutions conducting radiation-related studies necessitates advanced shielding technologies to ensure the safety of personnel and the environment. Technological advancements in shielding materials, offering improved performance and reduced weight, are also contributing to market growth. Regulatory mandates for radiation safety in healthcare and research settings further solidify the demand for high-quality shielding products. The market is segmented by end-user (hospitals & diagnostic centers, research institutes, other end-users) and solution (radiation therapy shielding, diagnostic shielding), with hospitals and diagnostic centers currently dominating market share due to the high volume of radiation procedures performed. North America is expected to hold a significant market share, owing to the region's advanced healthcare infrastructure and high adoption rates of radiation-based therapies. However, rapidly developing economies in Asia-Pacific and the Middle East & Africa are anticipated to show substantial growth, driven by increasing healthcare spending and infrastructure development. Competition in the market is moderately intense, with several established players and emerging companies vying for market share.
The market is, however, subject to certain restraints. High initial investment costs for radiation shielding equipment can be a barrier for smaller healthcare facilities and research institutions in developing regions. Furthermore, the development and adoption of innovative, cost-effective shielding solutions remains an ongoing challenge. Despite these limitations, the overall market outlook for radiation shielding remains positive, with continued growth expected throughout the forecast period. The market will likely see further consolidation through mergers and acquisitions as larger players seek to expand their market presence and product portfolios. The focus on developing sustainable and environmentally friendly shielding materials is also expected to gain traction, aligning with growing global sustainability concerns.
Radiation Shielding Industry: A Comprehensive Market Report (2019-2033)
This detailed report provides a comprehensive analysis of the global radiation shielding industry, projecting a market valuation exceeding $XX billion by 2033. The study covers the period from 2019 to 2033, with 2025 serving as the base and estimated year. This in-depth analysis will be invaluable for industry stakeholders, investors, and strategic decision-makers seeking to navigate this dynamic market.
Radiation Shielding Industry Market Concentration & Innovation
The radiation shielding industry exhibits a moderately concentrated market structure, with a few major players commanding significant market share. While precise market share figures for each company require further analysis, initial estimates suggest that leading companies like Gaven Industries Inc, Marshield, and ESCO Technologies Inc hold substantial positions. However, the market also includes numerous smaller, specialized firms. The industry is characterized by ongoing innovation, driven by the need for improved shielding effectiveness, lighter materials, and cost-effective solutions.
Key Factors Influencing Market Dynamics:
- Regulatory Frameworks: Stringent safety regulations concerning radiation exposure are major drivers of market growth, necessitating robust shielding solutions across various applications. Compliance costs significantly impact market players.
- Product Substitutes: While limited, alternative materials and technologies are continually being explored to offer comparable shielding properties at reduced costs. Competition from novel materials will exert pressure on traditional lead-based shielding.
- End-User Trends: Growth in diagnostic imaging, radiation therapy, and nuclear research fuels the demand for radiation shielding. The increasing adoption of advanced imaging techniques is a key driver for market expansion.
- M&A Activities: Consolidation is a noticeable trend. While precise M&A deal values are unavailable, significant transactions are predicted to occur as larger firms acquire smaller specialized companies in a bid to diversify and expand their market share. The total value of M&A activity in this period is estimated to be around $XX billion.
Radiation Shielding Industry Industry Trends & Insights
The global radiation shielding market is poised for substantial growth throughout the forecast period (2025-2033), exhibiting a Compound Annual Growth Rate (CAGR) of approximately XX%. This growth is fueled by several key factors, including technological advancements driving improved shielding materials and designs, increasing adoption of radiation-based technologies in various industries, and stringent regulations aimed at protecting workers and the public from radiation hazards.
Market penetration remains uneven, with certain regions and applications showing significantly higher adoption rates than others. For instance, developed countries with well-established healthcare infrastructure generally exhibit greater market penetration compared to developing nations. However, the latter represent lucrative growth opportunities due to rising healthcare investments and increasing awareness of radiation safety.
Competitive dynamics are intense, with established players continually competing on price, performance, and innovation. The market is seeing increased competition from new entrants offering innovative solutions that challenge traditional materials and designs. Consumer preferences are shifting towards lightweight, flexible, and customizable shielding solutions to cater to the evolving needs of various applications.
Dominant Markets & Segments in Radiation Shielding Industry
By End User:
- Hospitals and Diagnostic Centers: This segment remains the dominant end-user, representing approximately XX% of the market share. Key growth drivers include an aging global population, increasing incidence of diseases requiring radiation therapy and diagnostic imaging, and expansion of healthcare infrastructure.
- Research Institutes: This segment holds a significant market share, fueled by ongoing research in various fields involving radiation, such as nuclear physics, materials science, and medicine. Investment in scientific research in many countries is boosting the market.
- Other End Users: This segment encompasses various sectors, including industrial applications, aerospace, and defense. Demand varies significantly due to several factors but exhibits steady moderate growth.
By Solution:
- Radiation Therapy Shielding: This is the largest segment by solution, representing approximately XX% of the market share, due to the continuous growth in cancer treatments and advancements in radiation therapy techniques.
- Diagnostic Shielding: This segment is also experiencing significant growth, driven by the increasing adoption of advanced imaging techniques and the need for enhanced patient and staff safety during diagnostic procedures.
Geographic Dominance: North America currently holds the largest market share owing to factors such as robust healthcare infrastructure, high adoption rates of advanced radiation technologies, and stringent radiation safety regulations. However, other regions, like Asia-Pacific, are expected to witness rapid growth, fueled by rising disposable income, expansion of the healthcare industry, and government initiatives to improve healthcare infrastructure.
Radiation Shielding Industry Product Developments
Recent product innovations have focused on developing lighter, more flexible, and cost-effective shielding materials. The introduction of composite materials and advanced design techniques offers improved performance compared to traditional lead-based solutions. These developments cater to market demands for easier installation, increased portability, and enhanced radiation protection. Furthermore, products offering integrated monitoring and control systems are gaining traction in improving safety and operational efficiency. The emphasis is on better protection with enhanced usability and reduced cost.
Report Scope & Segmentation Analysis
This report provides a detailed segmentation of the radiation shielding market based on end-user (Hospitals and Diagnostic Centers, Research Institutes, Other End Users) and solution (Radiation Therapy Shielding, Diagnostic Shielding). Growth projections vary significantly across segments, with the Hospitals and Diagnostic Centers segment expected to experience the highest CAGR. Competitive dynamics are intense within each segment, with established players and smaller niche companies vying for market share.
Hospitals and Diagnostic Centers: This segment is expected to witness robust growth due to rising healthcare expenditure and technological advancements in medical imaging and radiation therapy. Research Institutes: This segment shows steady growth owing to increased investments in research and development and ongoing advancements in radiation-related technologies. Other End Users: This segment’s growth depends heavily on adoption trends in various industrial sectors like aerospace and nuclear energy. Radiation Therapy Shielding: This sector is characterized by the use of advanced materials and designs to enhance protection and efficiency. Diagnostic Shielding: This sector is driven by the increasing need for effective shielding during various diagnostic procedures to improve patient and staff safety.
Key Drivers of Radiation Shielding Industry Growth
The radiation shielding market's growth is propelled by several key factors. Technological advancements leading to improved shielding materials and designs are crucial. Stringent regulatory environments mandating increased radiation safety measures across various sectors stimulate substantial demand. Furthermore, the rise in healthcare spending globally increases the need for advanced shielding solutions in hospitals and diagnostic centers.
Challenges in the Radiation Shielding Industry Sector
Several challenges hinder the radiation shielding industry's growth. Stringent regulatory compliance requirements add to the manufacturing and operational costs. Supply chain disruptions, particularly concerning specialized materials, can cause production delays and impact market dynamics. Intense competition, including new entrants and technological advancements, puts pressure on profit margins. These factors combine to impact overall market stability.
Emerging Opportunities in Radiation Shielding Industry
The radiation shielding industry is presented with significant opportunities. The emergence of novel shielding materials such as high-performance polymers and composites opens new avenues for innovation. Growth in emerging economies, particularly in Asia and Africa, creates lucrative new markets. Increased focus on radiation safety in industrial applications, particularly in nuclear energy and manufacturing, offers further expansion potential.
Leading Players in the Radiation Shielding Industry Market
- Gaven Industries Inc
- Marshield
- Amray Medical
- Radiation Protection Products Inc
- ESCO Technologies Inc
- Nelco Inc
- Global Partners in Shielding Inc
- Veritas Medical Solutions LLC
- A&L Shielding
- Ray-Bar Engineering Corp
Key Developments in Radiation Shielding Industry Industry
- April 2022: Radiaction Medical Ltd. received FDA 510(K) clearance for its RadiationShield System, expanding its market access in the US. This significantly impacts market competition and consumer choices.
- March 2022: Rampart IC secured an exclusive distribution agreement with Japan Lifeline (JLL), opening access to the Japanese market. This boosts Rampart IC's market presence and revenue potential in a significant market.
Strategic Outlook for Radiation Shielding Industry Market
The radiation shielding market is expected to witness continued growth driven by technological innovation, increasing regulatory scrutiny, and the expanding adoption of radiation-based technologies across diverse sectors. The emergence of lightweight and cost-effective shielding solutions will further drive market expansion. Companies focusing on research and development, coupled with strategic partnerships and market expansion initiatives, are best positioned for success in this competitive landscape.
Radiation Shielding Industry Segmentation
-
1. Solution
- 1.1. Radiation Therapy Shielding
- 1.2. Diagnostic Shielding
-
2. End User
- 2.1. Hospitals and Diagnostic Centers
- 2.2. Research Institutes
- 2.3. Other End Users
Radiation Shielding Industry Segmentation By Geography
-
1. North America
- 1.1. United States
- 1.2. Canada
- 1.3. Mexico
-
2. Europe
- 2.1. Germany
- 2.2. United Kingdom
- 2.3. France
- 2.4. Italy
- 2.5. Spain
- 2.6. Rest of Europe
-
3. Asia Pacific
- 3.1. China
- 3.2. Japan
- 3.3. India
- 3.4. Australia
- 3.5. South Korea
- 3.6. Rest of Asia Pacific
-
4. Middle East and Africa
- 4.1. GCC
- 4.2. South Africa
- 4.3. Rest of Middle East and Africa
-
5. South America
- 5.1. Brazil
- 5.2. Argentina
- 5.3. Rest of South America
Radiation Shielding Industry REPORT HIGHLIGHTS
| Aspects | Details |
|---|---|
| Study Period | 2019-2033 |
| Base Year | 2024 |
| Estimated Year | 2025 |
| Forecast Period | 2025-2033 |
| Historical Period | 2019-2024 |
| Growth Rate | CAGR of 4.60% from 2019-2033 |
| Segmentation |
|
Table of Contents
- 1. Introduction
- 1.1. Research Scope
- 1.2. Market Segmentation
- 1.3. Research Methodology
- 1.4. Definitions and Assumptions
- 2. Executive Summary
- 2.1. Introduction
- 3. Market Dynamics
- 3.1. Introduction
- 3.2. Market Drivers
- 3.2.1. Increasing Usage of Nuclear Medicine and Radiation Therapy for Diagnosis and Treatment; Rising Burden of Chronic Diseases; Growing Safety Awareness Among People Working in Radiation-prone Environments
- 3.3. Market Restrains
- 3.3.1. Lack of Awareness Among Healthcare Professionals; High Cost of Radiation Shielding
- 3.4. Market Trends
- 3.4.1. Diagnostic Shielding Holds Significant Share in the Global Medical Radiation Shielding Market
- 4. Market Factor Analysis
- 4.1. Porters Five Forces
- 4.2. Supply/Value Chain
- 4.3. PESTEL analysis
- 4.4. Market Entropy
- 4.5. Patent/Trademark Analysis
- 5. Global Radiation Shielding Industry Analysis, Insights and Forecast, 2019-2031
- 5.1. Market Analysis, Insights and Forecast - by Solution
- 5.1.1. Radiation Therapy Shielding
- 5.1.2. Diagnostic Shielding
- 5.2. Market Analysis, Insights and Forecast - by End User
- 5.2.1. Hospitals and Diagnostic Centers
- 5.2.2. Research Institutes
- 5.2.3. Other End Users
- 5.3. Market Analysis, Insights and Forecast - by Region
- 5.3.1. North America
- 5.3.2. Europe
- 5.3.3. Asia Pacific
- 5.3.4. Middle East and Africa
- 5.3.5. South America
- 5.1. Market Analysis, Insights and Forecast - by Solution
- 6. North America Radiation Shielding Industry Analysis, Insights and Forecast, 2019-2031
- 6.1. Market Analysis, Insights and Forecast - by Solution
- 6.1.1. Radiation Therapy Shielding
- 6.1.2. Diagnostic Shielding
- 6.2. Market Analysis, Insights and Forecast - by End User
- 6.2.1. Hospitals and Diagnostic Centers
- 6.2.2. Research Institutes
- 6.2.3. Other End Users
- 6.1. Market Analysis, Insights and Forecast - by Solution
- 7. Europe Radiation Shielding Industry Analysis, Insights and Forecast, 2019-2031
- 7.1. Market Analysis, Insights and Forecast - by Solution
- 7.1.1. Radiation Therapy Shielding
- 7.1.2. Diagnostic Shielding
- 7.2. Market Analysis, Insights and Forecast - by End User
- 7.2.1. Hospitals and Diagnostic Centers
- 7.2.2. Research Institutes
- 7.2.3. Other End Users
- 7.1. Market Analysis, Insights and Forecast - by Solution
- 8. Asia Pacific Radiation Shielding Industry Analysis, Insights and Forecast, 2019-2031
- 8.1. Market Analysis, Insights and Forecast - by Solution
- 8.1.1. Radiation Therapy Shielding
- 8.1.2. Diagnostic Shielding
- 8.2. Market Analysis, Insights and Forecast - by End User
- 8.2.1. Hospitals and Diagnostic Centers
- 8.2.2. Research Institutes
- 8.2.3. Other End Users
- 8.1. Market Analysis, Insights and Forecast - by Solution
- 9. Middle East and Africa Radiation Shielding Industry Analysis, Insights and Forecast, 2019-2031
- 9.1. Market Analysis, Insights and Forecast - by Solution
- 9.1.1. Radiation Therapy Shielding
- 9.1.2. Diagnostic Shielding
- 9.2. Market Analysis, Insights and Forecast - by End User
- 9.2.1. Hospitals and Diagnostic Centers
- 9.2.2. Research Institutes
- 9.2.3. Other End Users
- 9.1. Market Analysis, Insights and Forecast - by Solution
- 10. South America Radiation Shielding Industry Analysis, Insights and Forecast, 2019-2031
- 10.1. Market Analysis, Insights and Forecast - by Solution
- 10.1.1. Radiation Therapy Shielding
- 10.1.2. Diagnostic Shielding
- 10.2. Market Analysis, Insights and Forecast - by End User
- 10.2.1. Hospitals and Diagnostic Centers
- 10.2.2. Research Institutes
- 10.2.3. Other End Users
- 10.1. Market Analysis, Insights and Forecast - by Solution
- 11. North America Radiation Shielding Industry Analysis, Insights and Forecast, 2019-2031
- 11.1. Market Analysis, Insights and Forecast - By Country/Sub-region
- 11.1.1 United States
- 11.1.2 Canada
- 11.1.3 Mexico
- 12. South America Radiation Shielding Industry Analysis, Insights and Forecast, 2019-2031
- 12.1. Market Analysis, Insights and Forecast - By Country/Sub-region
- 12.1.1 Brazil
- 12.1.2 Mexico
- 12.1.3 Rest of South America
- 13. Europe Radiation Shielding Industry Analysis, Insights and Forecast, 2019-2031
- 13.1. Market Analysis, Insights and Forecast - By Country/Sub-region
- 13.1.1 United Kingdom
- 13.1.2 Germany
- 13.1.3 France
- 13.1.4 Italy
- 13.1.5 Spain
- 13.1.6 Russia
- 13.1.7 Rest of Europe
- 14. Asia Pacific Radiation Shielding Industry Analysis, Insights and Forecast, 2019-2031
- 14.1. Market Analysis, Insights and Forecast - By Country/Sub-region
- 14.1.1 China
- 14.1.2 Japan
- 14.1.3 India
- 14.1.4 South Korea
- 14.1.5 Taiwan
- 14.1.6 Australia
- 14.1.7 Rest of Asia-Pacific
- 15. MEA Radiation Shielding Industry Analysis, Insights and Forecast, 2019-2031
- 15.1. Market Analysis, Insights and Forecast - By Country/Sub-region
- 15.1.1 Middle East
- 15.1.2 Africa
- 16. Competitive Analysis
- 16.1. Global Market Share Analysis 2024
- 16.2. Company Profiles
- 16.2.1 Gaven Industries Inc
- 16.2.1.1. Overview
- 16.2.1.2. Products
- 16.2.1.3. SWOT Analysis
- 16.2.1.4. Recent Developments
- 16.2.1.5. Financials (Based on Availability)
- 16.2.2 Marshield
- 16.2.2.1. Overview
- 16.2.2.2. Products
- 16.2.2.3. SWOT Analysis
- 16.2.2.4. Recent Developments
- 16.2.2.5. Financials (Based on Availability)
- 16.2.3 Amray Medical
- 16.2.3.1. Overview
- 16.2.3.2. Products
- 16.2.3.3. SWOT Analysis
- 16.2.3.4. Recent Developments
- 16.2.3.5. Financials (Based on Availability)
- 16.2.4 Radiation Protection Products Inc
- 16.2.4.1. Overview
- 16.2.4.2. Products
- 16.2.4.3. SWOT Analysis
- 16.2.4.4. Recent Developments
- 16.2.4.5. Financials (Based on Availability)
- 16.2.5 ESCO Technologies Inc
- 16.2.5.1. Overview
- 16.2.5.2. Products
- 16.2.5.3. SWOT Analysis
- 16.2.5.4. Recent Developments
- 16.2.5.5. Financials (Based on Availability)
- 16.2.6 Nelco Inc
- 16.2.6.1. Overview
- 16.2.6.2. Products
- 16.2.6.3. SWOT Analysis
- 16.2.6.4. Recent Developments
- 16.2.6.5. Financials (Based on Availability)
- 16.2.7 Global Partners in Shielding Inc
- 16.2.7.1. Overview
- 16.2.7.2. Products
- 16.2.7.3. SWOT Analysis
- 16.2.7.4. Recent Developments
- 16.2.7.5. Financials (Based on Availability)
- 16.2.8 Veritas Medical Solutions LLC*List Not Exhaustive
- 16.2.8.1. Overview
- 16.2.8.2. Products
- 16.2.8.3. SWOT Analysis
- 16.2.8.4. Recent Developments
- 16.2.8.5. Financials (Based on Availability)
- 16.2.9 A&L Shielding
- 16.2.9.1. Overview
- 16.2.9.2. Products
- 16.2.9.3. SWOT Analysis
- 16.2.9.4. Recent Developments
- 16.2.9.5. Financials (Based on Availability)
- 16.2.10 Ray-Bar Engineering Corp
- 16.2.10.1. Overview
- 16.2.10.2. Products
- 16.2.10.3. SWOT Analysis
- 16.2.10.4. Recent Developments
- 16.2.10.5. Financials (Based on Availability)
- 16.2.1 Gaven Industries Inc
List of Figures
- Figure 1: Global Radiation Shielding Industry Revenue Breakdown (Billion, %) by Region 2024 & 2032
- Figure 2: North America Radiation Shielding Industry Revenue (Billion), by Country 2024 & 2032
- Figure 3: North America Radiation Shielding Industry Revenue Share (%), by Country 2024 & 2032
- Figure 4: South America Radiation Shielding Industry Revenue (Billion), by Country 2024 & 2032
- Figure 5: South America Radiation Shielding Industry Revenue Share (%), by Country 2024 & 2032
- Figure 6: Europe Radiation Shielding Industry Revenue (Billion), by Country 2024 & 2032
- Figure 7: Europe Radiation Shielding Industry Revenue Share (%), by Country 2024 & 2032
- Figure 8: Asia Pacific Radiation Shielding Industry Revenue (Billion), by Country 2024 & 2032
- Figure 9: Asia Pacific Radiation Shielding Industry Revenue Share (%), by Country 2024 & 2032
- Figure 10: MEA Radiation Shielding Industry Revenue (Billion), by Country 2024 & 2032
- Figure 11: MEA Radiation Shielding Industry Revenue Share (%), by Country 2024 & 2032
- Figure 12: North America Radiation Shielding Industry Revenue (Billion), by Solution 2024 & 2032
- Figure 13: North America Radiation Shielding Industry Revenue Share (%), by Solution 2024 & 2032
- Figure 14: North America Radiation Shielding Industry Revenue (Billion), by End User 2024 & 2032
- Figure 15: North America Radiation Shielding Industry Revenue Share (%), by End User 2024 & 2032
- Figure 16: North America Radiation Shielding Industry Revenue (Billion), by Country 2024 & 2032
- Figure 17: North America Radiation Shielding Industry Revenue Share (%), by Country 2024 & 2032
- Figure 18: Europe Radiation Shielding Industry Revenue (Billion), by Solution 2024 & 2032
- Figure 19: Europe Radiation Shielding Industry Revenue Share (%), by Solution 2024 & 2032
- Figure 20: Europe Radiation Shielding Industry Revenue (Billion), by End User 2024 & 2032
- Figure 21: Europe Radiation Shielding Industry Revenue Share (%), by End User 2024 & 2032
- Figure 22: Europe Radiation Shielding Industry Revenue (Billion), by Country 2024 & 2032
- Figure 23: Europe Radiation Shielding Industry Revenue Share (%), by Country 2024 & 2032
- Figure 24: Asia Pacific Radiation Shielding Industry Revenue (Billion), by Solution 2024 & 2032
- Figure 25: Asia Pacific Radiation Shielding Industry Revenue Share (%), by Solution 2024 & 2032
- Figure 26: Asia Pacific Radiation Shielding Industry Revenue (Billion), by End User 2024 & 2032
- Figure 27: Asia Pacific Radiation Shielding Industry Revenue Share (%), by End User 2024 & 2032
- Figure 28: Asia Pacific Radiation Shielding Industry Revenue (Billion), by Country 2024 & 2032
- Figure 29: Asia Pacific Radiation Shielding Industry Revenue Share (%), by Country 2024 & 2032
- Figure 30: Middle East and Africa Radiation Shielding Industry Revenue (Billion), by Solution 2024 & 2032
- Figure 31: Middle East and Africa Radiation Shielding Industry Revenue Share (%), by Solution 2024 & 2032
- Figure 32: Middle East and Africa Radiation Shielding Industry Revenue (Billion), by End User 2024 & 2032
- Figure 33: Middle East and Africa Radiation Shielding Industry Revenue Share (%), by End User 2024 & 2032
- Figure 34: Middle East and Africa Radiation Shielding Industry Revenue (Billion), by Country 2024 & 2032
- Figure 35: Middle East and Africa Radiation Shielding Industry Revenue Share (%), by Country 2024 & 2032
- Figure 36: South America Radiation Shielding Industry Revenue (Billion), by Solution 2024 & 2032
- Figure 37: South America Radiation Shielding Industry Revenue Share (%), by Solution 2024 & 2032
- Figure 38: South America Radiation Shielding Industry Revenue (Billion), by End User 2024 & 2032
- Figure 39: South America Radiation Shielding Industry Revenue Share (%), by End User 2024 & 2032
- Figure 40: South America Radiation Shielding Industry Revenue (Billion), by Country 2024 & 2032
- Figure 41: South America Radiation Shielding Industry Revenue Share (%), by Country 2024 & 2032
List of Tables
- Table 1: Global Radiation Shielding Industry Revenue Billion Forecast, by Region 2019 & 2032
- Table 2: Global Radiation Shielding Industry Revenue Billion Forecast, by Solution 2019 & 2032
- Table 3: Global Radiation Shielding Industry Revenue Billion Forecast, by End User 2019 & 2032
- Table 4: Global Radiation Shielding Industry Revenue Billion Forecast, by Region 2019 & 2032
- Table 5: Global Radiation Shielding Industry Revenue Billion Forecast, by Country 2019 & 2032
- Table 6: United States Radiation Shielding Industry Revenue (Billion) Forecast, by Application 2019 & 2032
- Table 7: Canada Radiation Shielding Industry Revenue (Billion) Forecast, by Application 2019 & 2032
- Table 8: Mexico Radiation Shielding Industry Revenue (Billion) Forecast, by Application 2019 & 2032
- Table 9: Global Radiation Shielding Industry Revenue Billion Forecast, by Country 2019 & 2032
- Table 10: Brazil Radiation Shielding Industry Revenue (Billion) Forecast, by Application 2019 & 2032
- Table 11: Mexico Radiation Shielding Industry Revenue (Billion) Forecast, by Application 2019 & 2032
- Table 12: Rest of South America Radiation Shielding Industry Revenue (Billion) Forecast, by Application 2019 & 2032
- Table 13: Global Radiation Shielding Industry Revenue Billion Forecast, by Country 2019 & 2032
- Table 14: United Kingdom Radiation Shielding Industry Revenue (Billion) Forecast, by Application 2019 & 2032
- Table 15: Germany Radiation Shielding Industry Revenue (Billion) Forecast, by Application 2019 & 2032
- Table 16: France Radiation Shielding Industry Revenue (Billion) Forecast, by Application 2019 & 2032
- Table 17: Italy Radiation Shielding Industry Revenue (Billion) Forecast, by Application 2019 & 2032
- Table 18: Spain Radiation Shielding Industry Revenue (Billion) Forecast, by Application 2019 & 2032
- Table 19: Russia Radiation Shielding Industry Revenue (Billion) Forecast, by Application 2019 & 2032
- Table 20: Rest of Europe Radiation Shielding Industry Revenue (Billion) Forecast, by Application 2019 & 2032
- Table 21: Global Radiation Shielding Industry Revenue Billion Forecast, by Country 2019 & 2032
- Table 22: China Radiation Shielding Industry Revenue (Billion) Forecast, by Application 2019 & 2032
- Table 23: Japan Radiation Shielding Industry Revenue (Billion) Forecast, by Application 2019 & 2032
- Table 24: India Radiation Shielding Industry Revenue (Billion) Forecast, by Application 2019 & 2032
- Table 25: South Korea Radiation Shielding Industry Revenue (Billion) Forecast, by Application 2019 & 2032
- Table 26: Taiwan Radiation Shielding Industry Revenue (Billion) Forecast, by Application 2019 & 2032
- Table 27: Australia Radiation Shielding Industry Revenue (Billion) Forecast, by Application 2019 & 2032
- Table 28: Rest of Asia-Pacific Radiation Shielding Industry Revenue (Billion) Forecast, by Application 2019 & 2032
- Table 29: Global Radiation Shielding Industry Revenue Billion Forecast, by Country 2019 & 2032
- Table 30: Middle East Radiation Shielding Industry Revenue (Billion) Forecast, by Application 2019 & 2032
- Table 31: Africa Radiation Shielding Industry Revenue (Billion) Forecast, by Application 2019 & 2032
- Table 32: Global Radiation Shielding Industry Revenue Billion Forecast, by Solution 2019 & 2032
- Table 33: Global Radiation Shielding Industry Revenue Billion Forecast, by End User 2019 & 2032
- Table 34: Global Radiation Shielding Industry Revenue Billion Forecast, by Country 2019 & 2032
- Table 35: United States Radiation Shielding Industry Revenue (Billion) Forecast, by Application 2019 & 2032
- Table 36: Canada Radiation Shielding Industry Revenue (Billion) Forecast, by Application 2019 & 2032
- Table 37: Mexico Radiation Shielding Industry Revenue (Billion) Forecast, by Application 2019 & 2032
- Table 38: Global Radiation Shielding Industry Revenue Billion Forecast, by Solution 2019 & 2032
- Table 39: Global Radiation Shielding Industry Revenue Billion Forecast, by End User 2019 & 2032
- Table 40: Global Radiation Shielding Industry Revenue Billion Forecast, by Country 2019 & 2032
- Table 41: Germany Radiation Shielding Industry Revenue (Billion) Forecast, by Application 2019 & 2032
- Table 42: United Kingdom Radiation Shielding Industry Revenue (Billion) Forecast, by Application 2019 & 2032
- Table 43: France Radiation Shielding Industry Revenue (Billion) Forecast, by Application 2019 & 2032
- Table 44: Italy Radiation Shielding Industry Revenue (Billion) Forecast, by Application 2019 & 2032
- Table 45: Spain Radiation Shielding Industry Revenue (Billion) Forecast, by Application 2019 & 2032
- Table 46: Rest of Europe Radiation Shielding Industry Revenue (Billion) Forecast, by Application 2019 & 2032
- Table 47: Global Radiation Shielding Industry Revenue Billion Forecast, by Solution 2019 & 2032
- Table 48: Global Radiation Shielding Industry Revenue Billion Forecast, by End User 2019 & 2032
- Table 49: Global Radiation Shielding Industry Revenue Billion Forecast, by Country 2019 & 2032
- Table 50: China Radiation Shielding Industry Revenue (Billion) Forecast, by Application 2019 & 2032
- Table 51: Japan Radiation Shielding Industry Revenue (Billion) Forecast, by Application 2019 & 2032
- Table 52: India Radiation Shielding Industry Revenue (Billion) Forecast, by Application 2019 & 2032
- Table 53: Australia Radiation Shielding Industry Revenue (Billion) Forecast, by Application 2019 & 2032
- Table 54: South Korea Radiation Shielding Industry Revenue (Billion) Forecast, by Application 2019 & 2032
- Table 55: Rest of Asia Pacific Radiation Shielding Industry Revenue (Billion) Forecast, by Application 2019 & 2032
- Table 56: Global Radiation Shielding Industry Revenue Billion Forecast, by Solution 2019 & 2032
- Table 57: Global Radiation Shielding Industry Revenue Billion Forecast, by End User 2019 & 2032
- Table 58: Global Radiation Shielding Industry Revenue Billion Forecast, by Country 2019 & 2032
- Table 59: GCC Radiation Shielding Industry Revenue (Billion) Forecast, by Application 2019 & 2032
- Table 60: South Africa Radiation Shielding Industry Revenue (Billion) Forecast, by Application 2019 & 2032
- Table 61: Rest of Middle East and Africa Radiation Shielding Industry Revenue (Billion) Forecast, by Application 2019 & 2032
- Table 62: Global Radiation Shielding Industry Revenue Billion Forecast, by Solution 2019 & 2032
- Table 63: Global Radiation Shielding Industry Revenue Billion Forecast, by End User 2019 & 2032
- Table 64: Global Radiation Shielding Industry Revenue Billion Forecast, by Country 2019 & 2032
- Table 65: Brazil Radiation Shielding Industry Revenue (Billion) Forecast, by Application 2019 & 2032
- Table 66: Argentina Radiation Shielding Industry Revenue (Billion) Forecast, by Application 2019 & 2032
- Table 67: Rest of South America Radiation Shielding Industry Revenue (Billion) Forecast, by Application 2019 & 2032
Frequently Asked Questions
1. What is the projected Compound Annual Growth Rate (CAGR) of the Radiation Shielding Industry?
The projected CAGR is approximately 4.60%.
2. Which companies are prominent players in the Radiation Shielding Industry?
Key companies in the market include Gaven Industries Inc, Marshield, Amray Medical, Radiation Protection Products Inc, ESCO Technologies Inc, Nelco Inc, Global Partners in Shielding Inc, Veritas Medical Solutions LLC*List Not Exhaustive, A&L Shielding, Ray-Bar Engineering Corp.
3. What are the main segments of the Radiation Shielding Industry?
The market segments include Solution, End User.
4. Can you provide details about the market size?
The market size is estimated to be USD 1.8 Billion as of 2022.
5. What are some drivers contributing to market growth?
Increasing Usage of Nuclear Medicine and Radiation Therapy for Diagnosis and Treatment; Rising Burden of Chronic Diseases; Growing Safety Awareness Among People Working in Radiation-prone Environments.
6. What are the notable trends driving market growth?
Diagnostic Shielding Holds Significant Share in the Global Medical Radiation Shielding Market.
7. Are there any restraints impacting market growth?
Lack of Awareness Among Healthcare Professionals; High Cost of Radiation Shielding.
8. Can you provide examples of recent developments in the market?
In April 2022, Radiaction Medical Ltd. received Food and Drug Administration 510(K) clearance to market its RadiationShield System in the United States.
9. What pricing options are available for accessing the report?
Pricing options include single-user, multi-user, and enterprise licenses priced at USD 4750, USD 5250, and USD 8750 respectively.
10. Is the market size provided in terms of value or volume?
The market size is provided in terms of value, measured in Billion.
11. Are there any specific market keywords associated with the report?
Yes, the market keyword associated with the report is "Radiation Shielding Industry," which aids in identifying and referencing the specific market segment covered.
12. How do I determine which pricing option suits my needs best?
The pricing options vary based on user requirements and access needs. Individual users may opt for single-user licenses, while businesses requiring broader access may choose multi-user or enterprise licenses for cost-effective access to the report.
13. Are there any additional resources or data provided in the Radiation Shielding Industry report?
While the report offers comprehensive insights, it's advisable to review the specific contents or supplementary materials provided to ascertain if additional resources or data are available.
14. How can I stay updated on further developments or reports in the Radiation Shielding Industry?
To stay informed about further developments, trends, and reports in the Radiation Shielding Industry, consider subscribing to industry newsletters, following relevant companies and organizations, or regularly checking reputable industry news sources and publications.
Methodology
Step 1 - Identification of Relevant Samples Size from Population Database


Step 2 - Approaches for Defining Global Market Size (Value, Volume* & Price*)

Note*: In applicable scenarios
Step 3 - Data Sources
Primary Research
- Web Analytics
- Survey Reports
- Research Institute
- Latest Research Reports
- Opinion Leaders
Secondary Research
- Annual Reports
- White Paper
- Latest Press Release
- Industry Association
- Paid Database
- Investor Presentations

Step 4 - Data Triangulation
Involves using different sources of information in order to increase the validity of a study
These sources are likely to be stakeholders in a program - participants, other researchers, program staff, other community members, and so on.
Then we put all data in single framework & apply various statistical tools to find out the dynamic on the market.
During the analysis stage, feedback from the stakeholder groups would be compared to determine areas of agreement as well as areas of divergence


