
Key Insights
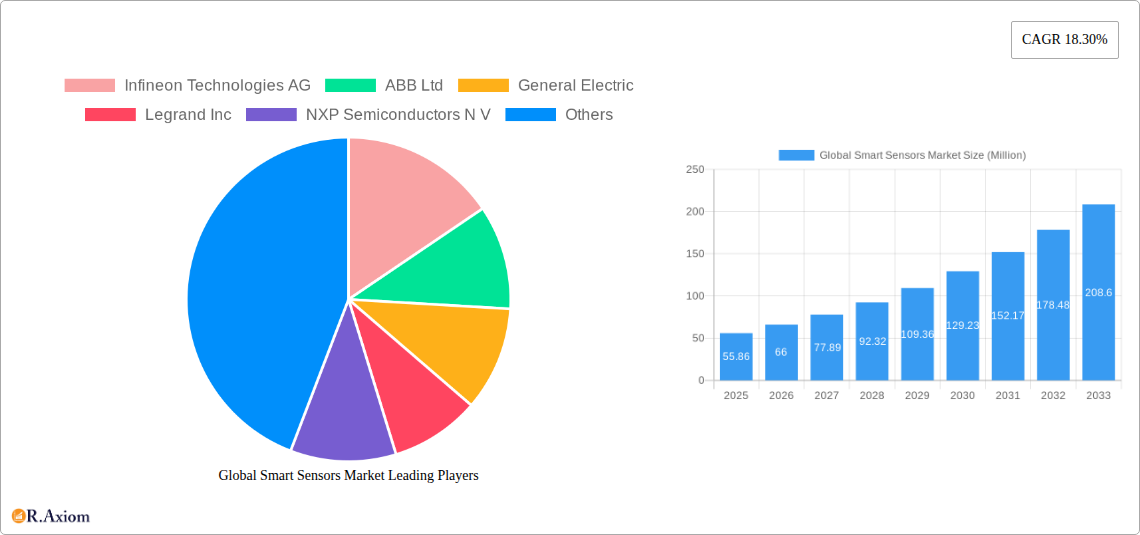
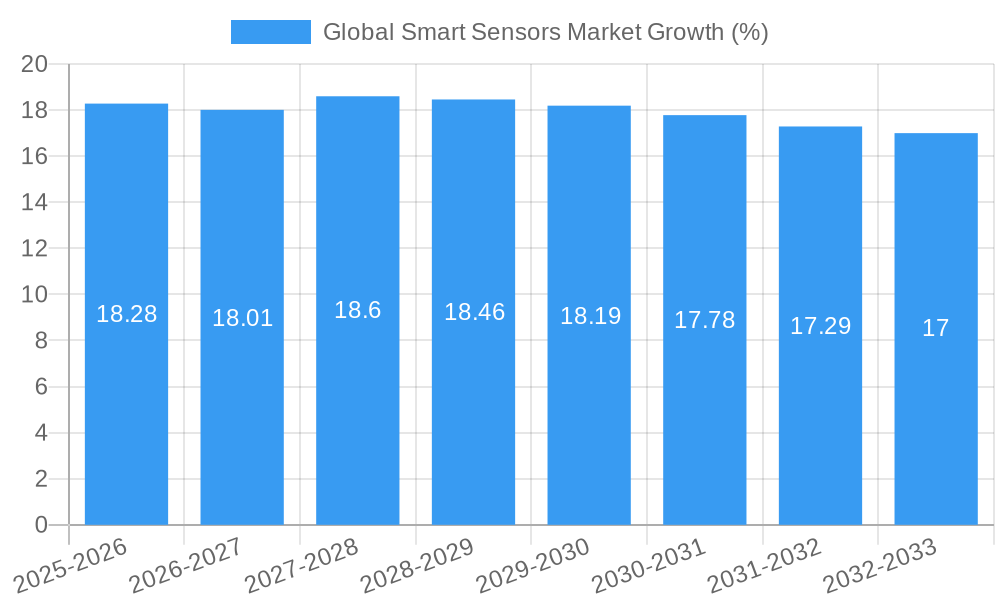
The global smart sensors market is experiencing robust growth, projected to reach \$55.86 million in 2025 and exhibiting a Compound Annual Growth Rate (CAGR) of 18.30% from 2025 to 2033. This expansion is driven by several key factors. The increasing adoption of automation across diverse sectors like automotive, healthcare, and industrial automation fuels demand for sophisticated sensing technologies. Miniaturization and advancements in MEMS (Microelectromechanical Systems) and CMOS (Complementary Metal-Oxide-Semiconductor) technologies are significantly lowering production costs and enabling the integration of smart sensors into smaller, more energy-efficient devices. Furthermore, the burgeoning Internet of Things (IoT) ecosystem is creating a massive need for real-time data acquisition and analysis, further propelling smart sensor market growth. The growing preference for advanced sensor types like flow, pressure, and temperature sensors across various applications is contributing to market segmentation and specialization, fostering innovation and competition.
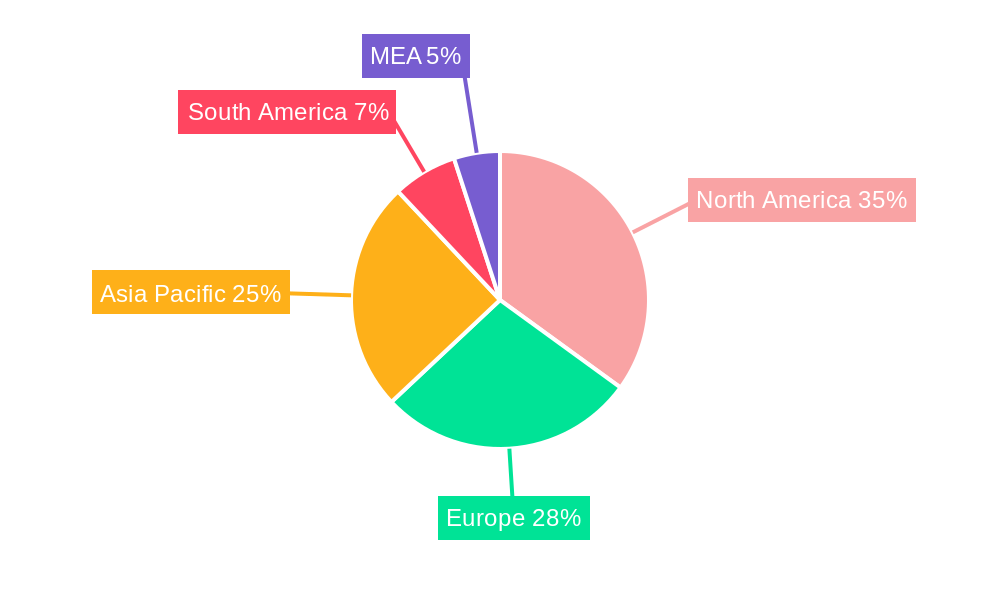
Market restraints include the high initial investment costs associated with implementing smart sensor technologies, especially in smaller enterprises. However, the long-term cost savings resulting from improved efficiency and predictive maintenance are offsetting this initial hurdle. The market is also witnessing a shift towards more sophisticated applications, leading to an increasing demand for higher-performance sensors with advanced functionalities. This necessitates continuous technological innovation and collaboration between sensor manufacturers and application developers. Regional variations exist, with North America and Europe currently holding significant market shares due to established industrial infrastructure and early adoption of smart technologies. However, the Asia-Pacific region is expected to witness rapid growth in the coming years, driven by increasing industrialization and expanding digital infrastructure. The competitive landscape is dynamic, with leading players like Infineon Technologies, ABB, and Honeywell continually investing in research and development to maintain their market positions and drive technological advancements.
Global Smart Sensors Market: A Comprehensive Analysis (2019-2033)
This in-depth report provides a comprehensive analysis of the global smart sensors market, offering valuable insights for industry stakeholders, investors, and researchers. Covering the period from 2019 to 2033, with a focus on 2025, this report meticulously examines market dynamics, segmentation, key players, and future growth potential. The report leverages extensive market research and data analysis to provide actionable intelligence for strategic decision-making.
Global Smart Sensors Market Market Concentration & Innovation
The global smart sensors market exhibits a moderately concentrated landscape, with several major players holding significant market share. Infineon Technologies AG, ABB Ltd, General Electric, and Siemens AG are among the leading companies, driving innovation and shaping market trends. Market concentration is influenced by factors such as technological advancements, economies of scale, and strategic mergers and acquisitions (M&A). M&A activity has been significant, with deal values exceeding xx Million in recent years, primarily driven by the need to expand product portfolios and access new technologies. The market is characterized by continuous innovation, with companies investing heavily in R&D to develop advanced sensor technologies, such as MEMS, CMOS, and optical spectroscopy. Stringent regulatory frameworks in various industries, particularly automotive and healthcare, influence product development and adoption. The market also faces competitive pressures from the emergence of substitute technologies and new entrants. End-user trends, particularly the growing adoption of smart devices and automation across various sectors, are key drivers of market growth.
- Market Share: Top 5 players hold approximately xx% of the market share (2025).
- M&A Activity: xx Million in deal values (2019-2024).
- Innovation Drivers: Miniaturization, improved accuracy, enhanced connectivity, and AI integration.
- Regulatory Frameworks: Compliance with safety and data privacy regulations.
Global Smart Sensors Market Industry Trends & Insights
The global smart sensors market is experiencing robust growth, driven by increasing demand across diverse sectors. The market is projected to achieve a CAGR of xx% during the forecast period (2025-2033). Key growth drivers include the rapid adoption of IoT (Internet of Things), the increasing need for automation in industrial processes, and the expanding application of smart sensors in consumer electronics. Technological advancements, such as the development of more accurate, energy-efficient, and cost-effective sensors, are fueling market expansion. Consumer preferences are shifting towards smart, connected devices, further driving demand for smart sensors. Competitive dynamics are intense, with established players and emerging companies vying for market share through product innovation, strategic partnerships, and aggressive marketing strategies. Market penetration is highest in developed regions, but significant growth opportunities exist in emerging economies. Disruptive technologies like AI and machine learning are enhancing sensor capabilities and creating new applications.
Dominant Markets & Segments in Global Smart Sensors Market
The automotive and transportation segment currently dominates the global smart sensors market, driven by stringent safety regulations and the increasing demand for advanced driver-assistance systems (ADAS). North America and Europe are the leading regions, benefiting from technological advancements and strong adoption rates. Among sensor types, pressure sensors hold the largest market share, followed closely by temperature and position sensors. MEMS technology remains dominant, due to its cost-effectiveness and scalability. Within components, analog-to-digital converters (ADCs) are widely used.
- Key Drivers for Automotive & Transportation: ADAS, autonomous driving, vehicle safety systems.
- Key Drivers for North America: Strong technological infrastructure, high consumer spending, early adoption of new technologies.
- Key Drivers for Europe: Similar to North America, with a focus on stricter environmental regulations.
- Dominant Sensor Type: Pressure Sensor (xx Million in 2025).
- Dominant Technology: MEMS (xx% market share in 2025).
- Dominant Component: Analog-to-Digital Converter (ADC)
Global Smart Sensors Market Product Developments
Recent product innovations focus on enhancing sensor accuracy, miniaturization, and power efficiency. New applications are emerging in areas such as environmental monitoring, smart agriculture, and healthcare diagnostics. Companies are leveraging advanced technologies like AI and machine learning to improve sensor data processing and analysis. The market is witnessing a trend toward the integration of smart sensors into existing systems, creating more comprehensive and intelligent solutions. These advancements offer significant competitive advantages by providing enhanced performance, reduced costs, and improved user experiences.
Report Scope & Segmentation Analysis
This report segments the global smart sensor market based on type (Flow Sensor, Humidity Sensor, Position Sensor, Pressure Sensor, Temperature Sensor, Other Types), technology (MEMS, CMOS, Optical Spectroscopy, Other Technologies), component (Analog-to-Digital Converter, Digital-to-Analog Converter, Amplifier, Other Components), and application (Aerospace and Defense, Automotive and Transportation, Healthcare, Industrial Automation, Building Automation, Consumer Electronics, Other Applications). Each segment's market size, growth projections, and competitive landscape are comprehensively analyzed. For example, the automotive segment is expected to grow at a CAGR of xx%, while the healthcare segment is projected to reach xx Million by 2033. Competitive dynamics within each segment vary significantly, with some segments exhibiting high fragmentation and others dominated by a few key players.
Key Drivers of Global Smart Sensors Market Growth
The growth of the smart sensors market is fueled by several factors. Technological advancements, such as the miniaturization of sensors and the development of new sensor technologies, are crucial. The increasing adoption of IoT across various sectors, coupled with favorable government regulations and economic policies promoting automation, is also a significant driver. The growing demand for enhanced safety and efficiency in industries such as automotive, healthcare, and industrial automation is also contributing to market expansion. The integration of artificial intelligence (AI) and machine learning (ML) is further enhancing sensor capabilities, opening new avenues of application and leading to a substantial surge in demand.
Challenges in the Global Smart Sensors Market Sector
The global smart sensors market faces several challenges. High initial investment costs and complex integration processes can hinder adoption. Supply chain disruptions and fluctuations in raw material prices pose significant threats to manufacturing and profitability. Stringent regulatory compliance requirements in certain sectors (e.g., medical devices, automotive safety) increase development and production costs. Intense competition among established players and new entrants creates pressure on pricing and margins. Concerns about data security and privacy are also emerging, particularly in applications involving personal data collection. These factors can collectively restrain market growth.
Emerging Opportunities in Global Smart Sensors Market
The smart sensors market presents various emerging opportunities. The growth of 5G networks, offering enhanced connectivity and data transfer rates, unlocks possibilities for new applications. The increasing demand for advanced sensor technologies in emerging sectors like smart agriculture and environmental monitoring provides substantial growth potential. The development of new sensor materials with improved performance characteristics, along with innovations in sensor packaging, present opportunities for market expansion. The integration of smart sensors into wearable technology and the growing focus on preventative healthcare applications further contribute to the emergence of new opportunities.
Leading Players in the Global Smart Sensors Market Market
- Infineon Technologies AG
- ABB Ltd
- General Electric
- Legrand Inc
- NXP Semiconductors N.V.
- Siemens AG
- Honeywell International
- TE Connectivity Ltd
- STMicroelectronics
- Analog Devices Inc
- Vishay Technology Inc
- Eaton Corporation
Key Developments in Global Smart Sensors Market Industry
- October 2022: Optomotive launched two new lines of 3D high-speed smart sensors, showcasing advancements in laser triangulation technology and customization capabilities. This development enhances sensor performance and caters to high-demand applications.
- November 2022: Quanergy Systems, Inc. announced enhancements to its QORTEX DTC and Q-View software solutions, improving the performance and functionality of its MQ-8 family of LiDAR sensors. This strengthens its position in the LiDAR market.
Strategic Outlook for Global Smart Sensors Market Market
The future of the smart sensors market appears exceptionally promising. Continuous technological advancements, expanding applications across various sectors, and rising demand for automation and data-driven decision-making will propel market growth. The integration of AI and ML, coupled with the proliferation of IoT devices, will further enhance sensor capabilities and generate new applications. Strategic partnerships and collaborations among technology providers, manufacturers, and end-users will play a vital role in shaping market dynamics. Focusing on innovation, cost optimization, and enhanced data security will be critical for companies to maintain competitiveness in this dynamic market.
Global Smart Sensors Market Segmentation
-
1. Type
- 1.1. Flow Sensor
- 1.2. Humidity Sensor
- 1.3. Position Sensor
- 1.4. Pressure Sensor
- 1.5. Temperature Sensor
- 1.6. Other Types
-
2. Technology
- 2.1. MEMS
- 2.2. CMOS
- 2.3. Optical Spectroscopy
- 2.4. Other Technologies
-
3. Component
- 3.1. Analog-to-Digital Converter
- 3.2. Digital-to-Analog Converter
- 3.3. Amplifier
- 3.4. Other components
-
4. Application
- 4.1. Aerospace and Defense
- 4.2. Automotive and Transportation
- 4.3. Healthcare
- 4.4. Industrial Automation
- 4.5. Building Automation
- 4.6. Consumer Electronics
- 4.7. Other Applications
Global Smart Sensors Market Segmentation By Geography
-
1. North America
- 1.1. United States
- 1.2. Canada
-
2. Europe
- 2.1. United Kingdom
- 2.2. Germany
- 2.3. France
- 2.4. Rest of Europe
-
3. Asia Pacific
- 3.1. China
- 3.2. India
- 3.3. Japan
- 3.4. Rest Asia Pacific
- 4. Latin America
- 5. Middle East and Africa
Global Smart Sensors Market REPORT HIGHLIGHTS
| Aspects | Details |
|---|---|
| Study Period | 2019-2033 |
| Base Year | 2024 |
| Estimated Year | 2025 |
| Forecast Period | 2025-2033 |
| Historical Period | 2019-2024 |
| Growth Rate | CAGR of 18.30% from 2019-2033 |
| Segmentation |
|
Table of Contents
- 1. Introduction
- 1.1. Research Scope
- 1.2. Market Segmentation
- 1.3. Research Methodology
- 1.4. Definitions and Assumptions
- 2. Executive Summary
- 2.1. Introduction
- 3. Market Dynamics
- 3.1. Introduction
- 3.2. Market Drivers
- 3.2.1. Growing Demand for Energy Efficiency and Saving; Increasing Demand for Consumer Electronics Products; Higher Demand for Smart Sensors in the Healthcare and Automotive Industries; Technology Advancements in Miniaturization and Wireless Capabilities
- 3.3. Market Restrains
- 3.3.1. Relatively High Deployment Costs; Complex Design compared to Traditional Sensors
- 3.4. Market Trends
- 3.4.1. Temperature Sensors to Witness High Growth
- 4. Market Factor Analysis
- 4.1. Porters Five Forces
- 4.2. Supply/Value Chain
- 4.3. PESTEL analysis
- 4.4. Market Entropy
- 4.5. Patent/Trademark Analysis
- 5. Global Smart Sensors Market Analysis, Insights and Forecast, 2019-2031
- 5.1. Market Analysis, Insights and Forecast - by Type
- 5.1.1. Flow Sensor
- 5.1.2. Humidity Sensor
- 5.1.3. Position Sensor
- 5.1.4. Pressure Sensor
- 5.1.5. Temperature Sensor
- 5.1.6. Other Types
- 5.2. Market Analysis, Insights and Forecast - by Technology
- 5.2.1. MEMS
- 5.2.2. CMOS
- 5.2.3. Optical Spectroscopy
- 5.2.4. Other Technologies
- 5.3. Market Analysis, Insights and Forecast - by Component
- 5.3.1. Analog-to-Digital Converter
- 5.3.2. Digital-to-Analog Converter
- 5.3.3. Amplifier
- 5.3.4. Other components
- 5.4. Market Analysis, Insights and Forecast - by Application
- 5.4.1. Aerospace and Defense
- 5.4.2. Automotive and Transportation
- 5.4.3. Healthcare
- 5.4.4. Industrial Automation
- 5.4.5. Building Automation
- 5.4.6. Consumer Electronics
- 5.4.7. Other Applications
- 5.5. Market Analysis, Insights and Forecast - by Region
- 5.5.1. North America
- 5.5.2. Europe
- 5.5.3. Asia Pacific
- 5.5.4. Latin America
- 5.5.5. Middle East and Africa
- 5.1. Market Analysis, Insights and Forecast - by Type
- 6. North America Global Smart Sensors Market Analysis, Insights and Forecast, 2019-2031
- 6.1. Market Analysis, Insights and Forecast - by Type
- 6.1.1. Flow Sensor
- 6.1.2. Humidity Sensor
- 6.1.3. Position Sensor
- 6.1.4. Pressure Sensor
- 6.1.5. Temperature Sensor
- 6.1.6. Other Types
- 6.2. Market Analysis, Insights and Forecast - by Technology
- 6.2.1. MEMS
- 6.2.2. CMOS
- 6.2.3. Optical Spectroscopy
- 6.2.4. Other Technologies
- 6.3. Market Analysis, Insights and Forecast - by Component
- 6.3.1. Analog-to-Digital Converter
- 6.3.2. Digital-to-Analog Converter
- 6.3.3. Amplifier
- 6.3.4. Other components
- 6.4. Market Analysis, Insights and Forecast - by Application
- 6.4.1. Aerospace and Defense
- 6.4.2. Automotive and Transportation
- 6.4.3. Healthcare
- 6.4.4. Industrial Automation
- 6.4.5. Building Automation
- 6.4.6. Consumer Electronics
- 6.4.7. Other Applications
- 6.1. Market Analysis, Insights and Forecast - by Type
- 7. Europe Global Smart Sensors Market Analysis, Insights and Forecast, 2019-2031
- 7.1. Market Analysis, Insights and Forecast - by Type
- 7.1.1. Flow Sensor
- 7.1.2. Humidity Sensor
- 7.1.3. Position Sensor
- 7.1.4. Pressure Sensor
- 7.1.5. Temperature Sensor
- 7.1.6. Other Types
- 7.2. Market Analysis, Insights and Forecast - by Technology
- 7.2.1. MEMS
- 7.2.2. CMOS
- 7.2.3. Optical Spectroscopy
- 7.2.4. Other Technologies
- 7.3. Market Analysis, Insights and Forecast - by Component
- 7.3.1. Analog-to-Digital Converter
- 7.3.2. Digital-to-Analog Converter
- 7.3.3. Amplifier
- 7.3.4. Other components
- 7.4. Market Analysis, Insights and Forecast - by Application
- 7.4.1. Aerospace and Defense
- 7.4.2. Automotive and Transportation
- 7.4.3. Healthcare
- 7.4.4. Industrial Automation
- 7.4.5. Building Automation
- 7.4.6. Consumer Electronics
- 7.4.7. Other Applications
- 7.1. Market Analysis, Insights and Forecast - by Type
- 8. Asia Pacific Global Smart Sensors Market Analysis, Insights and Forecast, 2019-2031
- 8.1. Market Analysis, Insights and Forecast - by Type
- 8.1.1. Flow Sensor
- 8.1.2. Humidity Sensor
- 8.1.3. Position Sensor
- 8.1.4. Pressure Sensor
- 8.1.5. Temperature Sensor
- 8.1.6. Other Types
- 8.2. Market Analysis, Insights and Forecast - by Technology
- 8.2.1. MEMS
- 8.2.2. CMOS
- 8.2.3. Optical Spectroscopy
- 8.2.4. Other Technologies
- 8.3. Market Analysis, Insights and Forecast - by Component
- 8.3.1. Analog-to-Digital Converter
- 8.3.2. Digital-to-Analog Converter
- 8.3.3. Amplifier
- 8.3.4. Other components
- 8.4. Market Analysis, Insights and Forecast - by Application
- 8.4.1. Aerospace and Defense
- 8.4.2. Automotive and Transportation
- 8.4.3. Healthcare
- 8.4.4. Industrial Automation
- 8.4.5. Building Automation
- 8.4.6. Consumer Electronics
- 8.4.7. Other Applications
- 8.1. Market Analysis, Insights and Forecast - by Type
- 9. Latin America Global Smart Sensors Market Analysis, Insights and Forecast, 2019-2031
- 9.1. Market Analysis, Insights and Forecast - by Type
- 9.1.1. Flow Sensor
- 9.1.2. Humidity Sensor
- 9.1.3. Position Sensor
- 9.1.4. Pressure Sensor
- 9.1.5. Temperature Sensor
- 9.1.6. Other Types
- 9.2. Market Analysis, Insights and Forecast - by Technology
- 9.2.1. MEMS
- 9.2.2. CMOS
- 9.2.3. Optical Spectroscopy
- 9.2.4. Other Technologies
- 9.3. Market Analysis, Insights and Forecast - by Component
- 9.3.1. Analog-to-Digital Converter
- 9.3.2. Digital-to-Analog Converter
- 9.3.3. Amplifier
- 9.3.4. Other components
- 9.4. Market Analysis, Insights and Forecast - by Application
- 9.4.1. Aerospace and Defense
- 9.4.2. Automotive and Transportation
- 9.4.3. Healthcare
- 9.4.4. Industrial Automation
- 9.4.5. Building Automation
- 9.4.6. Consumer Electronics
- 9.4.7. Other Applications
- 9.1. Market Analysis, Insights and Forecast - by Type
- 10. Middle East and Africa Global Smart Sensors Market Analysis, Insights and Forecast, 2019-2031
- 10.1. Market Analysis, Insights and Forecast - by Type
- 10.1.1. Flow Sensor
- 10.1.2. Humidity Sensor
- 10.1.3. Position Sensor
- 10.1.4. Pressure Sensor
- 10.1.5. Temperature Sensor
- 10.1.6. Other Types
- 10.2. Market Analysis, Insights and Forecast - by Technology
- 10.2.1. MEMS
- 10.2.2. CMOS
- 10.2.3. Optical Spectroscopy
- 10.2.4. Other Technologies
- 10.3. Market Analysis, Insights and Forecast - by Component
- 10.3.1. Analog-to-Digital Converter
- 10.3.2. Digital-to-Analog Converter
- 10.3.3. Amplifier
- 10.3.4. Other components
- 10.4. Market Analysis, Insights and Forecast - by Application
- 10.4.1. Aerospace and Defense
- 10.4.2. Automotive and Transportation
- 10.4.3. Healthcare
- 10.4.4. Industrial Automation
- 10.4.5. Building Automation
- 10.4.6. Consumer Electronics
- 10.4.7. Other Applications
- 10.1. Market Analysis, Insights and Forecast - by Type
- 11. North America Global Smart Sensors Market Analysis, Insights and Forecast, 2019-2031
- 11.1. Market Analysis, Insights and Forecast - By Country/Sub-region
- 11.1.1 United States
- 11.1.2 Canada
- 11.1.3 Mexico
- 12. Europe Global Smart Sensors Market Analysis, Insights and Forecast, 2019-2031
- 12.1. Market Analysis, Insights and Forecast - By Country/Sub-region
- 12.1.1 Germany
- 12.1.2 United Kingdom
- 12.1.3 France
- 12.1.4 Spain
- 12.1.5 Italy
- 12.1.6 Spain
- 12.1.7 Belgium
- 12.1.8 Netherland
- 12.1.9 Nordics
- 12.1.10 Rest of Europe
- 13. Asia Pacific Global Smart Sensors Market Analysis, Insights and Forecast, 2019-2031
- 13.1. Market Analysis, Insights and Forecast - By Country/Sub-region
- 13.1.1 China
- 13.1.2 Japan
- 13.1.3 India
- 13.1.4 South Korea
- 13.1.5 Southeast Asia
- 13.1.6 Australia
- 13.1.7 Indonesia
- 13.1.8 Phillipes
- 13.1.9 Singapore
- 13.1.10 Thailandc
- 13.1.11 Rest of Asia Pacific
- 14. South America Global Smart Sensors Market Analysis, Insights and Forecast, 2019-2031
- 14.1. Market Analysis, Insights and Forecast - By Country/Sub-region
- 14.1.1 Brazil
- 14.1.2 Argentina
- 14.1.3 Peru
- 14.1.4 Chile
- 14.1.5 Colombia
- 14.1.6 Ecuador
- 14.1.7 Venezuela
- 14.1.8 Rest of South America
- 15. MEA Global Smart Sensors Market Analysis, Insights and Forecast, 2019-2031
- 15.1. Market Analysis, Insights and Forecast - By Country/Sub-region
- 15.1.1 United Arab Emirates
- 15.1.2 Saudi Arabia
- 15.1.3 South Africa
- 15.1.4 Rest of Middle East and Africa
- 16. Competitive Analysis
- 16.1. Market Share Analysis 2024
- 16.2. Company Profiles
- 16.2.1 Infineon Technologies AG
- 16.2.1.1. Overview
- 16.2.1.2. Products
- 16.2.1.3. SWOT Analysis
- 16.2.1.4. Recent Developments
- 16.2.1.5. Financials (Based on Availability)
- 16.2.2 ABB Ltd
- 16.2.2.1. Overview
- 16.2.2.2. Products
- 16.2.2.3. SWOT Analysis
- 16.2.2.4. Recent Developments
- 16.2.2.5. Financials (Based on Availability)
- 16.2.3 General Electric
- 16.2.3.1. Overview
- 16.2.3.2. Products
- 16.2.3.3. SWOT Analysis
- 16.2.3.4. Recent Developments
- 16.2.3.5. Financials (Based on Availability)
- 16.2.4 Legrand Inc
- 16.2.4.1. Overview
- 16.2.4.2. Products
- 16.2.4.3. SWOT Analysis
- 16.2.4.4. Recent Developments
- 16.2.4.5. Financials (Based on Availability)
- 16.2.5 NXP Semiconductors N V
- 16.2.5.1. Overview
- 16.2.5.2. Products
- 16.2.5.3. SWOT Analysis
- 16.2.5.4. Recent Developments
- 16.2.5.5. Financials (Based on Availability)
- 16.2.6 Siemens AG
- 16.2.6.1. Overview
- 16.2.6.2. Products
- 16.2.6.3. SWOT Analysis
- 16.2.6.4. Recent Developments
- 16.2.6.5. Financials (Based on Availability)
- 16.2.7 Honeywell International
- 16.2.7.1. Overview
- 16.2.7.2. Products
- 16.2.7.3. SWOT Analysis
- 16.2.7.4. Recent Developments
- 16.2.7.5. Financials (Based on Availability)
- 16.2.8 TE Connectivity Ltd
- 16.2.8.1. Overview
- 16.2.8.2. Products
- 16.2.8.3. SWOT Analysis
- 16.2.8.4. Recent Developments
- 16.2.8.5. Financials (Based on Availability)
- 16.2.9 ST Microelectronics
- 16.2.9.1. Overview
- 16.2.9.2. Products
- 16.2.9.3. SWOT Analysis
- 16.2.9.4. Recent Developments
- 16.2.9.5. Financials (Based on Availability)
- 16.2.10 Analog Devices Inc
- 16.2.10.1. Overview
- 16.2.10.2. Products
- 16.2.10.3. SWOT Analysis
- 16.2.10.4. Recent Developments
- 16.2.10.5. Financials (Based on Availability)
- 16.2.11 Vishay Technology Inc
- 16.2.11.1. Overview
- 16.2.11.2. Products
- 16.2.11.3. SWOT Analysis
- 16.2.11.4. Recent Developments
- 16.2.11.5. Financials (Based on Availability)
- 16.2.12 Eaton Corporation
- 16.2.12.1. Overview
- 16.2.12.2. Products
- 16.2.12.3. SWOT Analysis
- 16.2.12.4. Recent Developments
- 16.2.12.5. Financials (Based on Availability)
- 16.2.1 Infineon Technologies AG
List of Figures
- Figure 1: Global Global Smart Sensors Market Revenue Breakdown (Million, %) by Region 2024 & 2032
- Figure 2: North America Global Smart Sensors Market Revenue (Million), by Country 2024 & 2032
- Figure 3: North America Global Smart Sensors Market Revenue Share (%), by Country 2024 & 2032
- Figure 4: Europe Global Smart Sensors Market Revenue (Million), by Country 2024 & 2032
- Figure 5: Europe Global Smart Sensors Market Revenue Share (%), by Country 2024 & 2032
- Figure 6: Asia Pacific Global Smart Sensors Market Revenue (Million), by Country 2024 & 2032
- Figure 7: Asia Pacific Global Smart Sensors Market Revenue Share (%), by Country 2024 & 2032
- Figure 8: South America Global Smart Sensors Market Revenue (Million), by Country 2024 & 2032
- Figure 9: South America Global Smart Sensors Market Revenue Share (%), by Country 2024 & 2032
- Figure 10: MEA Global Smart Sensors Market Revenue (Million), by Country 2024 & 2032
- Figure 11: MEA Global Smart Sensors Market Revenue Share (%), by Country 2024 & 2032
- Figure 12: North America Global Smart Sensors Market Revenue (Million), by Type 2024 & 2032
- Figure 13: North America Global Smart Sensors Market Revenue Share (%), by Type 2024 & 2032
- Figure 14: North America Global Smart Sensors Market Revenue (Million), by Technology 2024 & 2032
- Figure 15: North America Global Smart Sensors Market Revenue Share (%), by Technology 2024 & 2032
- Figure 16: North America Global Smart Sensors Market Revenue (Million), by Component 2024 & 2032
- Figure 17: North America Global Smart Sensors Market Revenue Share (%), by Component 2024 & 2032
- Figure 18: North America Global Smart Sensors Market Revenue (Million), by Application 2024 & 2032
- Figure 19: North America Global Smart Sensors Market Revenue Share (%), by Application 2024 & 2032
- Figure 20: North America Global Smart Sensors Market Revenue (Million), by Country 2024 & 2032
- Figure 21: North America Global Smart Sensors Market Revenue Share (%), by Country 2024 & 2032
- Figure 22: Europe Global Smart Sensors Market Revenue (Million), by Type 2024 & 2032
- Figure 23: Europe Global Smart Sensors Market Revenue Share (%), by Type 2024 & 2032
- Figure 24: Europe Global Smart Sensors Market Revenue (Million), by Technology 2024 & 2032
- Figure 25: Europe Global Smart Sensors Market Revenue Share (%), by Technology 2024 & 2032
- Figure 26: Europe Global Smart Sensors Market Revenue (Million), by Component 2024 & 2032
- Figure 27: Europe Global Smart Sensors Market Revenue Share (%), by Component 2024 & 2032
- Figure 28: Europe Global Smart Sensors Market Revenue (Million), by Application 2024 & 2032
- Figure 29: Europe Global Smart Sensors Market Revenue Share (%), by Application 2024 & 2032
- Figure 30: Europe Global Smart Sensors Market Revenue (Million), by Country 2024 & 2032
- Figure 31: Europe Global Smart Sensors Market Revenue Share (%), by Country 2024 & 2032
- Figure 32: Asia Pacific Global Smart Sensors Market Revenue (Million), by Type 2024 & 2032
- Figure 33: Asia Pacific Global Smart Sensors Market Revenue Share (%), by Type 2024 & 2032
- Figure 34: Asia Pacific Global Smart Sensors Market Revenue (Million), by Technology 2024 & 2032
- Figure 35: Asia Pacific Global Smart Sensors Market Revenue Share (%), by Technology 2024 & 2032
- Figure 36: Asia Pacific Global Smart Sensors Market Revenue (Million), by Component 2024 & 2032
- Figure 37: Asia Pacific Global Smart Sensors Market Revenue Share (%), by Component 2024 & 2032
- Figure 38: Asia Pacific Global Smart Sensors Market Revenue (Million), by Application 2024 & 2032
- Figure 39: Asia Pacific Global Smart Sensors Market Revenue Share (%), by Application 2024 & 2032
- Figure 40: Asia Pacific Global Smart Sensors Market Revenue (Million), by Country 2024 & 2032
- Figure 41: Asia Pacific Global Smart Sensors Market Revenue Share (%), by Country 2024 & 2032
- Figure 42: Latin America Global Smart Sensors Market Revenue (Million), by Type 2024 & 2032
- Figure 43: Latin America Global Smart Sensors Market Revenue Share (%), by Type 2024 & 2032
- Figure 44: Latin America Global Smart Sensors Market Revenue (Million), by Technology 2024 & 2032
- Figure 45: Latin America Global Smart Sensors Market Revenue Share (%), by Technology 2024 & 2032
- Figure 46: Latin America Global Smart Sensors Market Revenue (Million), by Component 2024 & 2032
- Figure 47: Latin America Global Smart Sensors Market Revenue Share (%), by Component 2024 & 2032
- Figure 48: Latin America Global Smart Sensors Market Revenue (Million), by Application 2024 & 2032
- Figure 49: Latin America Global Smart Sensors Market Revenue Share (%), by Application 2024 & 2032
- Figure 50: Latin America Global Smart Sensors Market Revenue (Million), by Country 2024 & 2032
- Figure 51: Latin America Global Smart Sensors Market Revenue Share (%), by Country 2024 & 2032
- Figure 52: Middle East and Africa Global Smart Sensors Market Revenue (Million), by Type 2024 & 2032
- Figure 53: Middle East and Africa Global Smart Sensors Market Revenue Share (%), by Type 2024 & 2032
- Figure 54: Middle East and Africa Global Smart Sensors Market Revenue (Million), by Technology 2024 & 2032
- Figure 55: Middle East and Africa Global Smart Sensors Market Revenue Share (%), by Technology 2024 & 2032
- Figure 56: Middle East and Africa Global Smart Sensors Market Revenue (Million), by Component 2024 & 2032
- Figure 57: Middle East and Africa Global Smart Sensors Market Revenue Share (%), by Component 2024 & 2032
- Figure 58: Middle East and Africa Global Smart Sensors Market Revenue (Million), by Application 2024 & 2032
- Figure 59: Middle East and Africa Global Smart Sensors Market Revenue Share (%), by Application 2024 & 2032
- Figure 60: Middle East and Africa Global Smart Sensors Market Revenue (Million), by Country 2024 & 2032
- Figure 61: Middle East and Africa Global Smart Sensors Market Revenue Share (%), by Country 2024 & 2032
List of Tables
- Table 1: Global Smart Sensors Market Revenue Million Forecast, by Region 2019 & 2032
- Table 2: Global Smart Sensors Market Revenue Million Forecast, by Type 2019 & 2032
- Table 3: Global Smart Sensors Market Revenue Million Forecast, by Technology 2019 & 2032
- Table 4: Global Smart Sensors Market Revenue Million Forecast, by Component 2019 & 2032
- Table 5: Global Smart Sensors Market Revenue Million Forecast, by Application 2019 & 2032
- Table 6: Global Smart Sensors Market Revenue Million Forecast, by Region 2019 & 2032
- Table 7: Global Smart Sensors Market Revenue Million Forecast, by Country 2019 & 2032
- Table 8: United States Global Smart Sensors Market Revenue (Million) Forecast, by Application 2019 & 2032
- Table 9: Canada Global Smart Sensors Market Revenue (Million) Forecast, by Application 2019 & 2032
- Table 10: Mexico Global Smart Sensors Market Revenue (Million) Forecast, by Application 2019 & 2032
- Table 11: Global Smart Sensors Market Revenue Million Forecast, by Country 2019 & 2032
- Table 12: Germany Global Smart Sensors Market Revenue (Million) Forecast, by Application 2019 & 2032
- Table 13: United Kingdom Global Smart Sensors Market Revenue (Million) Forecast, by Application 2019 & 2032
- Table 14: France Global Smart Sensors Market Revenue (Million) Forecast, by Application 2019 & 2032
- Table 15: Spain Global Smart Sensors Market Revenue (Million) Forecast, by Application 2019 & 2032
- Table 16: Italy Global Smart Sensors Market Revenue (Million) Forecast, by Application 2019 & 2032
- Table 17: Spain Global Smart Sensors Market Revenue (Million) Forecast, by Application 2019 & 2032
- Table 18: Belgium Global Smart Sensors Market Revenue (Million) Forecast, by Application 2019 & 2032
- Table 19: Netherland Global Smart Sensors Market Revenue (Million) Forecast, by Application 2019 & 2032
- Table 20: Nordics Global Smart Sensors Market Revenue (Million) Forecast, by Application 2019 & 2032
- Table 21: Rest of Europe Global Smart Sensors Market Revenue (Million) Forecast, by Application 2019 & 2032
- Table 22: Global Smart Sensors Market Revenue Million Forecast, by Country 2019 & 2032
- Table 23: China Global Smart Sensors Market Revenue (Million) Forecast, by Application 2019 & 2032
- Table 24: Japan Global Smart Sensors Market Revenue (Million) Forecast, by Application 2019 & 2032
- Table 25: India Global Smart Sensors Market Revenue (Million) Forecast, by Application 2019 & 2032
- Table 26: South Korea Global Smart Sensors Market Revenue (Million) Forecast, by Application 2019 & 2032
- Table 27: Southeast Asia Global Smart Sensors Market Revenue (Million) Forecast, by Application 2019 & 2032
- Table 28: Australia Global Smart Sensors Market Revenue (Million) Forecast, by Application 2019 & 2032
- Table 29: Indonesia Global Smart Sensors Market Revenue (Million) Forecast, by Application 2019 & 2032
- Table 30: Phillipes Global Smart Sensors Market Revenue (Million) Forecast, by Application 2019 & 2032
- Table 31: Singapore Global Smart Sensors Market Revenue (Million) Forecast, by Application 2019 & 2032
- Table 32: Thailandc Global Smart Sensors Market Revenue (Million) Forecast, by Application 2019 & 2032
- Table 33: Rest of Asia Pacific Global Smart Sensors Market Revenue (Million) Forecast, by Application 2019 & 2032
- Table 34: Global Smart Sensors Market Revenue Million Forecast, by Country 2019 & 2032
- Table 35: Brazil Global Smart Sensors Market Revenue (Million) Forecast, by Application 2019 & 2032
- Table 36: Argentina Global Smart Sensors Market Revenue (Million) Forecast, by Application 2019 & 2032
- Table 37: Peru Global Smart Sensors Market Revenue (Million) Forecast, by Application 2019 & 2032
- Table 38: Chile Global Smart Sensors Market Revenue (Million) Forecast, by Application 2019 & 2032
- Table 39: Colombia Global Smart Sensors Market Revenue (Million) Forecast, by Application 2019 & 2032
- Table 40: Ecuador Global Smart Sensors Market Revenue (Million) Forecast, by Application 2019 & 2032
- Table 41: Venezuela Global Smart Sensors Market Revenue (Million) Forecast, by Application 2019 & 2032
- Table 42: Rest of South America Global Smart Sensors Market Revenue (Million) Forecast, by Application 2019 & 2032
- Table 43: Global Smart Sensors Market Revenue Million Forecast, by Country 2019 & 2032
- Table 44: United Arab Emirates Global Smart Sensors Market Revenue (Million) Forecast, by Application 2019 & 2032
- Table 45: Saudi Arabia Global Smart Sensors Market Revenue (Million) Forecast, by Application 2019 & 2032
- Table 46: South Africa Global Smart Sensors Market Revenue (Million) Forecast, by Application 2019 & 2032
- Table 47: Rest of Middle East and Africa Global Smart Sensors Market Revenue (Million) Forecast, by Application 2019 & 2032
- Table 48: Global Smart Sensors Market Revenue Million Forecast, by Type 2019 & 2032
- Table 49: Global Smart Sensors Market Revenue Million Forecast, by Technology 2019 & 2032
- Table 50: Global Smart Sensors Market Revenue Million Forecast, by Component 2019 & 2032
- Table 51: Global Smart Sensors Market Revenue Million Forecast, by Application 2019 & 2032
- Table 52: Global Smart Sensors Market Revenue Million Forecast, by Country 2019 & 2032
- Table 53: United States Global Smart Sensors Market Revenue (Million) Forecast, by Application 2019 & 2032
- Table 54: Canada Global Smart Sensors Market Revenue (Million) Forecast, by Application 2019 & 2032
- Table 55: Global Smart Sensors Market Revenue Million Forecast, by Type 2019 & 2032
- Table 56: Global Smart Sensors Market Revenue Million Forecast, by Technology 2019 & 2032
- Table 57: Global Smart Sensors Market Revenue Million Forecast, by Component 2019 & 2032
- Table 58: Global Smart Sensors Market Revenue Million Forecast, by Application 2019 & 2032
- Table 59: Global Smart Sensors Market Revenue Million Forecast, by Country 2019 & 2032
- Table 60: United Kingdom Global Smart Sensors Market Revenue (Million) Forecast, by Application 2019 & 2032
- Table 61: Germany Global Smart Sensors Market Revenue (Million) Forecast, by Application 2019 & 2032
- Table 62: France Global Smart Sensors Market Revenue (Million) Forecast, by Application 2019 & 2032
- Table 63: Rest of Europe Global Smart Sensors Market Revenue (Million) Forecast, by Application 2019 & 2032
- Table 64: Global Smart Sensors Market Revenue Million Forecast, by Type 2019 & 2032
- Table 65: Global Smart Sensors Market Revenue Million Forecast, by Technology 2019 & 2032
- Table 66: Global Smart Sensors Market Revenue Million Forecast, by Component 2019 & 2032
- Table 67: Global Smart Sensors Market Revenue Million Forecast, by Application 2019 & 2032
- Table 68: Global Smart Sensors Market Revenue Million Forecast, by Country 2019 & 2032
- Table 69: China Global Smart Sensors Market Revenue (Million) Forecast, by Application 2019 & 2032
- Table 70: India Global Smart Sensors Market Revenue (Million) Forecast, by Application 2019 & 2032
- Table 71: Japan Global Smart Sensors Market Revenue (Million) Forecast, by Application 2019 & 2032
- Table 72: Rest Asia Pacific Global Smart Sensors Market Revenue (Million) Forecast, by Application 2019 & 2032
- Table 73: Global Smart Sensors Market Revenue Million Forecast, by Type 2019 & 2032
- Table 74: Global Smart Sensors Market Revenue Million Forecast, by Technology 2019 & 2032
- Table 75: Global Smart Sensors Market Revenue Million Forecast, by Component 2019 & 2032
- Table 76: Global Smart Sensors Market Revenue Million Forecast, by Application 2019 & 2032
- Table 77: Global Smart Sensors Market Revenue Million Forecast, by Country 2019 & 2032
- Table 78: Global Smart Sensors Market Revenue Million Forecast, by Type 2019 & 2032
- Table 79: Global Smart Sensors Market Revenue Million Forecast, by Technology 2019 & 2032
- Table 80: Global Smart Sensors Market Revenue Million Forecast, by Component 2019 & 2032
- Table 81: Global Smart Sensors Market Revenue Million Forecast, by Application 2019 & 2032
- Table 82: Global Smart Sensors Market Revenue Million Forecast, by Country 2019 & 2032
Frequently Asked Questions
1. What is the projected Compound Annual Growth Rate (CAGR) of the Global Smart Sensors Market?
The projected CAGR is approximately 18.30%.
2. Which companies are prominent players in the Global Smart Sensors Market?
Key companies in the market include Infineon Technologies AG, ABB Ltd, General Electric, Legrand Inc, NXP Semiconductors N V, Siemens AG, Honeywell International, TE Connectivity Ltd, ST Microelectronics, Analog Devices Inc, Vishay Technology Inc , Eaton Corporation.
3. What are the main segments of the Global Smart Sensors Market?
The market segments include Type, Technology, Component, Application.
4. Can you provide details about the market size?
The market size is estimated to be USD 55.86 Million as of 2022.
5. What are some drivers contributing to market growth?
Growing Demand for Energy Efficiency and Saving; Increasing Demand for Consumer Electronics Products; Higher Demand for Smart Sensors in the Healthcare and Automotive Industries; Technology Advancements in Miniaturization and Wireless Capabilities.
6. What are the notable trends driving market growth?
Temperature Sensors to Witness High Growth.
7. Are there any restraints impacting market growth?
Relatively High Deployment Costs; Complex Design compared to Traditional Sensors.
8. Can you provide examples of recent developments in the market?
October 2022 : Optomotive, a producer of advanced, high-performance cameras and 3D smart sensors, announced the debut of two new product lines at VISION 2022. will show off its fully engineered LOM series of 3D high-speed smart sensors. High-speed laser triangulation sensors from the LOM sensor line, which is based on Optomotive's FPGA camera technology, may be fully customized and user-programmed. The series is capable of inspection rates of up to 10 kHz and is designed for high-performance examination.
9. What pricing options are available for accessing the report?
Pricing options include single-user, multi-user, and enterprise licenses priced at USD 4750, USD 5250, and USD 8750 respectively.
10. Is the market size provided in terms of value or volume?
The market size is provided in terms of value, measured in Million.
11. Are there any specific market keywords associated with the report?
Yes, the market keyword associated with the report is "Global Smart Sensors Market," which aids in identifying and referencing the specific market segment covered.
12. How do I determine which pricing option suits my needs best?
The pricing options vary based on user requirements and access needs. Individual users may opt for single-user licenses, while businesses requiring broader access may choose multi-user or enterprise licenses for cost-effective access to the report.
13. Are there any additional resources or data provided in the Global Smart Sensors Market report?
While the report offers comprehensive insights, it's advisable to review the specific contents or supplementary materials provided to ascertain if additional resources or data are available.
14. How can I stay updated on further developments or reports in the Global Smart Sensors Market?
To stay informed about further developments, trends, and reports in the Global Smart Sensors Market, consider subscribing to industry newsletters, following relevant companies and organizations, or regularly checking reputable industry news sources and publications.
Methodology
Step 1 - Identification of Relevant Samples Size from Population Database


Step 2 - Approaches for Defining Global Market Size (Value, Volume* & Price*)

Note*: In applicable scenarios
Step 3 - Data Sources
Primary Research
- Web Analytics
- Survey Reports
- Research Institute
- Latest Research Reports
- Opinion Leaders
Secondary Research
- Annual Reports
- White Paper
- Latest Press Release
- Industry Association
- Paid Database
- Investor Presentations

Step 4 - Data Triangulation
Involves using different sources of information in order to increase the validity of a study
These sources are likely to be stakeholders in a program - participants, other researchers, program staff, other community members, and so on.
Then we put all data in single framework & apply various statistical tools to find out the dynamic on the market.
During the analysis stage, feedback from the stakeholder groups would be compared to determine areas of agreement as well as areas of divergence


