
Key Insights
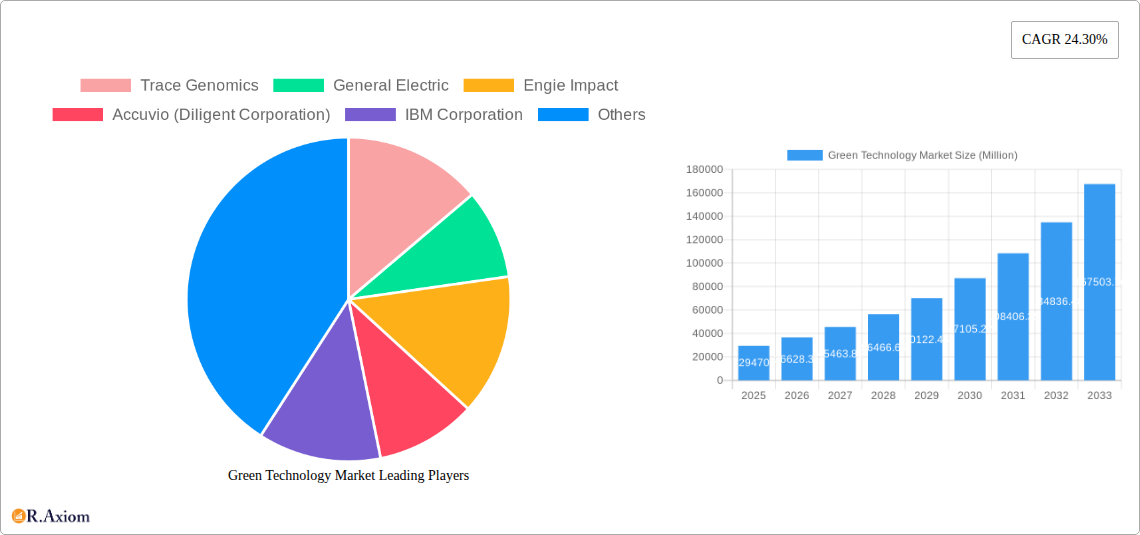
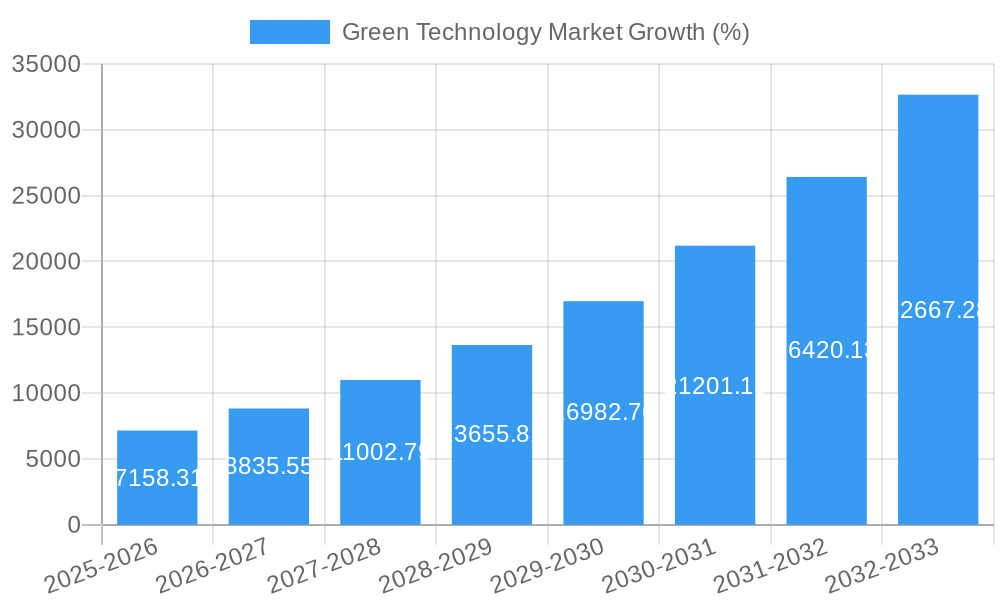
The global green technology market, valued at $29.47 billion in 2025, is projected to experience robust growth, exhibiting a Compound Annual Growth Rate (CAGR) of 24.30% from 2025 to 2033. This expansion is driven by several key factors. Increasing environmental concerns, stringent government regulations aimed at reducing carbon emissions and promoting sustainability, and rising corporate social responsibility initiatives are fueling demand for green technologies across various sectors. Technological advancements in areas like IoT, AI, and cloud computing are enabling the development of more efficient and cost-effective solutions for environmental monitoring, resource management, and pollution control. Furthermore, the growing adoption of sustainable practices within industries like construction (green building), agriculture (precision farming), and energy production is significantly contributing to market growth. The market's segmentation reveals strong performance across technologies like IoT for smart grids and environmental monitoring, AI and analytics for data-driven decision-making, and cloud computing for scalable data storage and processing. Applications such as carbon footprint management, air and water pollution monitoring, and precision agriculture are leading segments, reflecting the diverse applications of green technologies in addressing critical environmental challenges.
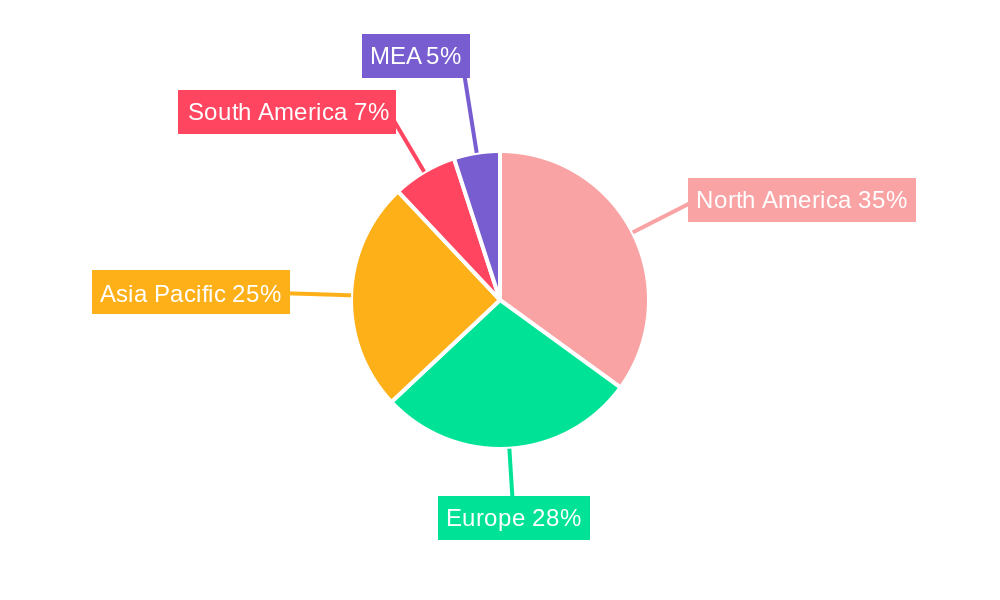
The market's geographical distribution shows significant contributions from North America and Europe, driven by early adoption of green technologies and stringent environmental regulations. However, Asia-Pacific is expected to witness rapid growth, particularly in countries like China and India, due to increasing industrialization and government initiatives supporting sustainable development. While challenges remain, including the high initial investment costs associated with implementing green technologies and potential technological limitations, the overall market outlook is overwhelmingly positive. The long-term prospects for the green technology market are bright, fueled by the increasing urgency to address climate change and the ongoing technological innovations that are continually improving efficiency and reducing costs. Key players such as General Electric, IBM, Microsoft, and others are actively investing in research and development, further accelerating market growth and fostering innovation.
Green Technology Market: A Comprehensive Report (2019-2033)
This comprehensive report provides an in-depth analysis of the Green Technology market, covering its current state, future trends, and key players. With a study period spanning 2019-2033, a base year of 2025, and a forecast period of 2025-2033, this report offers invaluable insights for businesses, investors, and policymakers navigating this rapidly evolving sector. The market is segmented by technology (IoT, AI & Analytics, Digital Twin, Cloud Computing, Blockchain, Other Technologies), application (Green Building, Carbon Footprint Management, Air & Water Pollution Monitoring, Weather Monitoring & Forecast, Crop Monitoring, Soil Condition/Moisture Monitoring, Forest Monitoring, Other Applications), and component (Solution, Services). The report values are expressed in Millions.
Green Technology Market Concentration & Innovation
This section analyzes the competitive landscape of the green technology market, examining market concentration, innovation drivers, regulatory influences, and market dynamics. The report assesses the market share of leading players and analyzes the impact of mergers and acquisitions (M&A) activities on market structure. Deal values are analyzed to identify trends in consolidation and strategic investment. Furthermore, the analysis includes an examination of product substitutes, evolving end-user trends, and the regulatory frameworks shaping innovation and competition within the sector.
- Market Concentration: The market exhibits a [xx]% concentration ratio for the top 5 players in 2024, indicating a [highly competitive/moderately concentrated/oligopolistic] market structure. This is expected to [increase/decrease/remain relatively stable] during the forecast period.
- Innovation Drivers: Key innovation drivers include advancements in IoT, AI, and cloud computing, enabling more efficient and data-driven solutions. Government regulations promoting sustainable practices are also major catalysts.
- Regulatory Frameworks: Stringent environmental regulations across various jurisdictions are driving market growth. However, inconsistencies and complexities across different regions pose a challenge to businesses.
- Product Substitutes: Traditional technologies gradually lose market share to green alternatives driven by cost savings and regulatory pressures.
- M&A Activities: The report details significant M&A transactions, estimating a total deal value of xx Million in the past five years. These activities reflect strategies for expanding market share, gaining access to innovative technologies, and securing a stronger position in the market. The average M&A deal size is estimated at xx Million.
- End-User Trends: Growing awareness of environmental sustainability among consumers and businesses is a critical driver, fostering higher demand for green technologies.
Green Technology Market Industry Trends & Insights
This section delves into the key market trends impacting the green technology sector, including market growth drivers, technological disruptions, consumer preferences, and competitive dynamics. The report presents a detailed analysis of market size, growth rate, and future projections, including compound annual growth rate (CAGR) and market penetration rates for various segments. The analysis accounts for fluctuating economic conditions and their impact on investment decisions. The impact of consumer behavior changes, such as increased preference for sustainable products, is also evaluated.
Dominant Markets & Segments in Green Technology Market
This section identifies the leading regions, countries, and market segments within the Green Technology market. The analysis explores the factors driving the dominance of specific segments, including economic policies, infrastructure developments, and technological advancements.
Leading Regions/Countries: [Identify the leading region/country and provide rationale. For example: North America holds a significant market share due to stringent environmental regulations and strong investments in green technologies.]
Dominant Segments:
By Technology:
- IoT: [Describe market size, CAGR, and key drivers]
- AI and Analytics: [Describe market size, CAGR, and key drivers]
- Digital Twin: [Describe market size, CAGR, and key drivers]
- Cloud Computing: [Describe market size, CAGR, and key drivers]
- Blockchain: [Describe market size, CAGR, and key drivers]
- Other Technologies: [Describe market size, CAGR, and key drivers]
By Application:
- Green Building: [Describe market size, CAGR, and key drivers]
- Carbon Footprint Management: [Describe market size, CAGR, and key drivers]
- Air and Water Pollution Monitoring: [Describe market size, CAGR, and key drivers]
- Weather Monitoring and Forecast: [Describe market size, CAGR, and key drivers]
- Crop Monitoring: [Describe market size, CAGR, and key drivers]
- Soil Condition/Moisture Monitoring: [Describe market size, CAGR, and key drivers]
- Forest Monitoring: [Describe market size, CAGR, and key drivers]
- Other Applications: [Describe market size, CAGR, and key drivers]
By Component:
- Solution: [Describe market size, CAGR, and key drivers]
- Services: [Describe market size, CAGR, and key drivers]
Green Technology Market Product Developments
Recent product innovations in the green technology sector showcase an increasing emphasis on integration, automation, and data analytics for enhancing efficiency and lowering environmental impact. New applications are emerging across diverse sectors like agriculture, manufacturing, and energy, demonstrating the sector's growing versatility and market reach. These advancements provide significant competitive advantages, particularly regarding cost reduction, improved performance, and stronger market fit.
Report Scope & Segmentation Analysis
This report comprehensively covers the Green Technology market, segmented by technology, application, and component. Each segment's growth projections, market size (in Millions), and competitive dynamics are detailed. Growth projections for each segment are provided for the forecast period (2025-2033). The competitive landscape within each segment is analyzed, highlighting key players and their market strategies.
Key Drivers of Green Technology Market Growth
The Green Technology market is propelled by several key factors. Stringent environmental regulations worldwide incentivize the adoption of sustainable solutions. Increasing awareness of climate change among consumers and businesses fuels demand for eco-friendly products and services. Technological advancements, particularly in IoT, AI, and cloud computing, enable the development of more efficient and cost-effective green technologies. Government initiatives promoting renewable energy and sustainable development further accelerate market growth.
Challenges in the Green Technology Market Sector
Despite significant growth potential, the Green Technology market faces several challenges. High initial investment costs can be a barrier for adoption, particularly for small and medium-sized enterprises (SMEs). Supply chain disruptions can impact the availability and affordability of raw materials and components. Competition from established players with entrenched market positions can also pose significant challenges. Regulatory uncertainty and inconsistencies across different regions can complicate market entry and expansion. These factors can cumulatively affect market growth and profitability.
Emerging Opportunities in Green Technology Market
The Green Technology market presents numerous opportunities. The expanding renewable energy sector provides vast potential for growth, particularly in solar and wind power technologies. The increasing demand for energy-efficient building solutions presents a substantial market opening. The development and implementation of smart grid technologies are significant opportunities. Advancements in carbon capture and storage technologies offer a promising avenue for environmental remediation and emission reduction. These developments hold the key to unlocking significant economic and environmental benefits.
Leading Players in the Green Technology Market
- Trace Genomics
- General Electric
- Engie Impact
- Accuvio (Diligent Corporation)
- IBM Corporation
- Microsoft Corporation
- Sensus (Xylem brand)
- Wolters Kluwer N V
- Cropx inc
- Oracle
Key Developments in Green Technology Market Industry
- May 2023: ARPA-E and the California Energy Commission partnered to identify funding opportunities for green technology R&D, focusing on energy cost reduction, grid modernization, and environmental mitigation.
- September 2022: UST and Green Grid Inc. formed a strategic alliance to provide AI-enabled solutions for ESG and infrastructure management in the public and private sectors.
Strategic Outlook for Green Technology Market
The Green Technology market is poised for significant growth, driven by increasing environmental awareness, supportive government policies, and technological advancements. The integration of AI and IoT in green technologies will further enhance efficiency and data-driven decision-making. Expanding into new markets and developing innovative solutions tailored to specific needs will be crucial for success in this dynamic sector. The market's long-term outlook is positive, with strong potential for both revenue growth and positive environmental impact.
Green Technology Market Segmentation
-
1. Component
- 1.1. Solution
- 1.2. Services
-
2. Technology
- 2.1. IOT
- 2.2. AI and Analytics
- 2.3. Digital Twin
- 2.4. Cloud Computing
- 2.5. Blockchain
- 2.6. Other Technologies
-
3. Application
- 3.1. Green Building
- 3.2. Carbon Footprint Management
- 3.3. Air and Water Pollution Monitoring
- 3.4. Weather Monitoring and Forecast
- 3.5. Crop Monitoring
- 3.6. Soil Condition/Moisture Monitoring
- 3.7. Forest Monitoring
- 3.8. Other Applications
Green Technology Market Segmentation By Geography
- 1. North America
- 2. Europe
- 3. Asia
- 4. Australia and New Zealand
- 5. Latin America
- 6. Middle East and Africa
Green Technology Market REPORT HIGHLIGHTS
| Aspects | Details |
|---|---|
| Study Period | 2019-2033 |
| Base Year | 2024 |
| Estimated Year | 2025 |
| Forecast Period | 2025-2033 |
| Historical Period | 2019-2024 |
| Growth Rate | CAGR of 24.30% from 2019-2033 |
| Segmentation |
|
Table of Contents
- 1. Introduction
- 1.1. Research Scope
- 1.2. Market Segmentation
- 1.3. Research Methodology
- 1.4. Definitions and Assumptions
- 2. Executive Summary
- 2.1. Introduction
- 3. Market Dynamics
- 3.1. Introduction
- 3.2. Market Drivers
- 3.2.1. Growth in Environment Concerns and Awarness; Growth in Government Initiatives for Low Carbon Policies.
- 3.3. Market Restrains
- 3.3.1. High Product Cost; Lack of Government Regulations in Developing Nations
- 3.4. Market Trends
- 3.4.1. Green Building is Expected to Drive the Market
- 4. Market Factor Analysis
- 4.1. Porters Five Forces
- 4.2. Supply/Value Chain
- 4.3. PESTEL analysis
- 4.4. Market Entropy
- 4.5. Patent/Trademark Analysis
- 5. Global Green Technology Market Analysis, Insights and Forecast, 2019-2031
- 5.1. Market Analysis, Insights and Forecast - by Component
- 5.1.1. Solution
- 5.1.2. Services
- 5.2. Market Analysis, Insights and Forecast - by Technology
- 5.2.1. IOT
- 5.2.2. AI and Analytics
- 5.2.3. Digital Twin
- 5.2.4. Cloud Computing
- 5.2.5. Blockchain
- 5.2.6. Other Technologies
- 5.3. Market Analysis, Insights and Forecast - by Application
- 5.3.1. Green Building
- 5.3.2. Carbon Footprint Management
- 5.3.3. Air and Water Pollution Monitoring
- 5.3.4. Weather Monitoring and Forecast
- 5.3.5. Crop Monitoring
- 5.3.6. Soil Condition/Moisture Monitoring
- 5.3.7. Forest Monitoring
- 5.3.8. Other Applications
- 5.4. Market Analysis, Insights and Forecast - by Region
- 5.4.1. North America
- 5.4.2. Europe
- 5.4.3. Asia
- 5.4.4. Australia and New Zealand
- 5.4.5. Latin America
- 5.4.6. Middle East and Africa
- 5.1. Market Analysis, Insights and Forecast - by Component
- 6. North America Green Technology Market Analysis, Insights and Forecast, 2019-2031
- 6.1. Market Analysis, Insights and Forecast - by Component
- 6.1.1. Solution
- 6.1.2. Services
- 6.2. Market Analysis, Insights and Forecast - by Technology
- 6.2.1. IOT
- 6.2.2. AI and Analytics
- 6.2.3. Digital Twin
- 6.2.4. Cloud Computing
- 6.2.5. Blockchain
- 6.2.6. Other Technologies
- 6.3. Market Analysis, Insights and Forecast - by Application
- 6.3.1. Green Building
- 6.3.2. Carbon Footprint Management
- 6.3.3. Air and Water Pollution Monitoring
- 6.3.4. Weather Monitoring and Forecast
- 6.3.5. Crop Monitoring
- 6.3.6. Soil Condition/Moisture Monitoring
- 6.3.7. Forest Monitoring
- 6.3.8. Other Applications
- 6.1. Market Analysis, Insights and Forecast - by Component
- 7. Europe Green Technology Market Analysis, Insights and Forecast, 2019-2031
- 7.1. Market Analysis, Insights and Forecast - by Component
- 7.1.1. Solution
- 7.1.2. Services
- 7.2. Market Analysis, Insights and Forecast - by Technology
- 7.2.1. IOT
- 7.2.2. AI and Analytics
- 7.2.3. Digital Twin
- 7.2.4. Cloud Computing
- 7.2.5. Blockchain
- 7.2.6. Other Technologies
- 7.3. Market Analysis, Insights and Forecast - by Application
- 7.3.1. Green Building
- 7.3.2. Carbon Footprint Management
- 7.3.3. Air and Water Pollution Monitoring
- 7.3.4. Weather Monitoring and Forecast
- 7.3.5. Crop Monitoring
- 7.3.6. Soil Condition/Moisture Monitoring
- 7.3.7. Forest Monitoring
- 7.3.8. Other Applications
- 7.1. Market Analysis, Insights and Forecast - by Component
- 8. Asia Green Technology Market Analysis, Insights and Forecast, 2019-2031
- 8.1. Market Analysis, Insights and Forecast - by Component
- 8.1.1. Solution
- 8.1.2. Services
- 8.2. Market Analysis, Insights and Forecast - by Technology
- 8.2.1. IOT
- 8.2.2. AI and Analytics
- 8.2.3. Digital Twin
- 8.2.4. Cloud Computing
- 8.2.5. Blockchain
- 8.2.6. Other Technologies
- 8.3. Market Analysis, Insights and Forecast - by Application
- 8.3.1. Green Building
- 8.3.2. Carbon Footprint Management
- 8.3.3. Air and Water Pollution Monitoring
- 8.3.4. Weather Monitoring and Forecast
- 8.3.5. Crop Monitoring
- 8.3.6. Soil Condition/Moisture Monitoring
- 8.3.7. Forest Monitoring
- 8.3.8. Other Applications
- 8.1. Market Analysis, Insights and Forecast - by Component
- 9. Australia and New Zealand Green Technology Market Analysis, Insights and Forecast, 2019-2031
- 9.1. Market Analysis, Insights and Forecast - by Component
- 9.1.1. Solution
- 9.1.2. Services
- 9.2. Market Analysis, Insights and Forecast - by Technology
- 9.2.1. IOT
- 9.2.2. AI and Analytics
- 9.2.3. Digital Twin
- 9.2.4. Cloud Computing
- 9.2.5. Blockchain
- 9.2.6. Other Technologies
- 9.3. Market Analysis, Insights and Forecast - by Application
- 9.3.1. Green Building
- 9.3.2. Carbon Footprint Management
- 9.3.3. Air and Water Pollution Monitoring
- 9.3.4. Weather Monitoring and Forecast
- 9.3.5. Crop Monitoring
- 9.3.6. Soil Condition/Moisture Monitoring
- 9.3.7. Forest Monitoring
- 9.3.8. Other Applications
- 9.1. Market Analysis, Insights and Forecast - by Component
- 10. Latin America Green Technology Market Analysis, Insights and Forecast, 2019-2031
- 10.1. Market Analysis, Insights and Forecast - by Component
- 10.1.1. Solution
- 10.1.2. Services
- 10.2. Market Analysis, Insights and Forecast - by Technology
- 10.2.1. IOT
- 10.2.2. AI and Analytics
- 10.2.3. Digital Twin
- 10.2.4. Cloud Computing
- 10.2.5. Blockchain
- 10.2.6. Other Technologies
- 10.3. Market Analysis, Insights and Forecast - by Application
- 10.3.1. Green Building
- 10.3.2. Carbon Footprint Management
- 10.3.3. Air and Water Pollution Monitoring
- 10.3.4. Weather Monitoring and Forecast
- 10.3.5. Crop Monitoring
- 10.3.6. Soil Condition/Moisture Monitoring
- 10.3.7. Forest Monitoring
- 10.3.8. Other Applications
- 10.1. Market Analysis, Insights and Forecast - by Component
- 11. Middle East and Africa Green Technology Market Analysis, Insights and Forecast, 2019-2031
- 11.1. Market Analysis, Insights and Forecast - by Component
- 11.1.1. Solution
- 11.1.2. Services
- 11.2. Market Analysis, Insights and Forecast - by Technology
- 11.2.1. IOT
- 11.2.2. AI and Analytics
- 11.2.3. Digital Twin
- 11.2.4. Cloud Computing
- 11.2.5. Blockchain
- 11.2.6. Other Technologies
- 11.3. Market Analysis, Insights and Forecast - by Application
- 11.3.1. Green Building
- 11.3.2. Carbon Footprint Management
- 11.3.3. Air and Water Pollution Monitoring
- 11.3.4. Weather Monitoring and Forecast
- 11.3.5. Crop Monitoring
- 11.3.6. Soil Condition/Moisture Monitoring
- 11.3.7. Forest Monitoring
- 11.3.8. Other Applications
- 11.1. Market Analysis, Insights and Forecast - by Component
- 12. North America Green Technology Market Analysis, Insights and Forecast, 2019-2031
- 12.1. Market Analysis, Insights and Forecast - By Country/Sub-region
- 12.1.1 United States
- 12.1.2 Canada
- 12.1.3 Mexico
- 13. Europe Green Technology Market Analysis, Insights and Forecast, 2019-2031
- 13.1. Market Analysis, Insights and Forecast - By Country/Sub-region
- 13.1.1 Germany
- 13.1.2 United Kingdom
- 13.1.3 France
- 13.1.4 Spain
- 13.1.5 Italy
- 13.1.6 Spain
- 13.1.7 Belgium
- 13.1.8 Netherland
- 13.1.9 Nordics
- 13.1.10 Rest of Europe
- 14. Asia Pacific Green Technology Market Analysis, Insights and Forecast, 2019-2031
- 14.1. Market Analysis, Insights and Forecast - By Country/Sub-region
- 14.1.1 China
- 14.1.2 Japan
- 14.1.3 India
- 14.1.4 South Korea
- 14.1.5 Southeast Asia
- 14.1.6 Australia
- 14.1.7 Indonesia
- 14.1.8 Phillipes
- 14.1.9 Singapore
- 14.1.10 Thailandc
- 14.1.11 Rest of Asia Pacific
- 15. South America Green Technology Market Analysis, Insights and Forecast, 2019-2031
- 15.1. Market Analysis, Insights and Forecast - By Country/Sub-region
- 15.1.1 Brazil
- 15.1.2 Argentina
- 15.1.3 Peru
- 15.1.4 Chile
- 15.1.5 Colombia
- 15.1.6 Ecuador
- 15.1.7 Venezuela
- 15.1.8 Rest of South America
- 16. North America Green Technology Market Analysis, Insights and Forecast, 2019-2031
- 16.1. Market Analysis, Insights and Forecast - By Country/Sub-region
- 16.1.1 United States
- 16.1.2 Canada
- 16.1.3 Mexico
- 17. MEA Green Technology Market Analysis, Insights and Forecast, 2019-2031
- 17.1. Market Analysis, Insights and Forecast - By Country/Sub-region
- 17.1.1 United Arab Emirates
- 17.1.2 Saudi Arabia
- 17.1.3 South Africa
- 17.1.4 Rest of Middle East and Africa
- 18. Competitive Analysis
- 18.1. Global Market Share Analysis 2024
- 18.2. Company Profiles
- 18.2.1 Trace Genomics
- 18.2.1.1. Overview
- 18.2.1.2. Products
- 18.2.1.3. SWOT Analysis
- 18.2.1.4. Recent Developments
- 18.2.1.5. Financials (Based on Availability)
- 18.2.2 General Electric
- 18.2.2.1. Overview
- 18.2.2.2. Products
- 18.2.2.3. SWOT Analysis
- 18.2.2.4. Recent Developments
- 18.2.2.5. Financials (Based on Availability)
- 18.2.3 Engie Impact
- 18.2.3.1. Overview
- 18.2.3.2. Products
- 18.2.3.3. SWOT Analysis
- 18.2.3.4. Recent Developments
- 18.2.3.5. Financials (Based on Availability)
- 18.2.4 Accuvio (Diligent Corporation)
- 18.2.4.1. Overview
- 18.2.4.2. Products
- 18.2.4.3. SWOT Analysis
- 18.2.4.4. Recent Developments
- 18.2.4.5. Financials (Based on Availability)
- 18.2.5 IBM Corporation
- 18.2.5.1. Overview
- 18.2.5.2. Products
- 18.2.5.3. SWOT Analysis
- 18.2.5.4. Recent Developments
- 18.2.5.5. Financials (Based on Availability)
- 18.2.6 Microsoft Corporation
- 18.2.6.1. Overview
- 18.2.6.2. Products
- 18.2.6.3. SWOT Analysis
- 18.2.6.4. Recent Developments
- 18.2.6.5. Financials (Based on Availability)
- 18.2.7 Sensus ( Xylem brand)
- 18.2.7.1. Overview
- 18.2.7.2. Products
- 18.2.7.3. SWOT Analysis
- 18.2.7.4. Recent Developments
- 18.2.7.5. Financials (Based on Availability)
- 18.2.8 Wolters Kluwer N V
- 18.2.8.1. Overview
- 18.2.8.2. Products
- 18.2.8.3. SWOT Analysis
- 18.2.8.4. Recent Developments
- 18.2.8.5. Financials (Based on Availability)
- 18.2.9 Cropx inc
- 18.2.9.1. Overview
- 18.2.9.2. Products
- 18.2.9.3. SWOT Analysis
- 18.2.9.4. Recent Developments
- 18.2.9.5. Financials (Based on Availability)
- 18.2.10 Oracle
- 18.2.10.1. Overview
- 18.2.10.2. Products
- 18.2.10.3. SWOT Analysis
- 18.2.10.4. Recent Developments
- 18.2.10.5. Financials (Based on Availability)
- 18.2.1 Trace Genomics
List of Figures
- Figure 1: Global Green Technology Market Revenue Breakdown (Million, %) by Region 2024 & 2032
- Figure 2: North America Green Technology Market Revenue (Million), by Country 2024 & 2032
- Figure 3: North America Green Technology Market Revenue Share (%), by Country 2024 & 2032
- Figure 4: Europe Green Technology Market Revenue (Million), by Country 2024 & 2032
- Figure 5: Europe Green Technology Market Revenue Share (%), by Country 2024 & 2032
- Figure 6: Asia Pacific Green Technology Market Revenue (Million), by Country 2024 & 2032
- Figure 7: Asia Pacific Green Technology Market Revenue Share (%), by Country 2024 & 2032
- Figure 8: South America Green Technology Market Revenue (Million), by Country 2024 & 2032
- Figure 9: South America Green Technology Market Revenue Share (%), by Country 2024 & 2032
- Figure 10: North America Green Technology Market Revenue (Million), by Country 2024 & 2032
- Figure 11: North America Green Technology Market Revenue Share (%), by Country 2024 & 2032
- Figure 12: MEA Green Technology Market Revenue (Million), by Country 2024 & 2032
- Figure 13: MEA Green Technology Market Revenue Share (%), by Country 2024 & 2032
- Figure 14: North America Green Technology Market Revenue (Million), by Component 2024 & 2032
- Figure 15: North America Green Technology Market Revenue Share (%), by Component 2024 & 2032
- Figure 16: North America Green Technology Market Revenue (Million), by Technology 2024 & 2032
- Figure 17: North America Green Technology Market Revenue Share (%), by Technology 2024 & 2032
- Figure 18: North America Green Technology Market Revenue (Million), by Application 2024 & 2032
- Figure 19: North America Green Technology Market Revenue Share (%), by Application 2024 & 2032
- Figure 20: North America Green Technology Market Revenue (Million), by Country 2024 & 2032
- Figure 21: North America Green Technology Market Revenue Share (%), by Country 2024 & 2032
- Figure 22: Europe Green Technology Market Revenue (Million), by Component 2024 & 2032
- Figure 23: Europe Green Technology Market Revenue Share (%), by Component 2024 & 2032
- Figure 24: Europe Green Technology Market Revenue (Million), by Technology 2024 & 2032
- Figure 25: Europe Green Technology Market Revenue Share (%), by Technology 2024 & 2032
- Figure 26: Europe Green Technology Market Revenue (Million), by Application 2024 & 2032
- Figure 27: Europe Green Technology Market Revenue Share (%), by Application 2024 & 2032
- Figure 28: Europe Green Technology Market Revenue (Million), by Country 2024 & 2032
- Figure 29: Europe Green Technology Market Revenue Share (%), by Country 2024 & 2032
- Figure 30: Asia Green Technology Market Revenue (Million), by Component 2024 & 2032
- Figure 31: Asia Green Technology Market Revenue Share (%), by Component 2024 & 2032
- Figure 32: Asia Green Technology Market Revenue (Million), by Technology 2024 & 2032
- Figure 33: Asia Green Technology Market Revenue Share (%), by Technology 2024 & 2032
- Figure 34: Asia Green Technology Market Revenue (Million), by Application 2024 & 2032
- Figure 35: Asia Green Technology Market Revenue Share (%), by Application 2024 & 2032
- Figure 36: Asia Green Technology Market Revenue (Million), by Country 2024 & 2032
- Figure 37: Asia Green Technology Market Revenue Share (%), by Country 2024 & 2032
- Figure 38: Australia and New Zealand Green Technology Market Revenue (Million), by Component 2024 & 2032
- Figure 39: Australia and New Zealand Green Technology Market Revenue Share (%), by Component 2024 & 2032
- Figure 40: Australia and New Zealand Green Technology Market Revenue (Million), by Technology 2024 & 2032
- Figure 41: Australia and New Zealand Green Technology Market Revenue Share (%), by Technology 2024 & 2032
- Figure 42: Australia and New Zealand Green Technology Market Revenue (Million), by Application 2024 & 2032
- Figure 43: Australia and New Zealand Green Technology Market Revenue Share (%), by Application 2024 & 2032
- Figure 44: Australia and New Zealand Green Technology Market Revenue (Million), by Country 2024 & 2032
- Figure 45: Australia and New Zealand Green Technology Market Revenue Share (%), by Country 2024 & 2032
- Figure 46: Latin America Green Technology Market Revenue (Million), by Component 2024 & 2032
- Figure 47: Latin America Green Technology Market Revenue Share (%), by Component 2024 & 2032
- Figure 48: Latin America Green Technology Market Revenue (Million), by Technology 2024 & 2032
- Figure 49: Latin America Green Technology Market Revenue Share (%), by Technology 2024 & 2032
- Figure 50: Latin America Green Technology Market Revenue (Million), by Application 2024 & 2032
- Figure 51: Latin America Green Technology Market Revenue Share (%), by Application 2024 & 2032
- Figure 52: Latin America Green Technology Market Revenue (Million), by Country 2024 & 2032
- Figure 53: Latin America Green Technology Market Revenue Share (%), by Country 2024 & 2032
- Figure 54: Middle East and Africa Green Technology Market Revenue (Million), by Component 2024 & 2032
- Figure 55: Middle East and Africa Green Technology Market Revenue Share (%), by Component 2024 & 2032
- Figure 56: Middle East and Africa Green Technology Market Revenue (Million), by Technology 2024 & 2032
- Figure 57: Middle East and Africa Green Technology Market Revenue Share (%), by Technology 2024 & 2032
- Figure 58: Middle East and Africa Green Technology Market Revenue (Million), by Application 2024 & 2032
- Figure 59: Middle East and Africa Green Technology Market Revenue Share (%), by Application 2024 & 2032
- Figure 60: Middle East and Africa Green Technology Market Revenue (Million), by Country 2024 & 2032
- Figure 61: Middle East and Africa Green Technology Market Revenue Share (%), by Country 2024 & 2032
List of Tables
- Table 1: Global Green Technology Market Revenue Million Forecast, by Region 2019 & 2032
- Table 2: Global Green Technology Market Revenue Million Forecast, by Component 2019 & 2032
- Table 3: Global Green Technology Market Revenue Million Forecast, by Technology 2019 & 2032
- Table 4: Global Green Technology Market Revenue Million Forecast, by Application 2019 & 2032
- Table 5: Global Green Technology Market Revenue Million Forecast, by Region 2019 & 2032
- Table 6: Global Green Technology Market Revenue Million Forecast, by Country 2019 & 2032
- Table 7: United States Green Technology Market Revenue (Million) Forecast, by Application 2019 & 2032
- Table 8: Canada Green Technology Market Revenue (Million) Forecast, by Application 2019 & 2032
- Table 9: Mexico Green Technology Market Revenue (Million) Forecast, by Application 2019 & 2032
- Table 10: Global Green Technology Market Revenue Million Forecast, by Country 2019 & 2032
- Table 11: Germany Green Technology Market Revenue (Million) Forecast, by Application 2019 & 2032
- Table 12: United Kingdom Green Technology Market Revenue (Million) Forecast, by Application 2019 & 2032
- Table 13: France Green Technology Market Revenue (Million) Forecast, by Application 2019 & 2032
- Table 14: Spain Green Technology Market Revenue (Million) Forecast, by Application 2019 & 2032
- Table 15: Italy Green Technology Market Revenue (Million) Forecast, by Application 2019 & 2032
- Table 16: Spain Green Technology Market Revenue (Million) Forecast, by Application 2019 & 2032
- Table 17: Belgium Green Technology Market Revenue (Million) Forecast, by Application 2019 & 2032
- Table 18: Netherland Green Technology Market Revenue (Million) Forecast, by Application 2019 & 2032
- Table 19: Nordics Green Technology Market Revenue (Million) Forecast, by Application 2019 & 2032
- Table 20: Rest of Europe Green Technology Market Revenue (Million) Forecast, by Application 2019 & 2032
- Table 21: Global Green Technology Market Revenue Million Forecast, by Country 2019 & 2032
- Table 22: China Green Technology Market Revenue (Million) Forecast, by Application 2019 & 2032
- Table 23: Japan Green Technology Market Revenue (Million) Forecast, by Application 2019 & 2032
- Table 24: India Green Technology Market Revenue (Million) Forecast, by Application 2019 & 2032
- Table 25: South Korea Green Technology Market Revenue (Million) Forecast, by Application 2019 & 2032
- Table 26: Southeast Asia Green Technology Market Revenue (Million) Forecast, by Application 2019 & 2032
- Table 27: Australia Green Technology Market Revenue (Million) Forecast, by Application 2019 & 2032
- Table 28: Indonesia Green Technology Market Revenue (Million) Forecast, by Application 2019 & 2032
- Table 29: Phillipes Green Technology Market Revenue (Million) Forecast, by Application 2019 & 2032
- Table 30: Singapore Green Technology Market Revenue (Million) Forecast, by Application 2019 & 2032
- Table 31: Thailandc Green Technology Market Revenue (Million) Forecast, by Application 2019 & 2032
- Table 32: Rest of Asia Pacific Green Technology Market Revenue (Million) Forecast, by Application 2019 & 2032
- Table 33: Global Green Technology Market Revenue Million Forecast, by Country 2019 & 2032
- Table 34: Brazil Green Technology Market Revenue (Million) Forecast, by Application 2019 & 2032
- Table 35: Argentina Green Technology Market Revenue (Million) Forecast, by Application 2019 & 2032
- Table 36: Peru Green Technology Market Revenue (Million) Forecast, by Application 2019 & 2032
- Table 37: Chile Green Technology Market Revenue (Million) Forecast, by Application 2019 & 2032
- Table 38: Colombia Green Technology Market Revenue (Million) Forecast, by Application 2019 & 2032
- Table 39: Ecuador Green Technology Market Revenue (Million) Forecast, by Application 2019 & 2032
- Table 40: Venezuela Green Technology Market Revenue (Million) Forecast, by Application 2019 & 2032
- Table 41: Rest of South America Green Technology Market Revenue (Million) Forecast, by Application 2019 & 2032
- Table 42: Global Green Technology Market Revenue Million Forecast, by Country 2019 & 2032
- Table 43: United States Green Technology Market Revenue (Million) Forecast, by Application 2019 & 2032
- Table 44: Canada Green Technology Market Revenue (Million) Forecast, by Application 2019 & 2032
- Table 45: Mexico Green Technology Market Revenue (Million) Forecast, by Application 2019 & 2032
- Table 46: Global Green Technology Market Revenue Million Forecast, by Country 2019 & 2032
- Table 47: United Arab Emirates Green Technology Market Revenue (Million) Forecast, by Application 2019 & 2032
- Table 48: Saudi Arabia Green Technology Market Revenue (Million) Forecast, by Application 2019 & 2032
- Table 49: South Africa Green Technology Market Revenue (Million) Forecast, by Application 2019 & 2032
- Table 50: Rest of Middle East and Africa Green Technology Market Revenue (Million) Forecast, by Application 2019 & 2032
- Table 51: Global Green Technology Market Revenue Million Forecast, by Component 2019 & 2032
- Table 52: Global Green Technology Market Revenue Million Forecast, by Technology 2019 & 2032
- Table 53: Global Green Technology Market Revenue Million Forecast, by Application 2019 & 2032
- Table 54: Global Green Technology Market Revenue Million Forecast, by Country 2019 & 2032
- Table 55: Global Green Technology Market Revenue Million Forecast, by Component 2019 & 2032
- Table 56: Global Green Technology Market Revenue Million Forecast, by Technology 2019 & 2032
- Table 57: Global Green Technology Market Revenue Million Forecast, by Application 2019 & 2032
- Table 58: Global Green Technology Market Revenue Million Forecast, by Country 2019 & 2032
- Table 59: Global Green Technology Market Revenue Million Forecast, by Component 2019 & 2032
- Table 60: Global Green Technology Market Revenue Million Forecast, by Technology 2019 & 2032
- Table 61: Global Green Technology Market Revenue Million Forecast, by Application 2019 & 2032
- Table 62: Global Green Technology Market Revenue Million Forecast, by Country 2019 & 2032
- Table 63: Global Green Technology Market Revenue Million Forecast, by Component 2019 & 2032
- Table 64: Global Green Technology Market Revenue Million Forecast, by Technology 2019 & 2032
- Table 65: Global Green Technology Market Revenue Million Forecast, by Application 2019 & 2032
- Table 66: Global Green Technology Market Revenue Million Forecast, by Country 2019 & 2032
- Table 67: Global Green Technology Market Revenue Million Forecast, by Component 2019 & 2032
- Table 68: Global Green Technology Market Revenue Million Forecast, by Technology 2019 & 2032
- Table 69: Global Green Technology Market Revenue Million Forecast, by Application 2019 & 2032
- Table 70: Global Green Technology Market Revenue Million Forecast, by Country 2019 & 2032
- Table 71: Global Green Technology Market Revenue Million Forecast, by Component 2019 & 2032
- Table 72: Global Green Technology Market Revenue Million Forecast, by Technology 2019 & 2032
- Table 73: Global Green Technology Market Revenue Million Forecast, by Application 2019 & 2032
- Table 74: Global Green Technology Market Revenue Million Forecast, by Country 2019 & 2032
Frequently Asked Questions
1. What is the projected Compound Annual Growth Rate (CAGR) of the Green Technology Market?
The projected CAGR is approximately 24.30%.
2. Which companies are prominent players in the Green Technology Market?
Key companies in the market include Trace Genomics, General Electric, Engie Impact, Accuvio (Diligent Corporation), IBM Corporation, Microsoft Corporation, Sensus ( Xylem brand), Wolters Kluwer N V, Cropx inc, Oracle.
3. What are the main segments of the Green Technology Market?
The market segments include Component, Technology, Application.
4. Can you provide details about the market size?
The market size is estimated to be USD 29.47 Million as of 2022.
5. What are some drivers contributing to market growth?
Growth in Environment Concerns and Awarness; Growth in Government Initiatives for Low Carbon Policies..
6. What are the notable trends driving market growth?
Green Building is Expected to Drive the Market.
7. Are there any restraints impacting market growth?
High Product Cost; Lack of Government Regulations in Developing Nations.
8. Can you provide examples of recent developments in the market?
May 2023: Under a signed memorandum of understanding, the Advanced Research Projects Agency-Energy agreed to cooperate with the California Energy Commission to identify funding opportunities for green technology research and development. ARPA-E said the partnership would work toward achieving tech advancement goals such as energy cost reduction, grid modernization, and environmental mitigation. This collaboration will accelerate our critical work to research, develop, demonstrate, and ultimately deploy energy technologies.
9. What pricing options are available for accessing the report?
Pricing options include single-user, multi-user, and enterprise licenses priced at USD 4750, USD 5250, and USD 8750 respectively.
10. Is the market size provided in terms of value or volume?
The market size is provided in terms of value, measured in Million.
11. Are there any specific market keywords associated with the report?
Yes, the market keyword associated with the report is "Green Technology Market," which aids in identifying and referencing the specific market segment covered.
12. How do I determine which pricing option suits my needs best?
The pricing options vary based on user requirements and access needs. Individual users may opt for single-user licenses, while businesses requiring broader access may choose multi-user or enterprise licenses for cost-effective access to the report.
13. Are there any additional resources or data provided in the Green Technology Market report?
While the report offers comprehensive insights, it's advisable to review the specific contents or supplementary materials provided to ascertain if additional resources or data are available.
14. How can I stay updated on further developments or reports in the Green Technology Market?
To stay informed about further developments, trends, and reports in the Green Technology Market, consider subscribing to industry newsletters, following relevant companies and organizations, or regularly checking reputable industry news sources and publications.
Methodology
Step 1 - Identification of Relevant Samples Size from Population Database


Step 2 - Approaches for Defining Global Market Size (Value, Volume* & Price*)

Note*: In applicable scenarios
Step 3 - Data Sources
Primary Research
- Web Analytics
- Survey Reports
- Research Institute
- Latest Research Reports
- Opinion Leaders
Secondary Research
- Annual Reports
- White Paper
- Latest Press Release
- Industry Association
- Paid Database
- Investor Presentations

Step 4 - Data Triangulation
Involves using different sources of information in order to increase the validity of a study
These sources are likely to be stakeholders in a program - participants, other researchers, program staff, other community members, and so on.
Then we put all data in single framework & apply various statistical tools to find out the dynamic on the market.
During the analysis stage, feedback from the stakeholder groups would be compared to determine areas of agreement as well as areas of divergence


