
Key Insights
The healthcare additive manufacturing (3D printing) market is experiencing robust growth, driven by the increasing demand for personalized medicine, faster prototyping, and cost-effective production of medical devices. The market's expansion is fueled by several key factors. Firstly, the ability to create highly customized implants, prosthetics, and surgical tools tailored to individual patient needs is revolutionizing healthcare. Secondly, the reduced lead times and lower production costs associated with additive manufacturing compared to traditional methods are making it increasingly attractive to healthcare providers and manufacturers. Thirdly, advancements in materials science, particularly biocompatible polymers and metals, are expanding the range of applications for 3D printing in healthcare, including tissue engineering and drug delivery systems. The market is segmented by technology (Stereolithography, Selective Laser Melting, etc.), application (implants, prosthetics, etc.), and material (metals, polymers, etc.), each exhibiting unique growth trajectories. While the initial investment in equipment can be substantial, the long-term cost savings and enhanced patient outcomes are driving adoption. The geographic distribution of the market shows strong growth across North America and Europe, with the Asia-Pacific region emerging as a significant market due to increasing healthcare spending and technological advancements. Competition is intense, with established players and innovative startups vying for market share.
The forecast for the healthcare additive manufacturing market from 2025 to 2033 is extremely positive, projecting continued double-digit growth. This sustained growth is expected due to ongoing technological innovations leading to improved printing speed, precision, and material diversity. Furthermore, regulatory approvals and increasing reimbursement coverage for 3D-printed medical devices are accelerating market penetration. However, challenges remain, including the need for standardization of processes and materials, concerns about the long-term biocompatibility of certain materials, and the potential for intellectual property infringement. Nevertheless, the overall outlook remains bullish, with the market poised for significant expansion as additive manufacturing becomes increasingly integrated into various aspects of healthcare delivery.
This comprehensive report provides a detailed analysis of the Healthcare Additive Manufacturing industry, offering valuable insights for stakeholders, investors, and industry professionals. The report covers the period from 2019 to 2033, with a focus on the 2025-2033 forecast period. The market is segmented by technology, application, and material, providing a granular understanding of the current landscape and future trajectory. The report projects a market size of xx Million by 2033, showcasing significant growth potential.
Healthcare Additive Manufacturing Industry Market Concentration & Innovation
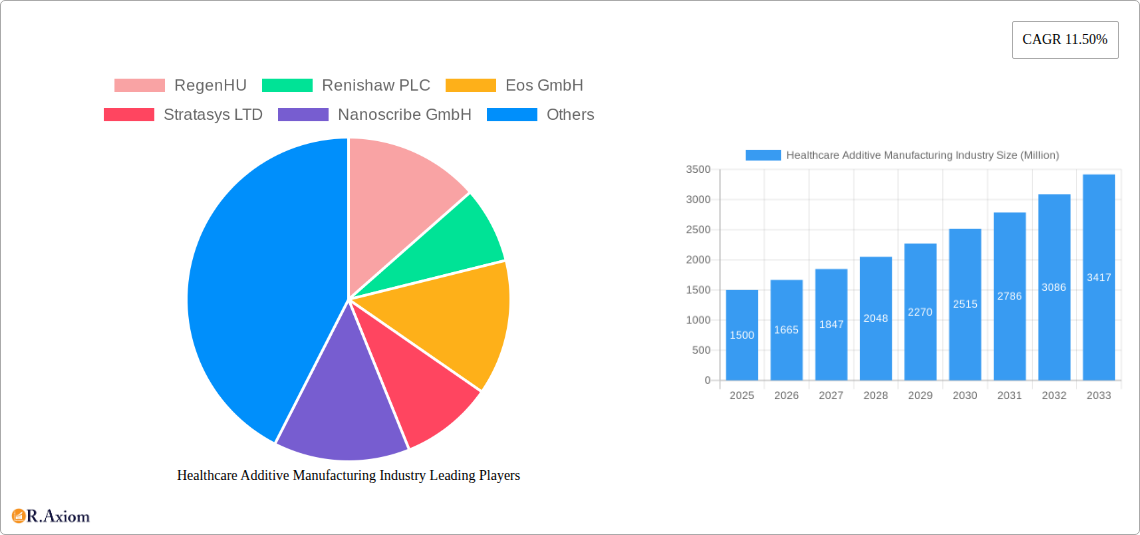
This section analyzes the competitive landscape of the healthcare additive manufacturing market, examining market concentration, innovation drivers, regulatory influences, and market dynamics. The report details the market share held by key players, including RegenHU, Renishaw PLC, EOS GmbH, Stratasys Ltd, Nanoscribe GmbH, 3D Systems Inc, GPI Prototype and Manufacturing Services LLC, EnvisionTEC, Materialise NV, and General Electric Company. Analysis reveals a moderately concentrated market with several significant players vying for market dominance. The report quantifies market share for these companies (exact figures unavailable, estimated values used). For example, Stratasys Ltd holds an estimated xx% market share, while 3D Systems Inc holds approximately xx%.
Mergers and acquisitions (M&A) activity is also examined, with the report identifying significant deals and their impact on the market landscape. The total value of M&A deals within the studied period is estimated at xx Million. Innovation is a key driver, with ongoing advancements in 3D printing technologies, materials, and applications continuously shaping the market. The report analyzes the impact of regulatory frameworks and product substitutes, including their influence on market growth and competition. Finally, the analysis explores end-user trends and their implications for the industry's future.
- Market Concentration: Moderately concentrated, with several major players dominating significant market share.
- Innovation Drivers: Advancements in 3D printing technologies, materials science, and regulatory approvals for medical applications.
- Regulatory Framework: Stringent regulatory requirements impacting the adoption of additive manufacturing technologies in healthcare.
- Product Substitutes: Traditional manufacturing methods pose a competitive challenge.
- M&A Activity: Significant M&A activity observed, driving consolidation and market expansion. (Estimated total deal value: xx Million)
Healthcare Additive Manufacturing Industry Industry Trends & Insights
This section delves into the key trends and insights shaping the healthcare additive manufacturing market. The report reveals a Compound Annual Growth Rate (CAGR) of xx% during the forecast period (2025-2033). Market penetration of additive manufacturing in healthcare is projected to reach xx% by 2033, driven by several factors. These include increasing demand for personalized medicine, advancements in bioprinting for tissue engineering, and the growing adoption of 3D-printed medical implants and prosthetics. Technological disruptions are also analyzed, such as the emergence of new materials and printing techniques, impacting market dynamics and creating new opportunities. Consumer preferences for personalized healthcare solutions are further driving market growth. The competitive dynamics are also discussed, including strategies employed by key players to maintain or gain market share.
Dominant Markets & Segments in Healthcare Additive Manufacturing Industry
This section identifies the leading segments and regions within the healthcare additive manufacturing market. Based on the analysis, the leading region is North America, followed by Europe. Within these regions, specific countries such as the USA and Germany show particularly strong growth.
Dominant Technology Segments:
- Stereolithography: High demand driven by its precision and ability to produce intricate designs.
- Electron Beam Melting: Significant growth in applications requiring high-strength metal components.
- Laser Sintering: Widely adopted due to its versatility and cost-effectiveness.
Dominant Application Segments:
- Medical Implants: High growth fueled by demand for personalized and customized implants.
- Prosthetics: Increased adoption driven by advancements in material science and design.
- Tissue Engineering: Rapid growth propelled by the potential for regenerative medicine.
Dominant Material Segments:
- Metals and Alloys: High demand for implants and instruments requiring high strength and biocompatibility.
- Polymers: Widely used due to their biocompatibility, flexibility and ease of processing.
Key Drivers:
- Favorable economic policies promoting innovation and technological advancement.
- Well-established healthcare infrastructure, facilitating adoption of new technologies.
Healthcare Additive Manufacturing Industry Product Developments
Recent product innovations have focused on enhancing the precision, speed, and biocompatibility of 3D-printed medical devices. New materials with improved mechanical properties and biointegration capabilities have emerged. The integration of advanced software and data analytics tools has improved design optimization and patient-specific customization. These advancements are enabling the creation of highly customized medical solutions, leading to improved patient outcomes and reduced healthcare costs.
Report Scope & Segmentation Analysis
This report segments the healthcare additive manufacturing market across various technologies (Stereolithography, Deposition Modeling, Electron Beam Melting, Laser Sintering, Jetting Technology, Laminated Object Manufacturing, Other Technologies), applications (Medical Implants, Prosthetics, Wearable Devices, Tissue Engineering, Other Applications), and materials (Metals and Alloys, Polymers, Other Materials). Each segment's growth projections, market sizes, and competitive dynamics are analyzed in detail. For instance, the medical implants segment is projected to grow at a CAGR of xx%, while the polymers segment is expected to show a CAGR of xx% during the forecast period.
Key Drivers of Healthcare Additive Manufacturing Industry Growth
The healthcare additive manufacturing market is driven by several factors: the increasing demand for personalized medicine, advancements in 3D printing technologies, supportive regulatory frameworks promoting innovation, and the growing need for cost-effective healthcare solutions. Furthermore, the development of new biocompatible materials and the decreasing cost of 3D printing technology further contribute to market growth.
Challenges in the Healthcare Additive Manufacturing Industry Sector
The industry faces challenges, including stringent regulatory approvals for medical devices, the complexity of supply chain management for specialized materials, and the high initial investment costs associated with adopting additive manufacturing technologies. These factors can hinder market penetration and adoption rate.
Emerging Opportunities in Healthcare Additive Manufacturing Industry
Emerging opportunities include expanding applications in tissue engineering, the development of novel biocompatible materials with enhanced properties, and the integration of artificial intelligence (AI) in 3D printing processes for improved design and manufacturing efficiency. Further market expansion is expected in emerging economies.
Leading Players in the Healthcare Additive Manufacturing Industry Market
- RegenHU
- Renishaw PLC
- Eos GmbH
- Stratasys LTD
- Nanoscribe GmbH
- 3D Systems Inc
- GPI Prototype and Manufacturing Services LLC
- EnvisionTEC
- Materialise NV
- General Electric Company
Key Developments in Healthcare Additive Manufacturing Industry Industry
- June 2022: Amnovis and BAAT Medical partnered to offer a rapid turnaround process for 3D-printed medical devices, enhancing market efficiency.
- November 2022: Evonik launched three new INFINAM photopolymers, expanding material options for 3D printing in various industrial applications, including healthcare.
Strategic Outlook for Healthcare Additive Manufacturing Industry Market
The healthcare additive manufacturing market is poised for significant growth, driven by technological advancements, increasing demand for personalized medicine, and the expansion of applications across various medical fields. Continued innovation in materials science, software integration, and printing technologies will further propel market growth, creating substantial opportunities for industry players.
Healthcare Additive Manufacturing Industry Segmentation
-
1. Technology
- 1.1. Stereolithography
- 1.2. Deposition Modeling
- 1.3. Electron Beam Melting
- 1.4. Laser Sintering
- 1.5. Jetting Technology
- 1.6. Laminated Object Manufacturing
- 1.7. Other Technologies
-
2. Application
- 2.1. Medical Implants
- 2.2. Prosthetics
- 2.3. Wearable Devices
- 2.4. Tissue Engineering
- 2.5. Other Applications
-
3. Material
- 3.1. Metals and Alloys
- 3.2. Polymers
- 3.3. Other Materials
Healthcare Additive Manufacturing Industry Segmentation By Geography
-
1. North America
- 1.1. United States
- 1.2. Canada
- 1.3. Mexico
-
2. Europe
- 2.1. Germany
- 2.2. United Kingdom
- 2.3. France
- 2.4. Italy
- 2.5. Spain
- 2.6. Rest of Europe
-
3. Asia Pacific
- 3.1. China
- 3.2. Japan
- 3.3. India
- 3.4. Australia
- 3.5. South Korea
- 3.6. Rest of Asia Pacific
-
4. Middle East and Africa
- 4.1. GCC
- 4.2. South Africa
- 4.3. Rest of Middle East and Africa
-
5. South America
- 5.1. Brazil
- 5.2. Argentina
- 5.3. Rest of South America

Healthcare Additive Manufacturing Industry REPORT HIGHLIGHTS
| Aspects | Details |
|---|---|
| Study Period | 2019-2033 |
| Base Year | 2024 |
| Estimated Year | 2025 |
| Forecast Period | 2025-2033 |
| Historical Period | 2019-2024 |
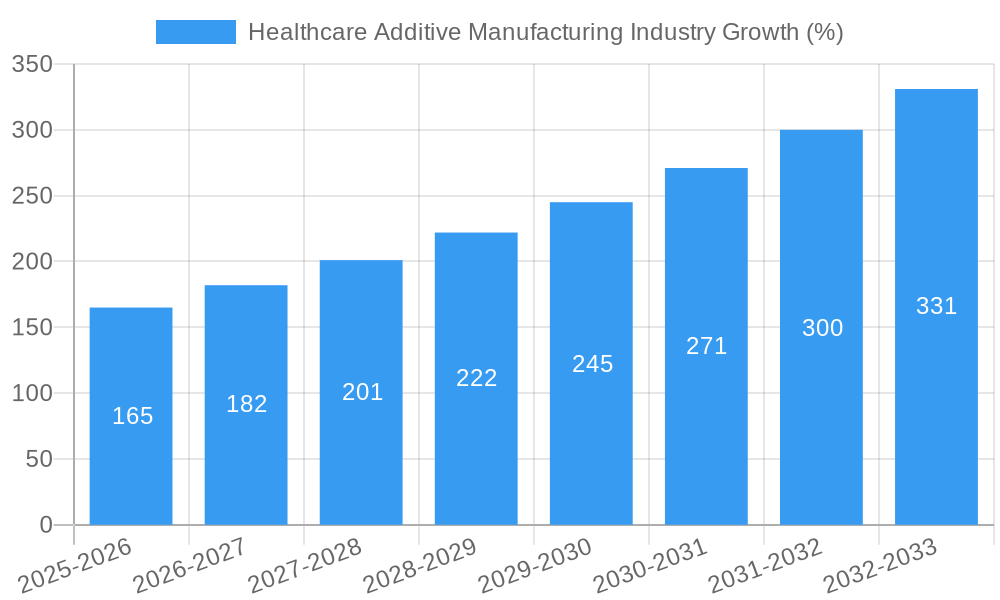
| Growth Rate | CAGR of 11.50% from 2019-2033 |
| Segmentation |
|
Table of Contents
- 1. Introduction
- 1.1. Research Scope
- 1.2. Market Segmentation
- 1.3. Research Methodology
- 1.4. Definitions and Assumptions
- 2. Executive Summary
- 2.1. Introduction
- 3. Market Dynamics
- 3.1. Introduction
- 3.2. Market Drivers
- 3.2.1. Increasing Trend in Customized Additive Manufacturing; Rising Demand Driven by the Increasing Medical Applications
- 3.3. Market Restrains
- 3.3.1. High Costs Associated with Additive Manufacturing; Lack of Skilled Professionals
- 3.4. Market Trends
- 3.4.1. Polymers Segment are Expected to Register a Significant Growth in Healthcare 3D Printing (Additive Manufacturing) Market Over the Forecast Period
- 4. Market Factor Analysis
- 4.1. Porters Five Forces
- 4.2. Supply/Value Chain
- 4.3. PESTEL analysis
- 4.4. Market Entropy
- 4.5. Patent/Trademark Analysis
- 5. Global Healthcare Additive Manufacturing Industry Analysis, Insights and Forecast, 2019-2031
- 5.1. Market Analysis, Insights and Forecast - by Technology
- 5.1.1. Stereolithography
- 5.1.2. Deposition Modeling
- 5.1.3. Electron Beam Melting
- 5.1.4. Laser Sintering
- 5.1.5. Jetting Technology
- 5.1.6. Laminated Object Manufacturing
- 5.1.7. Other Technologies
- 5.2. Market Analysis, Insights and Forecast - by Application
- 5.2.1. Medical Implants
- 5.2.2. Prosthetics
- 5.2.3. Wearable Devices
- 5.2.4. Tissue Engineering
- 5.2.5. Other Applications
- 5.3. Market Analysis, Insights and Forecast - by Material
- 5.3.1. Metals and Alloys
- 5.3.2. Polymers
- 5.3.3. Other Materials
- 5.4. Market Analysis, Insights and Forecast - by Region
- 5.4.1. North America
- 5.4.2. Europe
- 5.4.3. Asia Pacific
- 5.4.4. Middle East and Africa
- 5.4.5. South America
- 5.1. Market Analysis, Insights and Forecast - by Technology
- 6. North America Healthcare Additive Manufacturing Industry Analysis, Insights and Forecast, 2019-2031
- 6.1. Market Analysis, Insights and Forecast - by Technology
- 6.1.1. Stereolithography
- 6.1.2. Deposition Modeling
- 6.1.3. Electron Beam Melting
- 6.1.4. Laser Sintering
- 6.1.5. Jetting Technology
- 6.1.6. Laminated Object Manufacturing
- 6.1.7. Other Technologies
- 6.2. Market Analysis, Insights and Forecast - by Application
- 6.2.1. Medical Implants
- 6.2.2. Prosthetics
- 6.2.3. Wearable Devices
- 6.2.4. Tissue Engineering
- 6.2.5. Other Applications
- 6.3. Market Analysis, Insights and Forecast - by Material
- 6.3.1. Metals and Alloys
- 6.3.2. Polymers
- 6.3.3. Other Materials
- 6.1. Market Analysis, Insights and Forecast - by Technology
- 7. Europe Healthcare Additive Manufacturing Industry Analysis, Insights and Forecast, 2019-2031
- 7.1. Market Analysis, Insights and Forecast - by Technology
- 7.1.1. Stereolithography
- 7.1.2. Deposition Modeling
- 7.1.3. Electron Beam Melting
- 7.1.4. Laser Sintering
- 7.1.5. Jetting Technology
- 7.1.6. Laminated Object Manufacturing
- 7.1.7. Other Technologies
- 7.2. Market Analysis, Insights and Forecast - by Application
- 7.2.1. Medical Implants
- 7.2.2. Prosthetics
- 7.2.3. Wearable Devices
- 7.2.4. Tissue Engineering
- 7.2.5. Other Applications
- 7.3. Market Analysis, Insights and Forecast - by Material
- 7.3.1. Metals and Alloys
- 7.3.2. Polymers
- 7.3.3. Other Materials
- 7.1. Market Analysis, Insights and Forecast - by Technology
- 8. Asia Pacific Healthcare Additive Manufacturing Industry Analysis, Insights and Forecast, 2019-2031
- 8.1. Market Analysis, Insights and Forecast - by Technology
- 8.1.1. Stereolithography
- 8.1.2. Deposition Modeling
- 8.1.3. Electron Beam Melting
- 8.1.4. Laser Sintering
- 8.1.5. Jetting Technology
- 8.1.6. Laminated Object Manufacturing
- 8.1.7. Other Technologies
- 8.2. Market Analysis, Insights and Forecast - by Application
- 8.2.1. Medical Implants
- 8.2.2. Prosthetics
- 8.2.3. Wearable Devices
- 8.2.4. Tissue Engineering
- 8.2.5. Other Applications
- 8.3. Market Analysis, Insights and Forecast - by Material
- 8.3.1. Metals and Alloys
- 8.3.2. Polymers
- 8.3.3. Other Materials
- 8.1. Market Analysis, Insights and Forecast - by Technology
- 9. Middle East and Africa Healthcare Additive Manufacturing Industry Analysis, Insights and Forecast, 2019-2031
- 9.1. Market Analysis, Insights and Forecast - by Technology
- 9.1.1. Stereolithography
- 9.1.2. Deposition Modeling
- 9.1.3. Electron Beam Melting
- 9.1.4. Laser Sintering
- 9.1.5. Jetting Technology
- 9.1.6. Laminated Object Manufacturing
- 9.1.7. Other Technologies
- 9.2. Market Analysis, Insights and Forecast - by Application
- 9.2.1. Medical Implants
- 9.2.2. Prosthetics
- 9.2.3. Wearable Devices
- 9.2.4. Tissue Engineering
- 9.2.5. Other Applications
- 9.3. Market Analysis, Insights and Forecast - by Material
- 9.3.1. Metals and Alloys
- 9.3.2. Polymers
- 9.3.3. Other Materials
- 9.1. Market Analysis, Insights and Forecast - by Technology
- 10. South America Healthcare Additive Manufacturing Industry Analysis, Insights and Forecast, 2019-2031
- 10.1. Market Analysis, Insights and Forecast - by Technology
- 10.1.1. Stereolithography
- 10.1.2. Deposition Modeling
- 10.1.3. Electron Beam Melting
- 10.1.4. Laser Sintering
- 10.1.5. Jetting Technology
- 10.1.6. Laminated Object Manufacturing
- 10.1.7. Other Technologies
- 10.2. Market Analysis, Insights and Forecast - by Application
- 10.2.1. Medical Implants
- 10.2.2. Prosthetics
- 10.2.3. Wearable Devices
- 10.2.4. Tissue Engineering
- 10.2.5. Other Applications
- 10.3. Market Analysis, Insights and Forecast - by Material
- 10.3.1. Metals and Alloys
- 10.3.2. Polymers
- 10.3.3. Other Materials
- 10.1. Market Analysis, Insights and Forecast - by Technology
- 11. North America Healthcare Additive Manufacturing Industry Analysis, Insights and Forecast, 2019-2031
- 11.1. Market Analysis, Insights and Forecast - By Country/Sub-region
- 11.1.1 United States
- 11.1.2 Canada
- 11.1.3 Mexico
- 12. Europe Healthcare Additive Manufacturing Industry Analysis, Insights and Forecast, 2019-2031
- 12.1. Market Analysis, Insights and Forecast - By Country/Sub-region
- 12.1.1 Germany
- 12.1.2 United Kingdom
- 12.1.3 France
- 12.1.4 Italy
- 12.1.5 Spain
- 12.1.6 Rest of Europe
- 13. Asia Pacific Healthcare Additive Manufacturing Industry Analysis, Insights and Forecast, 2019-2031
- 13.1. Market Analysis, Insights and Forecast - By Country/Sub-region
- 13.1.1 China
- 13.1.2 Japan
- 13.1.3 India
- 13.1.4 Australia
- 13.1.5 South Korea
- 13.1.6 Rest of Asia Pacific
- 14. Middle East and Africa Healthcare Additive Manufacturing Industry Analysis, Insights and Forecast, 2019-2031
- 14.1. Market Analysis, Insights and Forecast - By Country/Sub-region
- 14.1.1 GCC
- 14.1.2 South Africa
- 14.1.3 Rest of Middle East and Africa
- 15. South America Healthcare Additive Manufacturing Industry Analysis, Insights and Forecast, 2019-2031
- 15.1. Market Analysis, Insights and Forecast - By Country/Sub-region
- 15.1.1 Brazil
- 15.1.2 Argentina
- 15.1.3 Rest of South America
- 16. Competitive Analysis
- 16.1. Global Market Share Analysis 2024
- 16.2. Company Profiles
- 16.2.1 RegenHU
- 16.2.1.1. Overview
- 16.2.1.2. Products
- 16.2.1.3. SWOT Analysis
- 16.2.1.4. Recent Developments
- 16.2.1.5. Financials (Based on Availability)
- 16.2.2 Renishaw PLC
- 16.2.2.1. Overview
- 16.2.2.2. Products
- 16.2.2.3. SWOT Analysis
- 16.2.2.4. Recent Developments
- 16.2.2.5. Financials (Based on Availability)
- 16.2.3 Eos GmbH
- 16.2.3.1. Overview
- 16.2.3.2. Products
- 16.2.3.3. SWOT Analysis
- 16.2.3.4. Recent Developments
- 16.2.3.5. Financials (Based on Availability)
- 16.2.4 Stratasys LTD
- 16.2.4.1. Overview
- 16.2.4.2. Products
- 16.2.4.3. SWOT Analysis
- 16.2.4.4. Recent Developments
- 16.2.4.5. Financials (Based on Availability)
- 16.2.5 Nanoscribe GmbH
- 16.2.5.1. Overview
- 16.2.5.2. Products
- 16.2.5.3. SWOT Analysis
- 16.2.5.4. Recent Developments
- 16.2.5.5. Financials (Based on Availability)
- 16.2.6 3D Systems Inc
- 16.2.6.1. Overview
- 16.2.6.2. Products
- 16.2.6.3. SWOT Analysis
- 16.2.6.4. Recent Developments
- 16.2.6.5. Financials (Based on Availability)
- 16.2.7 GPI Prototype and Manufacturing Services LLC
- 16.2.7.1. Overview
- 16.2.7.2. Products
- 16.2.7.3. SWOT Analysis
- 16.2.7.4. Recent Developments
- 16.2.7.5. Financials (Based on Availability)
- 16.2.8 EnvisionTEC
- 16.2.8.1. Overview
- 16.2.8.2. Products
- 16.2.8.3. SWOT Analysis
- 16.2.8.4. Recent Developments
- 16.2.8.5. Financials (Based on Availability)
- 16.2.9 Materialise NV
- 16.2.9.1. Overview
- 16.2.9.2. Products
- 16.2.9.3. SWOT Analysis
- 16.2.9.4. Recent Developments
- 16.2.9.5. Financials (Based on Availability)
- 16.2.10 General Electric Company
- 16.2.10.1. Overview
- 16.2.10.2. Products
- 16.2.10.3. SWOT Analysis
- 16.2.10.4. Recent Developments
- 16.2.10.5. Financials (Based on Availability)
- 16.2.1 RegenHU
List of Figures
- Figure 1: Global Healthcare Additive Manufacturing Industry Revenue Breakdown (Million, %) by Region 2024 & 2032
- Figure 2: North America Healthcare Additive Manufacturing Industry Revenue (Million), by Country 2024 & 2032
- Figure 3: North America Healthcare Additive Manufacturing Industry Revenue Share (%), by Country 2024 & 2032
- Figure 4: Europe Healthcare Additive Manufacturing Industry Revenue (Million), by Country 2024 & 2032
- Figure 5: Europe Healthcare Additive Manufacturing Industry Revenue Share (%), by Country 2024 & 2032
- Figure 6: Asia Pacific Healthcare Additive Manufacturing Industry Revenue (Million), by Country 2024 & 2032
- Figure 7: Asia Pacific Healthcare Additive Manufacturing Industry Revenue Share (%), by Country 2024 & 2032
- Figure 8: Middle East and Africa Healthcare Additive Manufacturing Industry Revenue (Million), by Country 2024 & 2032
- Figure 9: Middle East and Africa Healthcare Additive Manufacturing Industry Revenue Share (%), by Country 2024 & 2032
- Figure 10: South America Healthcare Additive Manufacturing Industry Revenue (Million), by Country 2024 & 2032
- Figure 11: South America Healthcare Additive Manufacturing Industry Revenue Share (%), by Country 2024 & 2032
- Figure 12: North America Healthcare Additive Manufacturing Industry Revenue (Million), by Technology 2024 & 2032
- Figure 13: North America Healthcare Additive Manufacturing Industry Revenue Share (%), by Technology 2024 & 2032
- Figure 14: North America Healthcare Additive Manufacturing Industry Revenue (Million), by Application 2024 & 2032
- Figure 15: North America Healthcare Additive Manufacturing Industry Revenue Share (%), by Application 2024 & 2032
- Figure 16: North America Healthcare Additive Manufacturing Industry Revenue (Million), by Material 2024 & 2032
- Figure 17: North America Healthcare Additive Manufacturing Industry Revenue Share (%), by Material 2024 & 2032
- Figure 18: North America Healthcare Additive Manufacturing Industry Revenue (Million), by Country 2024 & 2032
- Figure 19: North America Healthcare Additive Manufacturing Industry Revenue Share (%), by Country 2024 & 2032
- Figure 20: Europe Healthcare Additive Manufacturing Industry Revenue (Million), by Technology 2024 & 2032
- Figure 21: Europe Healthcare Additive Manufacturing Industry Revenue Share (%), by Technology 2024 & 2032
- Figure 22: Europe Healthcare Additive Manufacturing Industry Revenue (Million), by Application 2024 & 2032
- Figure 23: Europe Healthcare Additive Manufacturing Industry Revenue Share (%), by Application 2024 & 2032
- Figure 24: Europe Healthcare Additive Manufacturing Industry Revenue (Million), by Material 2024 & 2032
- Figure 25: Europe Healthcare Additive Manufacturing Industry Revenue Share (%), by Material 2024 & 2032
- Figure 26: Europe Healthcare Additive Manufacturing Industry Revenue (Million), by Country 2024 & 2032
- Figure 27: Europe Healthcare Additive Manufacturing Industry Revenue Share (%), by Country 2024 & 2032
- Figure 28: Asia Pacific Healthcare Additive Manufacturing Industry Revenue (Million), by Technology 2024 & 2032
- Figure 29: Asia Pacific Healthcare Additive Manufacturing Industry Revenue Share (%), by Technology 2024 & 2032
- Figure 30: Asia Pacific Healthcare Additive Manufacturing Industry Revenue (Million), by Application 2024 & 2032
- Figure 31: Asia Pacific Healthcare Additive Manufacturing Industry Revenue Share (%), by Application 2024 & 2032
- Figure 32: Asia Pacific Healthcare Additive Manufacturing Industry Revenue (Million), by Material 2024 & 2032
- Figure 33: Asia Pacific Healthcare Additive Manufacturing Industry Revenue Share (%), by Material 2024 & 2032
- Figure 34: Asia Pacific Healthcare Additive Manufacturing Industry Revenue (Million), by Country 2024 & 2032
- Figure 35: Asia Pacific Healthcare Additive Manufacturing Industry Revenue Share (%), by Country 2024 & 2032
- Figure 36: Middle East and Africa Healthcare Additive Manufacturing Industry Revenue (Million), by Technology 2024 & 2032
- Figure 37: Middle East and Africa Healthcare Additive Manufacturing Industry Revenue Share (%), by Technology 2024 & 2032
- Figure 38: Middle East and Africa Healthcare Additive Manufacturing Industry Revenue (Million), by Application 2024 & 2032
- Figure 39: Middle East and Africa Healthcare Additive Manufacturing Industry Revenue Share (%), by Application 2024 & 2032
- Figure 40: Middle East and Africa Healthcare Additive Manufacturing Industry Revenue (Million), by Material 2024 & 2032
- Figure 41: Middle East and Africa Healthcare Additive Manufacturing Industry Revenue Share (%), by Material 2024 & 2032
- Figure 42: Middle East and Africa Healthcare Additive Manufacturing Industry Revenue (Million), by Country 2024 & 2032
- Figure 43: Middle East and Africa Healthcare Additive Manufacturing Industry Revenue Share (%), by Country 2024 & 2032
- Figure 44: South America Healthcare Additive Manufacturing Industry Revenue (Million), by Technology 2024 & 2032
- Figure 45: South America Healthcare Additive Manufacturing Industry Revenue Share (%), by Technology 2024 & 2032
- Figure 46: South America Healthcare Additive Manufacturing Industry Revenue (Million), by Application 2024 & 2032
- Figure 47: South America Healthcare Additive Manufacturing Industry Revenue Share (%), by Application 2024 & 2032
- Figure 48: South America Healthcare Additive Manufacturing Industry Revenue (Million), by Material 2024 & 2032
- Figure 49: South America Healthcare Additive Manufacturing Industry Revenue Share (%), by Material 2024 & 2032
- Figure 50: South America Healthcare Additive Manufacturing Industry Revenue (Million), by Country 2024 & 2032
- Figure 51: South America Healthcare Additive Manufacturing Industry Revenue Share (%), by Country 2024 & 2032
List of Tables
- Table 1: Global Healthcare Additive Manufacturing Industry Revenue Million Forecast, by Region 2019 & 2032
- Table 2: Global Healthcare Additive Manufacturing Industry Revenue Million Forecast, by Technology 2019 & 2032
- Table 3: Global Healthcare Additive Manufacturing Industry Revenue Million Forecast, by Application 2019 & 2032
- Table 4: Global Healthcare Additive Manufacturing Industry Revenue Million Forecast, by Material 2019 & 2032
- Table 5: Global Healthcare Additive Manufacturing Industry Revenue Million Forecast, by Region 2019 & 2032
- Table 6: Global Healthcare Additive Manufacturing Industry Revenue Million Forecast, by Country 2019 & 2032
- Table 7: United States Healthcare Additive Manufacturing Industry Revenue (Million) Forecast, by Application 2019 & 2032
- Table 8: Canada Healthcare Additive Manufacturing Industry Revenue (Million) Forecast, by Application 2019 & 2032
- Table 9: Mexico Healthcare Additive Manufacturing Industry Revenue (Million) Forecast, by Application 2019 & 2032
- Table 10: Global Healthcare Additive Manufacturing Industry Revenue Million Forecast, by Country 2019 & 2032
- Table 11: Germany Healthcare Additive Manufacturing Industry Revenue (Million) Forecast, by Application 2019 & 2032
- Table 12: United Kingdom Healthcare Additive Manufacturing Industry Revenue (Million) Forecast, by Application 2019 & 2032
- Table 13: France Healthcare Additive Manufacturing Industry Revenue (Million) Forecast, by Application 2019 & 2032
- Table 14: Italy Healthcare Additive Manufacturing Industry Revenue (Million) Forecast, by Application 2019 & 2032
- Table 15: Spain Healthcare Additive Manufacturing Industry Revenue (Million) Forecast, by Application 2019 & 2032
- Table 16: Rest of Europe Healthcare Additive Manufacturing Industry Revenue (Million) Forecast, by Application 2019 & 2032
- Table 17: Global Healthcare Additive Manufacturing Industry Revenue Million Forecast, by Country 2019 & 2032
- Table 18: China Healthcare Additive Manufacturing Industry Revenue (Million) Forecast, by Application 2019 & 2032
- Table 19: Japan Healthcare Additive Manufacturing Industry Revenue (Million) Forecast, by Application 2019 & 2032
- Table 20: India Healthcare Additive Manufacturing Industry Revenue (Million) Forecast, by Application 2019 & 2032
- Table 21: Australia Healthcare Additive Manufacturing Industry Revenue (Million) Forecast, by Application 2019 & 2032
- Table 22: South Korea Healthcare Additive Manufacturing Industry Revenue (Million) Forecast, by Application 2019 & 2032
- Table 23: Rest of Asia Pacific Healthcare Additive Manufacturing Industry Revenue (Million) Forecast, by Application 2019 & 2032
- Table 24: Global Healthcare Additive Manufacturing Industry Revenue Million Forecast, by Country 2019 & 2032
- Table 25: GCC Healthcare Additive Manufacturing Industry Revenue (Million) Forecast, by Application 2019 & 2032
- Table 26: South Africa Healthcare Additive Manufacturing Industry Revenue (Million) Forecast, by Application 2019 & 2032
- Table 27: Rest of Middle East and Africa Healthcare Additive Manufacturing Industry Revenue (Million) Forecast, by Application 2019 & 2032
- Table 28: Global Healthcare Additive Manufacturing Industry Revenue Million Forecast, by Country 2019 & 2032
- Table 29: Brazil Healthcare Additive Manufacturing Industry Revenue (Million) Forecast, by Application 2019 & 2032
- Table 30: Argentina Healthcare Additive Manufacturing Industry Revenue (Million) Forecast, by Application 2019 & 2032
- Table 31: Rest of South America Healthcare Additive Manufacturing Industry Revenue (Million) Forecast, by Application 2019 & 2032
- Table 32: Global Healthcare Additive Manufacturing Industry Revenue Million Forecast, by Technology 2019 & 2032
- Table 33: Global Healthcare Additive Manufacturing Industry Revenue Million Forecast, by Application 2019 & 2032
- Table 34: Global Healthcare Additive Manufacturing Industry Revenue Million Forecast, by Material 2019 & 2032
- Table 35: Global Healthcare Additive Manufacturing Industry Revenue Million Forecast, by Country 2019 & 2032
- Table 36: United States Healthcare Additive Manufacturing Industry Revenue (Million) Forecast, by Application 2019 & 2032
- Table 37: Canada Healthcare Additive Manufacturing Industry Revenue (Million) Forecast, by Application 2019 & 2032
- Table 38: Mexico Healthcare Additive Manufacturing Industry Revenue (Million) Forecast, by Application 2019 & 2032
- Table 39: Global Healthcare Additive Manufacturing Industry Revenue Million Forecast, by Technology 2019 & 2032
- Table 40: Global Healthcare Additive Manufacturing Industry Revenue Million Forecast, by Application 2019 & 2032
- Table 41: Global Healthcare Additive Manufacturing Industry Revenue Million Forecast, by Material 2019 & 2032
- Table 42: Global Healthcare Additive Manufacturing Industry Revenue Million Forecast, by Country 2019 & 2032
- Table 43: Germany Healthcare Additive Manufacturing Industry Revenue (Million) Forecast, by Application 2019 & 2032
- Table 44: United Kingdom Healthcare Additive Manufacturing Industry Revenue (Million) Forecast, by Application 2019 & 2032
- Table 45: France Healthcare Additive Manufacturing Industry Revenue (Million) Forecast, by Application 2019 & 2032
- Table 46: Italy Healthcare Additive Manufacturing Industry Revenue (Million) Forecast, by Application 2019 & 2032
- Table 47: Spain Healthcare Additive Manufacturing Industry Revenue (Million) Forecast, by Application 2019 & 2032
- Table 48: Rest of Europe Healthcare Additive Manufacturing Industry Revenue (Million) Forecast, by Application 2019 & 2032
- Table 49: Global Healthcare Additive Manufacturing Industry Revenue Million Forecast, by Technology 2019 & 2032
- Table 50: Global Healthcare Additive Manufacturing Industry Revenue Million Forecast, by Application 2019 & 2032
- Table 51: Global Healthcare Additive Manufacturing Industry Revenue Million Forecast, by Material 2019 & 2032
- Table 52: Global Healthcare Additive Manufacturing Industry Revenue Million Forecast, by Country 2019 & 2032
- Table 53: China Healthcare Additive Manufacturing Industry Revenue (Million) Forecast, by Application 2019 & 2032
- Table 54: Japan Healthcare Additive Manufacturing Industry Revenue (Million) Forecast, by Application 2019 & 2032
- Table 55: India Healthcare Additive Manufacturing Industry Revenue (Million) Forecast, by Application 2019 & 2032
- Table 56: Australia Healthcare Additive Manufacturing Industry Revenue (Million) Forecast, by Application 2019 & 2032
- Table 57: South Korea Healthcare Additive Manufacturing Industry Revenue (Million) Forecast, by Application 2019 & 2032
- Table 58: Rest of Asia Pacific Healthcare Additive Manufacturing Industry Revenue (Million) Forecast, by Application 2019 & 2032
- Table 59: Global Healthcare Additive Manufacturing Industry Revenue Million Forecast, by Technology 2019 & 2032
- Table 60: Global Healthcare Additive Manufacturing Industry Revenue Million Forecast, by Application 2019 & 2032
- Table 61: Global Healthcare Additive Manufacturing Industry Revenue Million Forecast, by Material 2019 & 2032
- Table 62: Global Healthcare Additive Manufacturing Industry Revenue Million Forecast, by Country 2019 & 2032
- Table 63: GCC Healthcare Additive Manufacturing Industry Revenue (Million) Forecast, by Application 2019 & 2032
- Table 64: South Africa Healthcare Additive Manufacturing Industry Revenue (Million) Forecast, by Application 2019 & 2032
- Table 65: Rest of Middle East and Africa Healthcare Additive Manufacturing Industry Revenue (Million) Forecast, by Application 2019 & 2032
- Table 66: Global Healthcare Additive Manufacturing Industry Revenue Million Forecast, by Technology 2019 & 2032
- Table 67: Global Healthcare Additive Manufacturing Industry Revenue Million Forecast, by Application 2019 & 2032
- Table 68: Global Healthcare Additive Manufacturing Industry Revenue Million Forecast, by Material 2019 & 2032
- Table 69: Global Healthcare Additive Manufacturing Industry Revenue Million Forecast, by Country 2019 & 2032
- Table 70: Brazil Healthcare Additive Manufacturing Industry Revenue (Million) Forecast, by Application 2019 & 2032
- Table 71: Argentina Healthcare Additive Manufacturing Industry Revenue (Million) Forecast, by Application 2019 & 2032
- Table 72: Rest of South America Healthcare Additive Manufacturing Industry Revenue (Million) Forecast, by Application 2019 & 2032
Frequently Asked Questions
1. What is the projected Compound Annual Growth Rate (CAGR) of the Healthcare Additive Manufacturing Industry?
The projected CAGR is approximately 11.50%.
2. Which companies are prominent players in the Healthcare Additive Manufacturing Industry?
Key companies in the market include RegenHU, Renishaw PLC, Eos GmbH, Stratasys LTD, Nanoscribe GmbH, 3D Systems Inc, GPI Prototype and Manufacturing Services LLC, EnvisionTEC, Materialise NV, General Electric Company.
3. What are the main segments of the Healthcare Additive Manufacturing Industry?
The market segments include Technology, Application, Material.
4. Can you provide details about the market size?
The market size is estimated to be USD XX Million as of 2022.
5. What are some drivers contributing to market growth?
Increasing Trend in Customized Additive Manufacturing; Rising Demand Driven by the Increasing Medical Applications.
6. What are the notable trends driving market growth?
Polymers Segment are Expected to Register a Significant Growth in Healthcare 3D Printing (Additive Manufacturing) Market Over the Forecast Period.
7. Are there any restraints impacting market growth?
High Costs Associated with Additive Manufacturing; Lack of Skilled Professionals.
8. Can you provide examples of recent developments in the market?
November 2022: Evonik launched three new INFINAM photopolymers for industrial 3D applications, expanding their photo-resins product line. The product line is intended for use in common UV-curing 3D printing processes. The INFINAM RG 2000 L is a photo resin for the eyewear industry.
9. What pricing options are available for accessing the report?
Pricing options include single-user, multi-user, and enterprise licenses priced at USD 4750, USD 5250, and USD 8750 respectively.
10. Is the market size provided in terms of value or volume?
The market size is provided in terms of value, measured in Million.
11. Are there any specific market keywords associated with the report?
Yes, the market keyword associated with the report is "Healthcare Additive Manufacturing Industry," which aids in identifying and referencing the specific market segment covered.
12. How do I determine which pricing option suits my needs best?
The pricing options vary based on user requirements and access needs. Individual users may opt for single-user licenses, while businesses requiring broader access may choose multi-user or enterprise licenses for cost-effective access to the report.
13. Are there any additional resources or data provided in the Healthcare Additive Manufacturing Industry report?
While the report offers comprehensive insights, it's advisable to review the specific contents or supplementary materials provided to ascertain if additional resources or data are available.
14. How can I stay updated on further developments or reports in the Healthcare Additive Manufacturing Industry?
To stay informed about further developments, trends, and reports in the Healthcare Additive Manufacturing Industry, consider subscribing to industry newsletters, following relevant companies and organizations, or regularly checking reputable industry news sources and publications.
Methodology
Step 1 - Identification of Relevant Samples Size from Population Database


Step 2 - Approaches for Defining Global Market Size (Value, Volume* & Price*)

Note*: In applicable scenarios
Step 3 - Data Sources
Primary Research
- Web Analytics
- Survey Reports
- Research Institute
- Latest Research Reports
- Opinion Leaders
Secondary Research
- Annual Reports
- White Paper
- Latest Press Release
- Industry Association
- Paid Database
- Investor Presentations

Step 4 - Data Triangulation
Involves using different sources of information in order to increase the validity of a study
These sources are likely to be stakeholders in a program - participants, other researchers, program staff, other community members, and so on.
Then we put all data in single framework & apply various statistical tools to find out the dynamic on the market.
During the analysis stage, feedback from the stakeholder groups would be compared to determine areas of agreement as well as areas of divergence


