

Key Insights
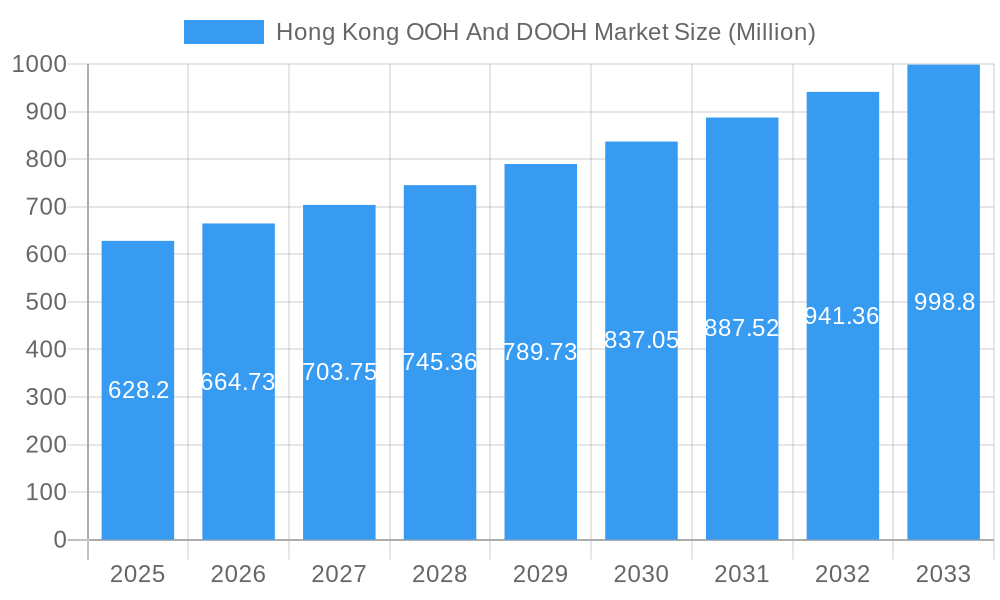
The Hong Kong Out-of-Home (OOH) and Digital Out-of-Home (DOOH) advertising market presents a compelling investment opportunity, projected to reach a market size of $628.20 million in 2025 and maintain a robust Compound Annual Growth Rate (CAGR) of 5.63% from 2025 to 2033. This growth is fueled by several key drivers. Firstly, the increasing adoption of DOOH technologies offers advertisers greater targeting capabilities and measurable results, leading to increased investment. Secondly, Hong Kong's dense urban environment and high foot traffic create a highly receptive audience for OOH advertising. Thirdly, the city's robust tourism sector contributes significantly to the market's growth, as outdoor advertising remains a prominent way to reach international visitors. Finally, innovative advertising formats, including interactive displays and programmatic buying, are further enhancing the appeal and effectiveness of OOH and DOOH campaigns. The market's growth, however, faces certain restraints, including the relatively high cost of implementing DOOH infrastructure and competition from other digital advertising channels.
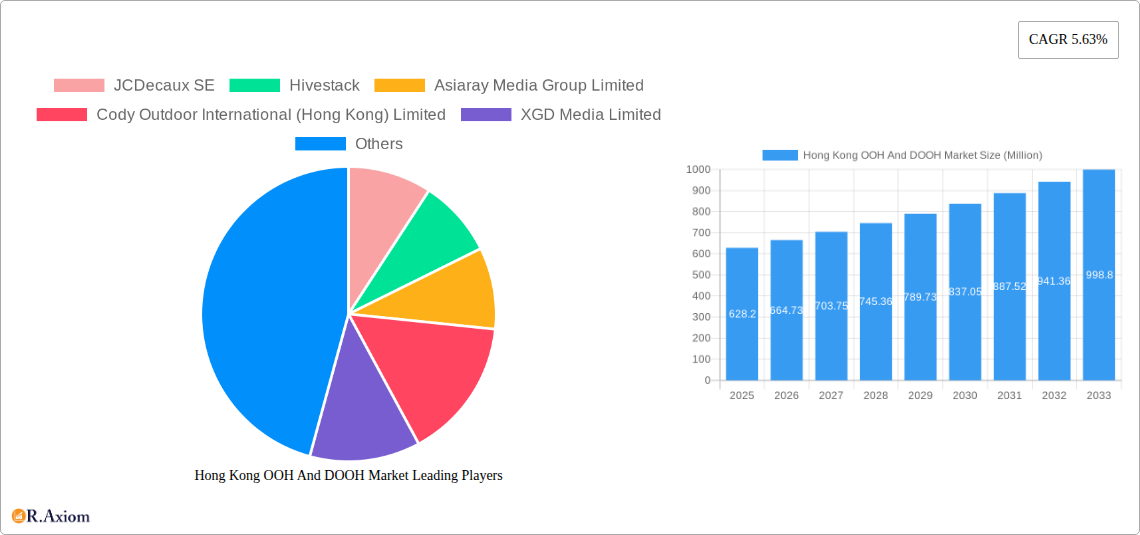
Hong Kong OOH And DOOH Market Market Size (In Million)
Despite these challenges, the market is segmented into various formats, including billboards, transit advertising, street furniture, and digital screens located in malls, airports, and other high-traffic areas. Major players such as JCDecaux SE, Hivestack, and Asiaray Media Group Limited are actively shaping the market landscape through strategic partnerships, technological advancements, and expansion initiatives. The competitive landscape is characterized by a mix of large multinational companies and smaller, specialized agencies, highlighting the market's dynamism and potential for further consolidation. The forecast period indicates continued growth, driven by the ongoing digital transformation of the OOH sector and increasing advertiser demand for data-driven, targeted campaigns. While specific regional breakdowns within Hong Kong are not provided, the overall market trends suggest significant growth opportunities for businesses operating in this dynamic sector.
Hong Kong OOH And DOOH Market Company Market Share
This detailed report provides a comprehensive analysis of the Hong Kong Out-of-Home (OOH) and Digital Out-of-Home (DOOH) advertising market, covering the period from 2019 to 2033. It offers in-depth insights into market size, growth drivers, key players, emerging trends, and future opportunities, equipping stakeholders with actionable intelligence for strategic decision-making. The report's base year is 2025, with forecasts extending to 2033.
Hong Kong OOH And DOOH Market Market Concentration & Innovation
This section analyzes the competitive landscape of the Hong Kong OOH and DOOH market, encompassing market concentration, innovation drivers, regulatory frameworks, product substitutes, end-user trends, and mergers and acquisitions (M&A) activities. The Hong Kong OOH market shows moderate concentration, with a few major players holding significant market share. JCDecaux SE and Asiaray Media Group Limited are among the dominant players, though exact market share figures are proprietary and vary depending on the segment. Smaller players like Cody Outdoor International (Hong Kong) Limited, XGD Media Limited and POADmedia Limited compete fiercely, especially in niche segments. The DOOH segment shows higher dynamism with the entry of technology-driven companies like Hivestack, VIOOH, and Vistar Media.
Innovation Drivers: Technological advancements, particularly in programmatic DOOH and data analytics, are driving innovation. The increasing use of smart city infrastructure and the adoption of 5G technology further contribute.
Regulatory Framework: Government regulations concerning advertising standards, permits, and placement of OOH media influence market dynamics. Changes in these regulations may present both opportunities and challenges to market players.
Product Substitutes: Digital advertising channels, such as online video and social media, present competition. However, the unique visibility and impact of OOH advertising maintain its relevance.
End-User Trends: Businesses are increasingly focusing on data-driven OOH strategies to improve targeting and ROI. Consumer preferences are shifting towards interactive and engaging DOOH formats.
M&A Activities: The past five years have seen xx Million in M&A activity in the Hong Kong OOH and DOOH sector, primarily focused on consolidation and expansion into digital formats. Details on specific deals are limited due to confidentiality.
Hong Kong OOH And DOOH Market Industry Trends & Insights
The Hong Kong Out-of-Home (OOH) and Digital Out-of-Home (DOOH) market is experiencing a period of robust expansion, driven by a confluence of strategic investments and evolving consumer behaviors. During the historical period from 2019 to 2024, the market demonstrated a Compound Annual Growth Rate (CAGR) of approximately [Insert Historical CAGR % here], reaching an estimated valuation of [Insert Historical Market Value Million here] Million in 2024. Projections for the forecast period, spanning 2025 to 2033, indicate a sustained and accelerated CAGR of [Insert Forecast CAGR % here], with the market anticipated to reach a substantial [Insert Forecast Market Value Million here] Million by 2033.
This upward trajectory is significantly propelled by escalating investments in advanced DOOH infrastructure, a burgeoning adoption of programmatic buying strategies that enhance efficiency and targeting, and an increasing demand for sophisticated, data-driven advertising solutions. While DOOH's market penetration is still growing relative to traditional OOH, this presents a considerable runway for future development. Consumer preferences are demonstrably shifting towards more engaging, interactive, and visually stimulating digital formats, acting as a primary catalyst for DOOH's expansion. The competitive arena is characterized by its dynamism, featuring a healthy mix of established industry leaders and innovative new entrants actively vying for dominant market share. Furthermore, disruptive technological advancements, particularly in areas such as AI-powered ad optimization for real-time performance adjustments and seamless integration of real-time data analytics, are fundamentally reshaping the industry's operational paradigms and strategic approaches. Concurrently, sustained economic growth within Hong Kong and a resurgence in tourism further bolster positive market momentum, creating a fertile ground for OOH and DOOH advertising success.
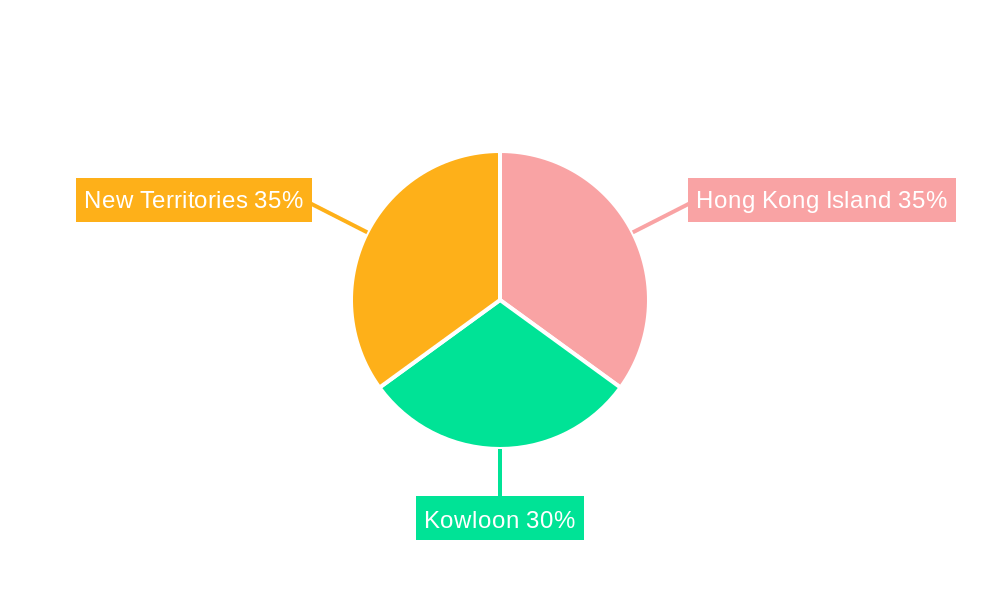
Dominant Markets & Segments in Hong Kong OOH And DOOH Market
The Hong Kong OOH and DOOH market is largely concentrated in urban areas with high foot traffic and visibility. Specific regional dominance is difficult to pinpoint without proprietary data, but areas such as Central, Causeway Bay, and Tsim Sha Tsui command premium pricing due to their high concentration of consumers and businesses.
- Key Drivers of Regional Dominance:
- High population density
- Significant consumer spending
- Extensive public transportation networks
- Robust tourism sector
- Concentration of businesses and commercial activity
The market is segmented by format (billboards, transit advertising, street furniture, etc.) and by advertising type (static vs. dynamic/digital). DOOH is experiencing accelerated growth compared to traditional OOH, due to its advanced targeting capabilities and enhanced engagement potential.
Hong Kong OOH And DOOH Market Product Developments
Recent product innovations focus on enhancing the interactivity and data-driven capabilities of DOOH displays. This includes the incorporation of augmented reality (AR) experiences, interactive touchscreens, and advanced analytics platforms to measure campaign effectiveness. The trend is toward programmatically-bought DOOH inventory, allowing for increased efficiency and targeting precision. These developments better address the needs of advertisers seeking measurable ROI and engaging consumer interactions.
Report Scope & Segmentation Analysis
This comprehensive report meticulously segments the Hong Kong OOH and DOOH market across key dimensions, including Format (e.g., billboards, transit advertising, street furniture, digital displays), Location (urban centers, suburban areas, and rural settings), and Advertiser Type (spanning sectors like retail, Fast-Moving Consumer Goods (FMCG), entertainment, and more). Each identified segment undergoes rigorous analysis, evaluating its current market size, anticipated future growth trajectories, and the prevailing competitive dynamics. While specific detailed growth figures for each sub-segment are considered proprietary, the overarching trend clearly indicates robust and accelerated growth, particularly within the DOOH sector across all analyzed segments.
Key Drivers of Hong Kong OOH And DOOH Market Growth
Several key factors drive growth within this market. Firstly, advancements in digital technology, including programmatic DOOH platforms, improve ad targeting and measurement. Secondly, the increasing popularity of interactive DOOH formats leads to enhanced consumer engagement and brand recall. Thirdly, robust economic growth within Hong Kong boosts advertising expenditure across various sectors. Lastly, supportive government policies that promote infrastructure development and smart city initiatives further expand market opportunities.
Challenges in the Hong Kong OOH And DOOH Market Sector
Despite the positive outlook, several challenges persist. The limited availability of premium ad spaces in high-traffic locations restricts growth. Furthermore, the high cost of DOOH infrastructure installation and maintenance acts as a barrier to entry for smaller players. Competition from other advertising channels, particularly digital media, also poses a significant challenge. The fragmented nature of the OOH industry, with numerous small to medium-sized players, can present complications for standardization and industry-wide data sharing.
Emerging Opportunities in Hong Kong OOH And DOOH Market
The Hong Kong OOH and DOOH market is ripe with compelling opportunities for innovation and expansion. A key area of growth lies in extending DOOH's reach into smaller, historically underserved geographic areas, thereby broadening advertising footprints. Technological advancements are pivotal, with AI-powered ad optimization offering unprecedented efficiency by dynamically adjusting campaigns based on real-time performance metrics. Coupled with sophisticated location-based targeting, these technologies enable advertisers to deliver highly relevant messages to precisely defined audiences. The strategic integration of DOOH platforms with mobile technologies opens up novel engagement pathways for consumers and provides advertisers with enhanced capabilities for detailed campaign measurement and attribution. Beyond technological integration, the exploration of novel advertising formats and creative applications holds significant potential to unlock untapped market value and captivate audiences in unique ways.
Leading Players in the Hong Kong OOH And DOOH Market Market
- JCDecaux SE
- Hivestack
- Asiaray Media Group Limited
- Cody Outdoor International (Hong Kong) Limited
- XGD Media Limited
- Dentsu
- POADmedia Limited
- VIOOH
- Vistar Media
- Displayforce *List Not Exhaustive
Key Developments in Hong Kong OOH And DOOH Market Industry
- September 2023: KFC Hong Kong collaborated with Edelman Hong Kong to execute a high-impact, city-wide billboard campaign for its "FING FING Cajun Chips" product launch. This initiative effectively underscored the power and broad reach of traditional OOH advertising in driving brand awareness and product visibility during critical launch phases.
- January 2024: Bravo Media achieved a significant milestone by securing a major contract for the installation of new digital pillar zones within the MTR East Tsim Sha Tsui station. Additionally, they deployed a dynamic digital impact zone at the Admiralty station. These strategic installations highlight the escalating demand and continued investment in advanced DOOH infrastructure to enhance passenger experience and advertising effectiveness within key transportation hubs.
Strategic Outlook for Hong Kong OOH And DOOH Market Market
The strategic outlook for the Hong Kong OOH and DOOH market is exceptionally promising, underpinned by a powerful combination of accelerating technological innovation, increasing digital adoption by advertisers and consumers alike, and a resilient economic environment coupled with a steady influx of tourism. The ongoing expansion of DOOH, particularly the sophisticated integration of programmatic DOOH, presents advertisers with unparalleled opportunities to reach highly targeted audiences through engaging, contextually relevant, and data-informed campaigns. The market's sustained growth and future success will hinge on effectively addressing critical challenges, including the ongoing need for infrastructure development and upgrades, navigating the complexities of data privacy regulations and consumer trust, and managing the competitive pressures from other burgeoning advertising channels. Consequently, fostering strategic partnerships, embracing pioneering technological advancements, and maintaining an unwavering focus on data-driven strategies will be indispensable for stakeholders aiming to achieve and sustain success within this dynamic and rapidly evolving market landscape.
Hong Kong OOH And DOOH Market Segmentation
-
1. Type
- 1.1. Static (Traditional) OOH
-
1.2. Digital OOH (LED Screens)
- 1.2.1. Programmatic OOH
- 1.2.2. Others
-
2. Appli
- 2.1. Billboard
-
2.2. Transportation (Transit)
- 2.2.1. Airports
- 2.2.2. Others (Buses, etc.)
- 2.3. Street Furniture
- 2.4. Other Place-Based Media
-
3. End-U
- 3.1. Automotive
- 3.2. Retail and Consumer Goods
- 3.3. Healthcare
- 3.4. BFSI
- 3.5. Other End Users
Hong Kong OOH And DOOH Market Segmentation By Geography
-
1. North America
- 1.1. United States
- 1.2. Canada
- 1.3. Mexico
-
2. South America
- 2.1. Brazil
- 2.2. Argentina
- 2.3. Rest of South America
-
3. Europe
- 3.1. United Kingdom
- 3.2. Germany
- 3.3. France
- 3.4. Italy
- 3.5. Spain
- 3.6. Russia
- 3.7. Benelux
- 3.8. Nordics
- 3.9. Rest of Europe
-
4. Middle East & Africa
- 4.1. Turkey
- 4.2. Israel
- 4.3. GCC
- 4.4. North Africa
- 4.5. South Africa
- 4.6. Rest of Middle East & Africa
-
5. Asia Pacific
- 5.1. China
- 5.2. India
- 5.3. Japan
- 5.4. South Korea
- 5.5. ASEAN
- 5.6. Oceania
- 5.7. Rest of Asia Pacific
Hong Kong OOH And DOOH Market Regional Market Share
Geographic Coverage of Hong Kong OOH And DOOH Market
Hong Kong OOH And DOOH Market REPORT HIGHLIGHTS
| Aspects | Details |
|---|---|
| Study Period | 2020-2034 |
| Base Year | 2025 |
| Estimated Year | 2026 |
| Forecast Period | 2026-2034 |
| Historical Period | 2020-2025 |
| Growth Rate | CAGR of 5.63% from 2020-2034 |
| Segmentation |
|
Table of Contents
- 1. Introduction
- 1.1. Research Scope
- 1.2. Market Segmentation
- 1.3. Research Objective
- 1.4. Definitions and Assumptions
- 2. Executive Summary
- 2.1. Market Snapshot
- 3. Market Dynamics
- 3.1. Market Drivers
- 3.2. Market Restrains
- 3.3. Market Trends
- 3.4. Market Opportunities
- 4. Market Factor Analysis
- 4.1. Porters Five Forces
- 4.1.1. Bargaining Power of Suppliers
- 4.1.2. Bargaining Power of Buyers
- 4.1.3. Threat of New Entrants
- 4.1.4. Threat of Substitutes
- 4.1.5. Competitive Rivalry
- 4.2. PESTEL analysis
- 4.3. BCG Analysis
- 4.3.1. Stars (High Growth, High Market Share)
- 4.3.2. Cash Cows (Low Growth, High Market Share)
- 4.3.3. Question Mark (High Growth, Low Market Share)
- 4.3.4. Dogs (Low Growth, Low Market Share)
- 4.4. Ansoff Matrix Analysis
- 4.5. Supply Chain Analysis
- 4.6. Regulatory Landscape
- 4.7. Current Market Potential and Opportunity Assessment (TAM–SAM–SOM Framework)
- 4.8. RAX Analyst Note
- 4.1. Porters Five Forces
- 5. Market Analysis, Insights and Forecast 2021-2033
- 5.1. Market Analysis, Insights and Forecast - by Type
- 5.1.1. Static (Traditional) OOH
- 5.1.2. Digital OOH (LED Screens)
- 5.1.2.1. Programmatic OOH
- 5.1.2.2. Others
- 5.2. Market Analysis, Insights and Forecast - by Appli
- 5.2.1. Billboard
- 5.2.2. Transportation (Transit)
- 5.2.2.1. Airports
- 5.2.2.2. Others (Buses, etc.)
- 5.2.3. Street Furniture
- 5.2.4. Other Place-Based Media
- 5.3. Market Analysis, Insights and Forecast - by End-U
- 5.3.1. Automotive
- 5.3.2. Retail and Consumer Goods
- 5.3.3. Healthcare
- 5.3.4. BFSI
- 5.3.5. Other End Users
- 5.4. Market Analysis, Insights and Forecast - by Region
- 5.4.1. North America
- 5.4.2. South America
- 5.4.3. Europe
- 5.4.4. Middle East & Africa
- 5.4.5. Asia Pacific
- 5.1. Market Analysis, Insights and Forecast - by Type
- 6. Global Hong Kong OOH And DOOH Market Analysis, Insights and Forecast, 2021-2033
- 6.1. Market Analysis, Insights and Forecast - by Type
- 6.1.1. Static (Traditional) OOH
- 6.1.2. Digital OOH (LED Screens)
- 6.1.2.1. Programmatic OOH
- 6.1.2.2. Others
- 6.2. Market Analysis, Insights and Forecast - by Appli
- 6.2.1. Billboard
- 6.2.2. Transportation (Transit)
- 6.2.2.1. Airports
- 6.2.2.2. Others (Buses, etc.)
- 6.2.3. Street Furniture
- 6.2.4. Other Place-Based Media
- 6.3. Market Analysis, Insights and Forecast - by End-U
- 6.3.1. Automotive
- 6.3.2. Retail and Consumer Goods
- 6.3.3. Healthcare
- 6.3.4. BFSI
- 6.3.5. Other End Users
- 6.1. Market Analysis, Insights and Forecast - by Type
- 7. North America Hong Kong OOH And DOOH Market Analysis, Insights and Forecast, 2020-2032
- 7.1. Market Analysis, Insights and Forecast - by Type
- 7.1.1. Static (Traditional) OOH
- 7.1.2. Digital OOH (LED Screens)
- 7.1.2.1. Programmatic OOH
- 7.1.2.2. Others
- 7.2. Market Analysis, Insights and Forecast - by Appli
- 7.2.1. Billboard
- 7.2.2. Transportation (Transit)
- 7.2.2.1. Airports
- 7.2.2.2. Others (Buses, etc.)
- 7.2.3. Street Furniture
- 7.2.4. Other Place-Based Media
- 7.3. Market Analysis, Insights and Forecast - by End-U
- 7.3.1. Automotive
- 7.3.2. Retail and Consumer Goods
- 7.3.3. Healthcare
- 7.3.4. BFSI
- 7.3.5. Other End Users
- 7.1. Market Analysis, Insights and Forecast - by Type
- 8. South America Hong Kong OOH And DOOH Market Analysis, Insights and Forecast, 2020-2032
- 8.1. Market Analysis, Insights and Forecast - by Type
- 8.1.1. Static (Traditional) OOH
- 8.1.2. Digital OOH (LED Screens)
- 8.1.2.1. Programmatic OOH
- 8.1.2.2. Others
- 8.2. Market Analysis, Insights and Forecast - by Appli
- 8.2.1. Billboard
- 8.2.2. Transportation (Transit)
- 8.2.2.1. Airports
- 8.2.2.2. Others (Buses, etc.)
- 8.2.3. Street Furniture
- 8.2.4. Other Place-Based Media
- 8.3. Market Analysis, Insights and Forecast - by End-U
- 8.3.1. Automotive
- 8.3.2. Retail and Consumer Goods
- 8.3.3. Healthcare
- 8.3.4. BFSI
- 8.3.5. Other End Users
- 8.1. Market Analysis, Insights and Forecast - by Type
- 9. Europe Hong Kong OOH And DOOH Market Analysis, Insights and Forecast, 2020-2032
- 9.1. Market Analysis, Insights and Forecast - by Type
- 9.1.1. Static (Traditional) OOH
- 9.1.2. Digital OOH (LED Screens)
- 9.1.2.1. Programmatic OOH
- 9.1.2.2. Others
- 9.2. Market Analysis, Insights and Forecast - by Appli
- 9.2.1. Billboard
- 9.2.2. Transportation (Transit)
- 9.2.2.1. Airports
- 9.2.2.2. Others (Buses, etc.)
- 9.2.3. Street Furniture
- 9.2.4. Other Place-Based Media
- 9.3. Market Analysis, Insights and Forecast - by End-U
- 9.3.1. Automotive
- 9.3.2. Retail and Consumer Goods
- 9.3.3. Healthcare
- 9.3.4. BFSI
- 9.3.5. Other End Users
- 9.1. Market Analysis, Insights and Forecast - by Type
- 10. Middle East & Africa Hong Kong OOH And DOOH Market Analysis, Insights and Forecast, 2020-2032
- 10.1. Market Analysis, Insights and Forecast - by Type
- 10.1.1. Static (Traditional) OOH
- 10.1.2. Digital OOH (LED Screens)
- 10.1.2.1. Programmatic OOH
- 10.1.2.2. Others
- 10.2. Market Analysis, Insights and Forecast - by Appli
- 10.2.1. Billboard
- 10.2.2. Transportation (Transit)
- 10.2.2.1. Airports
- 10.2.2.2. Others (Buses, etc.)
- 10.2.3. Street Furniture
- 10.2.4. Other Place-Based Media
- 10.3. Market Analysis, Insights and Forecast - by End-U
- 10.3.1. Automotive
- 10.3.2. Retail and Consumer Goods
- 10.3.3. Healthcare
- 10.3.4. BFSI
- 10.3.5. Other End Users
- 10.1. Market Analysis, Insights and Forecast - by Type
- 11. Asia Pacific Hong Kong OOH And DOOH Market Analysis, Insights and Forecast, 2020-2032
- 11.1. Market Analysis, Insights and Forecast - by Type
- 11.1.1. Static (Traditional) OOH
- 11.1.2. Digital OOH (LED Screens)
- 11.1.2.1. Programmatic OOH
- 11.1.2.2. Others
- 11.2. Market Analysis, Insights and Forecast - by Appli
- 11.2.1. Billboard
- 11.2.2. Transportation (Transit)
- 11.2.2.1. Airports
- 11.2.2.2. Others (Buses, etc.)
- 11.2.3. Street Furniture
- 11.2.4. Other Place-Based Media
- 11.3. Market Analysis, Insights and Forecast - by End-U
- 11.3.1. Automotive
- 11.3.2. Retail and Consumer Goods
- 11.3.3. Healthcare
- 11.3.4. BFSI
- 11.3.5. Other End Users
- 11.1. Market Analysis, Insights and Forecast - by Type
- 12. Competitive Analysis
- 12.1. Company Profiles
- 12.1.1 JCDecaux SE
- 12.1.1.1. Company Overview
- 12.1.1.2. Products
- 12.1.1.3. Company Financials
- 12.1.1.4. SWOT Analysis
- 12.1.2 Hivestack
- 12.1.2.1. Company Overview
- 12.1.2.2. Products
- 12.1.2.3. Company Financials
- 12.1.2.4. SWOT Analysis
- 12.1.3 Asiaray Media Group Limited
- 12.1.3.1. Company Overview
- 12.1.3.2. Products
- 12.1.3.3. Company Financials
- 12.1.3.4. SWOT Analysis
- 12.1.4 Cody Outdoor International (Hong Kong) Limited
- 12.1.4.1. Company Overview
- 12.1.4.2. Products
- 12.1.4.3. Company Financials
- 12.1.4.4. SWOT Analysis
- 12.1.5 XGD Media Limited
- 12.1.5.1. Company Overview
- 12.1.5.2. Products
- 12.1.5.3. Company Financials
- 12.1.5.4. SWOT Analysis
- 12.1.6 Dentsu
- 12.1.6.1. Company Overview
- 12.1.6.2. Products
- 12.1.6.3. Company Financials
- 12.1.6.4. SWOT Analysis
- 12.1.7 POADmedia Limited
- 12.1.7.1. Company Overview
- 12.1.7.2. Products
- 12.1.7.3. Company Financials
- 12.1.7.4. SWOT Analysis
- 12.1.8 VIOOH
- 12.1.8.1. Company Overview
- 12.1.8.2. Products
- 12.1.8.3. Company Financials
- 12.1.8.4. SWOT Analysis
- 12.1.9 Vistar Media
- 12.1.9.1. Company Overview
- 12.1.9.2. Products
- 12.1.9.3. Company Financials
- 12.1.9.4. SWOT Analysis
- 12.1.10 Displayforce*List Not Exhaustive
- 12.1.10.1. Company Overview
- 12.1.10.2. Products
- 12.1.10.3. Company Financials
- 12.1.10.4. SWOT Analysis
- 12.1.1 JCDecaux SE
- 12.2. Market Entropy
- 12.2.1 Company's Key Areas Served
- 12.2.2 Recent Developments
- 12.3. Company Market Share Analysis 2025
- 12.3.1 Top 5 Companies Market Share Analysis
- 12.3.2 Top 3 Companies Market Share Analysis
- 12.4. List of Potential Customers
- 13. Research Methodology
List of Figures
- Figure 1: Global Hong Kong OOH And DOOH Market Revenue Breakdown (Million, %) by Region 2025 & 2033
- Figure 2: Global Hong Kong OOH And DOOH Market Volume Breakdown (Million, %) by Region 2025 & 2033
- Figure 3: North America Hong Kong OOH And DOOH Market Revenue (Million), by Type 2025 & 2033
- Figure 4: North America Hong Kong OOH And DOOH Market Volume (Million), by Type 2025 & 2033
- Figure 5: North America Hong Kong OOH And DOOH Market Revenue Share (%), by Type 2025 & 2033
- Figure 6: North America Hong Kong OOH And DOOH Market Volume Share (%), by Type 2025 & 2033
- Figure 7: North America Hong Kong OOH And DOOH Market Revenue (Million), by Appli 2025 & 2033
- Figure 8: North America Hong Kong OOH And DOOH Market Volume (Million), by Appli 2025 & 2033
- Figure 9: North America Hong Kong OOH And DOOH Market Revenue Share (%), by Appli 2025 & 2033
- Figure 10: North America Hong Kong OOH And DOOH Market Volume Share (%), by Appli 2025 & 2033
- Figure 11: North America Hong Kong OOH And DOOH Market Revenue (Million), by End-U 2025 & 2033
- Figure 12: North America Hong Kong OOH And DOOH Market Volume (Million), by End-U 2025 & 2033
- Figure 13: North America Hong Kong OOH And DOOH Market Revenue Share (%), by End-U 2025 & 2033
- Figure 14: North America Hong Kong OOH And DOOH Market Volume Share (%), by End-U 2025 & 2033
- Figure 15: North America Hong Kong OOH And DOOH Market Revenue (Million), by Country 2025 & 2033
- Figure 16: North America Hong Kong OOH And DOOH Market Volume (Million), by Country 2025 & 2033
- Figure 17: North America Hong Kong OOH And DOOH Market Revenue Share (%), by Country 2025 & 2033
- Figure 18: North America Hong Kong OOH And DOOH Market Volume Share (%), by Country 2025 & 2033
- Figure 19: South America Hong Kong OOH And DOOH Market Revenue (Million), by Type 2025 & 2033
- Figure 20: South America Hong Kong OOH And DOOH Market Volume (Million), by Type 2025 & 2033
- Figure 21: South America Hong Kong OOH And DOOH Market Revenue Share (%), by Type 2025 & 2033
- Figure 22: South America Hong Kong OOH And DOOH Market Volume Share (%), by Type 2025 & 2033
- Figure 23: South America Hong Kong OOH And DOOH Market Revenue (Million), by Appli 2025 & 2033
- Figure 24: South America Hong Kong OOH And DOOH Market Volume (Million), by Appli 2025 & 2033
- Figure 25: South America Hong Kong OOH And DOOH Market Revenue Share (%), by Appli 2025 & 2033
- Figure 26: South America Hong Kong OOH And DOOH Market Volume Share (%), by Appli 2025 & 2033
- Figure 27: South America Hong Kong OOH And DOOH Market Revenue (Million), by End-U 2025 & 2033
- Figure 28: South America Hong Kong OOH And DOOH Market Volume (Million), by End-U 2025 & 2033
- Figure 29: South America Hong Kong OOH And DOOH Market Revenue Share (%), by End-U 2025 & 2033
- Figure 30: South America Hong Kong OOH And DOOH Market Volume Share (%), by End-U 2025 & 2033
- Figure 31: South America Hong Kong OOH And DOOH Market Revenue (Million), by Country 2025 & 2033
- Figure 32: South America Hong Kong OOH And DOOH Market Volume (Million), by Country 2025 & 2033
- Figure 33: South America Hong Kong OOH And DOOH Market Revenue Share (%), by Country 2025 & 2033
- Figure 34: South America Hong Kong OOH And DOOH Market Volume Share (%), by Country 2025 & 2033
- Figure 35: Europe Hong Kong OOH And DOOH Market Revenue (Million), by Type 2025 & 2033
- Figure 36: Europe Hong Kong OOH And DOOH Market Volume (Million), by Type 2025 & 2033
- Figure 37: Europe Hong Kong OOH And DOOH Market Revenue Share (%), by Type 2025 & 2033
- Figure 38: Europe Hong Kong OOH And DOOH Market Volume Share (%), by Type 2025 & 2033
- Figure 39: Europe Hong Kong OOH And DOOH Market Revenue (Million), by Appli 2025 & 2033
- Figure 40: Europe Hong Kong OOH And DOOH Market Volume (Million), by Appli 2025 & 2033
- Figure 41: Europe Hong Kong OOH And DOOH Market Revenue Share (%), by Appli 2025 & 2033
- Figure 42: Europe Hong Kong OOH And DOOH Market Volume Share (%), by Appli 2025 & 2033
- Figure 43: Europe Hong Kong OOH And DOOH Market Revenue (Million), by End-U 2025 & 2033
- Figure 44: Europe Hong Kong OOH And DOOH Market Volume (Million), by End-U 2025 & 2033
- Figure 45: Europe Hong Kong OOH And DOOH Market Revenue Share (%), by End-U 2025 & 2033
- Figure 46: Europe Hong Kong OOH And DOOH Market Volume Share (%), by End-U 2025 & 2033
- Figure 47: Europe Hong Kong OOH And DOOH Market Revenue (Million), by Country 2025 & 2033
- Figure 48: Europe Hong Kong OOH And DOOH Market Volume (Million), by Country 2025 & 2033
- Figure 49: Europe Hong Kong OOH And DOOH Market Revenue Share (%), by Country 2025 & 2033
- Figure 50: Europe Hong Kong OOH And DOOH Market Volume Share (%), by Country 2025 & 2033
- Figure 51: Middle East & Africa Hong Kong OOH And DOOH Market Revenue (Million), by Type 2025 & 2033
- Figure 52: Middle East & Africa Hong Kong OOH And DOOH Market Volume (Million), by Type 2025 & 2033
- Figure 53: Middle East & Africa Hong Kong OOH And DOOH Market Revenue Share (%), by Type 2025 & 2033
- Figure 54: Middle East & Africa Hong Kong OOH And DOOH Market Volume Share (%), by Type 2025 & 2033
- Figure 55: Middle East & Africa Hong Kong OOH And DOOH Market Revenue (Million), by Appli 2025 & 2033
- Figure 56: Middle East & Africa Hong Kong OOH And DOOH Market Volume (Million), by Appli 2025 & 2033
- Figure 57: Middle East & Africa Hong Kong OOH And DOOH Market Revenue Share (%), by Appli 2025 & 2033
- Figure 58: Middle East & Africa Hong Kong OOH And DOOH Market Volume Share (%), by Appli 2025 & 2033
- Figure 59: Middle East & Africa Hong Kong OOH And DOOH Market Revenue (Million), by End-U 2025 & 2033
- Figure 60: Middle East & Africa Hong Kong OOH And DOOH Market Volume (Million), by End-U 2025 & 2033
- Figure 61: Middle East & Africa Hong Kong OOH And DOOH Market Revenue Share (%), by End-U 2025 & 2033
- Figure 62: Middle East & Africa Hong Kong OOH And DOOH Market Volume Share (%), by End-U 2025 & 2033
- Figure 63: Middle East & Africa Hong Kong OOH And DOOH Market Revenue (Million), by Country 2025 & 2033
- Figure 64: Middle East & Africa Hong Kong OOH And DOOH Market Volume (Million), by Country 2025 & 2033
- Figure 65: Middle East & Africa Hong Kong OOH And DOOH Market Revenue Share (%), by Country 2025 & 2033
- Figure 66: Middle East & Africa Hong Kong OOH And DOOH Market Volume Share (%), by Country 2025 & 2033
- Figure 67: Asia Pacific Hong Kong OOH And DOOH Market Revenue (Million), by Type 2025 & 2033
- Figure 68: Asia Pacific Hong Kong OOH And DOOH Market Volume (Million), by Type 2025 & 2033
- Figure 69: Asia Pacific Hong Kong OOH And DOOH Market Revenue Share (%), by Type 2025 & 2033
- Figure 70: Asia Pacific Hong Kong OOH And DOOH Market Volume Share (%), by Type 2025 & 2033
- Figure 71: Asia Pacific Hong Kong OOH And DOOH Market Revenue (Million), by Appli 2025 & 2033
- Figure 72: Asia Pacific Hong Kong OOH And DOOH Market Volume (Million), by Appli 2025 & 2033
- Figure 73: Asia Pacific Hong Kong OOH And DOOH Market Revenue Share (%), by Appli 2025 & 2033
- Figure 74: Asia Pacific Hong Kong OOH And DOOH Market Volume Share (%), by Appli 2025 & 2033
- Figure 75: Asia Pacific Hong Kong OOH And DOOH Market Revenue (Million), by End-U 2025 & 2033
- Figure 76: Asia Pacific Hong Kong OOH And DOOH Market Volume (Million), by End-U 2025 & 2033
- Figure 77: Asia Pacific Hong Kong OOH And DOOH Market Revenue Share (%), by End-U 2025 & 2033
- Figure 78: Asia Pacific Hong Kong OOH And DOOH Market Volume Share (%), by End-U 2025 & 2033
- Figure 79: Asia Pacific Hong Kong OOH And DOOH Market Revenue (Million), by Country 2025 & 2033
- Figure 80: Asia Pacific Hong Kong OOH And DOOH Market Volume (Million), by Country 2025 & 2033
- Figure 81: Asia Pacific Hong Kong OOH And DOOH Market Revenue Share (%), by Country 2025 & 2033
- Figure 82: Asia Pacific Hong Kong OOH And DOOH Market Volume Share (%), by Country 2025 & 2033
List of Tables
- Table 1: Global Hong Kong OOH And DOOH Market Revenue Million Forecast, by Type 2020 & 2033
- Table 2: Global Hong Kong OOH And DOOH Market Volume Million Forecast, by Type 2020 & 2033
- Table 3: Global Hong Kong OOH And DOOH Market Revenue Million Forecast, by Appli 2020 & 2033
- Table 4: Global Hong Kong OOH And DOOH Market Volume Million Forecast, by Appli 2020 & 2033
- Table 5: Global Hong Kong OOH And DOOH Market Revenue Million Forecast, by End-U 2020 & 2033
- Table 6: Global Hong Kong OOH And DOOH Market Volume Million Forecast, by End-U 2020 & 2033
- Table 7: Global Hong Kong OOH And DOOH Market Revenue Million Forecast, by Region 2020 & 2033
- Table 8: Global Hong Kong OOH And DOOH Market Volume Million Forecast, by Region 2020 & 2033
- Table 9: Global Hong Kong OOH And DOOH Market Revenue Million Forecast, by Type 2020 & 2033
- Table 10: Global Hong Kong OOH And DOOH Market Volume Million Forecast, by Type 2020 & 2033
- Table 11: Global Hong Kong OOH And DOOH Market Revenue Million Forecast, by Appli 2020 & 2033
- Table 12: Global Hong Kong OOH And DOOH Market Volume Million Forecast, by Appli 2020 & 2033
- Table 13: Global Hong Kong OOH And DOOH Market Revenue Million Forecast, by End-U 2020 & 2033
- Table 14: Global Hong Kong OOH And DOOH Market Volume Million Forecast, by End-U 2020 & 2033
- Table 15: Global Hong Kong OOH And DOOH Market Revenue Million Forecast, by Country 2020 & 2033
- Table 16: Global Hong Kong OOH And DOOH Market Volume Million Forecast, by Country 2020 & 2033
- Table 17: United States Hong Kong OOH And DOOH Market Revenue (Million) Forecast, by Application 2020 & 2033
- Table 18: United States Hong Kong OOH And DOOH Market Volume (Million) Forecast, by Application 2020 & 2033
- Table 19: Canada Hong Kong OOH And DOOH Market Revenue (Million) Forecast, by Application 2020 & 2033
- Table 20: Canada Hong Kong OOH And DOOH Market Volume (Million) Forecast, by Application 2020 & 2033
- Table 21: Mexico Hong Kong OOH And DOOH Market Revenue (Million) Forecast, by Application 2020 & 2033
- Table 22: Mexico Hong Kong OOH And DOOH Market Volume (Million) Forecast, by Application 2020 & 2033
- Table 23: Global Hong Kong OOH And DOOH Market Revenue Million Forecast, by Type 2020 & 2033
- Table 24: Global Hong Kong OOH And DOOH Market Volume Million Forecast, by Type 2020 & 2033
- Table 25: Global Hong Kong OOH And DOOH Market Revenue Million Forecast, by Appli 2020 & 2033
- Table 26: Global Hong Kong OOH And DOOH Market Volume Million Forecast, by Appli 2020 & 2033
- Table 27: Global Hong Kong OOH And DOOH Market Revenue Million Forecast, by End-U 2020 & 2033
- Table 28: Global Hong Kong OOH And DOOH Market Volume Million Forecast, by End-U 2020 & 2033
- Table 29: Global Hong Kong OOH And DOOH Market Revenue Million Forecast, by Country 2020 & 2033
- Table 30: Global Hong Kong OOH And DOOH Market Volume Million Forecast, by Country 2020 & 2033
- Table 31: Brazil Hong Kong OOH And DOOH Market Revenue (Million) Forecast, by Application 2020 & 2033
- Table 32: Brazil Hong Kong OOH And DOOH Market Volume (Million) Forecast, by Application 2020 & 2033
- Table 33: Argentina Hong Kong OOH And DOOH Market Revenue (Million) Forecast, by Application 2020 & 2033
- Table 34: Argentina Hong Kong OOH And DOOH Market Volume (Million) Forecast, by Application 2020 & 2033
- Table 35: Rest of South America Hong Kong OOH And DOOH Market Revenue (Million) Forecast, by Application 2020 & 2033
- Table 36: Rest of South America Hong Kong OOH And DOOH Market Volume (Million) Forecast, by Application 2020 & 2033
- Table 37: Global Hong Kong OOH And DOOH Market Revenue Million Forecast, by Type 2020 & 2033
- Table 38: Global Hong Kong OOH And DOOH Market Volume Million Forecast, by Type 2020 & 2033
- Table 39: Global Hong Kong OOH And DOOH Market Revenue Million Forecast, by Appli 2020 & 2033
- Table 40: Global Hong Kong OOH And DOOH Market Volume Million Forecast, by Appli 2020 & 2033
- Table 41: Global Hong Kong OOH And DOOH Market Revenue Million Forecast, by End-U 2020 & 2033
- Table 42: Global Hong Kong OOH And DOOH Market Volume Million Forecast, by End-U 2020 & 2033
- Table 43: Global Hong Kong OOH And DOOH Market Revenue Million Forecast, by Country 2020 & 2033
- Table 44: Global Hong Kong OOH And DOOH Market Volume Million Forecast, by Country 2020 & 2033
- Table 45: United Kingdom Hong Kong OOH And DOOH Market Revenue (Million) Forecast, by Application 2020 & 2033
- Table 46: United Kingdom Hong Kong OOH And DOOH Market Volume (Million) Forecast, by Application 2020 & 2033
- Table 47: Germany Hong Kong OOH And DOOH Market Revenue (Million) Forecast, by Application 2020 & 2033
- Table 48: Germany Hong Kong OOH And DOOH Market Volume (Million) Forecast, by Application 2020 & 2033
- Table 49: France Hong Kong OOH And DOOH Market Revenue (Million) Forecast, by Application 2020 & 2033
- Table 50: France Hong Kong OOH And DOOH Market Volume (Million) Forecast, by Application 2020 & 2033
- Table 51: Italy Hong Kong OOH And DOOH Market Revenue (Million) Forecast, by Application 2020 & 2033
- Table 52: Italy Hong Kong OOH And DOOH Market Volume (Million) Forecast, by Application 2020 & 2033
- Table 53: Spain Hong Kong OOH And DOOH Market Revenue (Million) Forecast, by Application 2020 & 2033
- Table 54: Spain Hong Kong OOH And DOOH Market Volume (Million) Forecast, by Application 2020 & 2033
- Table 55: Russia Hong Kong OOH And DOOH Market Revenue (Million) Forecast, by Application 2020 & 2033
- Table 56: Russia Hong Kong OOH And DOOH Market Volume (Million) Forecast, by Application 2020 & 2033
- Table 57: Benelux Hong Kong OOH And DOOH Market Revenue (Million) Forecast, by Application 2020 & 2033
- Table 58: Benelux Hong Kong OOH And DOOH Market Volume (Million) Forecast, by Application 2020 & 2033
- Table 59: Nordics Hong Kong OOH And DOOH Market Revenue (Million) Forecast, by Application 2020 & 2033
- Table 60: Nordics Hong Kong OOH And DOOH Market Volume (Million) Forecast, by Application 2020 & 2033
- Table 61: Rest of Europe Hong Kong OOH And DOOH Market Revenue (Million) Forecast, by Application 2020 & 2033
- Table 62: Rest of Europe Hong Kong OOH And DOOH Market Volume (Million) Forecast, by Application 2020 & 2033
- Table 63: Global Hong Kong OOH And DOOH Market Revenue Million Forecast, by Type 2020 & 2033
- Table 64: Global Hong Kong OOH And DOOH Market Volume Million Forecast, by Type 2020 & 2033
- Table 65: Global Hong Kong OOH And DOOH Market Revenue Million Forecast, by Appli 2020 & 2033
- Table 66: Global Hong Kong OOH And DOOH Market Volume Million Forecast, by Appli 2020 & 2033
- Table 67: Global Hong Kong OOH And DOOH Market Revenue Million Forecast, by End-U 2020 & 2033
- Table 68: Global Hong Kong OOH And DOOH Market Volume Million Forecast, by End-U 2020 & 2033
- Table 69: Global Hong Kong OOH And DOOH Market Revenue Million Forecast, by Country 2020 & 2033
- Table 70: Global Hong Kong OOH And DOOH Market Volume Million Forecast, by Country 2020 & 2033
- Table 71: Turkey Hong Kong OOH And DOOH Market Revenue (Million) Forecast, by Application 2020 & 2033
- Table 72: Turkey Hong Kong OOH And DOOH Market Volume (Million) Forecast, by Application 2020 & 2033
- Table 73: Israel Hong Kong OOH And DOOH Market Revenue (Million) Forecast, by Application 2020 & 2033
- Table 74: Israel Hong Kong OOH And DOOH Market Volume (Million) Forecast, by Application 2020 & 2033
- Table 75: GCC Hong Kong OOH And DOOH Market Revenue (Million) Forecast, by Application 2020 & 2033
- Table 76: GCC Hong Kong OOH And DOOH Market Volume (Million) Forecast, by Application 2020 & 2033
- Table 77: North Africa Hong Kong OOH And DOOH Market Revenue (Million) Forecast, by Application 2020 & 2033
- Table 78: North Africa Hong Kong OOH And DOOH Market Volume (Million) Forecast, by Application 2020 & 2033
- Table 79: South Africa Hong Kong OOH And DOOH Market Revenue (Million) Forecast, by Application 2020 & 2033
- Table 80: South Africa Hong Kong OOH And DOOH Market Volume (Million) Forecast, by Application 2020 & 2033
- Table 81: Rest of Middle East & Africa Hong Kong OOH And DOOH Market Revenue (Million) Forecast, by Application 2020 & 2033
- Table 82: Rest of Middle East & Africa Hong Kong OOH And DOOH Market Volume (Million) Forecast, by Application 2020 & 2033
- Table 83: Global Hong Kong OOH And DOOH Market Revenue Million Forecast, by Type 2020 & 2033
- Table 84: Global Hong Kong OOH And DOOH Market Volume Million Forecast, by Type 2020 & 2033
- Table 85: Global Hong Kong OOH And DOOH Market Revenue Million Forecast, by Appli 2020 & 2033
- Table 86: Global Hong Kong OOH And DOOH Market Volume Million Forecast, by Appli 2020 & 2033
- Table 87: Global Hong Kong OOH And DOOH Market Revenue Million Forecast, by End-U 2020 & 2033
- Table 88: Global Hong Kong OOH And DOOH Market Volume Million Forecast, by End-U 2020 & 2033
- Table 89: Global Hong Kong OOH And DOOH Market Revenue Million Forecast, by Country 2020 & 2033
- Table 90: Global Hong Kong OOH And DOOH Market Volume Million Forecast, by Country 2020 & 2033
- Table 91: China Hong Kong OOH And DOOH Market Revenue (Million) Forecast, by Application 2020 & 2033
- Table 92: China Hong Kong OOH And DOOH Market Volume (Million) Forecast, by Application 2020 & 2033
- Table 93: India Hong Kong OOH And DOOH Market Revenue (Million) Forecast, by Application 2020 & 2033
- Table 94: India Hong Kong OOH And DOOH Market Volume (Million) Forecast, by Application 2020 & 2033
- Table 95: Japan Hong Kong OOH And DOOH Market Revenue (Million) Forecast, by Application 2020 & 2033
- Table 96: Japan Hong Kong OOH And DOOH Market Volume (Million) Forecast, by Application 2020 & 2033
- Table 97: South Korea Hong Kong OOH And DOOH Market Revenue (Million) Forecast, by Application 2020 & 2033
- Table 98: South Korea Hong Kong OOH And DOOH Market Volume (Million) Forecast, by Application 2020 & 2033
- Table 99: ASEAN Hong Kong OOH And DOOH Market Revenue (Million) Forecast, by Application 2020 & 2033
- Table 100: ASEAN Hong Kong OOH And DOOH Market Volume (Million) Forecast, by Application 2020 & 2033
- Table 101: Oceania Hong Kong OOH And DOOH Market Revenue (Million) Forecast, by Application 2020 & 2033
- Table 102: Oceania Hong Kong OOH And DOOH Market Volume (Million) Forecast, by Application 2020 & 2033
- Table 103: Rest of Asia Pacific Hong Kong OOH And DOOH Market Revenue (Million) Forecast, by Application 2020 & 2033
- Table 104: Rest of Asia Pacific Hong Kong OOH And DOOH Market Volume (Million) Forecast, by Application 2020 & 2033
Frequently Asked Questions
1. What is the projected Compound Annual Growth Rate (CAGR) of the Hong Kong OOH And DOOH Market?
The projected CAGR is approximately 5.63%.
2. Which companies are prominent players in the Hong Kong OOH And DOOH Market?
Key companies in the market include JCDecaux SE, Hivestack, Asiaray Media Group Limited, Cody Outdoor International (Hong Kong) Limited, XGD Media Limited, Dentsu, POADmedia Limited, VIOOH, Vistar Media, Displayforce*List Not Exhaustive.
3. What are the main segments of the Hong Kong OOH And DOOH Market?
The market segments include Type , Appli, End-U.
4. Can you provide details about the market size?
The market size is estimated to be USD 628.20 Million as of 2022.
5. What are some drivers contributing to market growth?
Ongoing Shift Toward Digital Advertising; Increasing Use of Recommendation Engines.
6. What are the notable trends driving market growth?
Ongoing Shift Toward Digital Advertising Expected to Boost Market Growth.
7. Are there any restraints impacting market growth?
Ongoing Shift Toward Digital Advertising; Increasing Use of Recommendation Engines.
8. Can you provide examples of recent developments in the market?
January 2024: Bravo Media, an out-of-home media agency based in Hong Kong, is responding to the surging demand for digital formats by unveiling new digital ventures. These include digital pillar zones at MTR East Tsim Sha Tsui station and a dynamic digital impact zone at Admiralty station. This strategic move not only signifies a significant contract win for Bravo Media but also underlines its growing dominance in Hong Kong's out-of-home advertising landscape.
9. What pricing options are available for accessing the report?
Pricing options include single-user, multi-user, and enterprise licenses priced at USD 3800, USD 4500, and USD 5800 respectively.
10. Is the market size provided in terms of value or volume?
The market size is provided in terms of value, measured in Million and volume, measured in Million.
11. Are there any specific market keywords associated with the report?
Yes, the market keyword associated with the report is "Hong Kong OOH And DOOH Market," which aids in identifying and referencing the specific market segment covered.
12. How do I determine which pricing option suits my needs best?
The pricing options vary based on user requirements and access needs. Individual users may opt for single-user licenses, while businesses requiring broader access may choose multi-user or enterprise licenses for cost-effective access to the report.
13. Are there any additional resources or data provided in the Hong Kong OOH And DOOH Market report?
While the report offers comprehensive insights, it's advisable to review the specific contents or supplementary materials provided to ascertain if additional resources or data are available.
14. How can I stay updated on further developments or reports in the Hong Kong OOH And DOOH Market?
To stay informed about further developments, trends, and reports in the Hong Kong OOH And DOOH Market, consider subscribing to industry newsletters, following relevant companies and organizations, or regularly checking reputable industry news sources and publications.
Methodology
Step 1 - Identification of Relevant Samples Size from Population Database


Step 2 - Approaches for Defining Global Market Size (Value, Volume* & Price*)

Note*: In applicable scenarios
Step 3 - Data Sources
Primary Research
- Web Analytics
- Survey Reports
- Research Institute
- Latest Research Reports
- Opinion Leaders
Secondary Research
- Annual Reports
- White Paper
- Latest Press Release
- Industry Association
- Paid Database
- Investor Presentations

Step 4 - Data Triangulation
Involves using different sources of information in order to increase the validity of a study
These sources are likely to be stakeholders in a program - participants, other researchers, program staff, other community members, and so on.
Then we put all data in single framework & apply various statistical tools to find out the dynamic on the market.
During the analysis stage, feedback from the stakeholder groups would be compared to determine areas of agreement as well as areas of divergence