
Key Insights
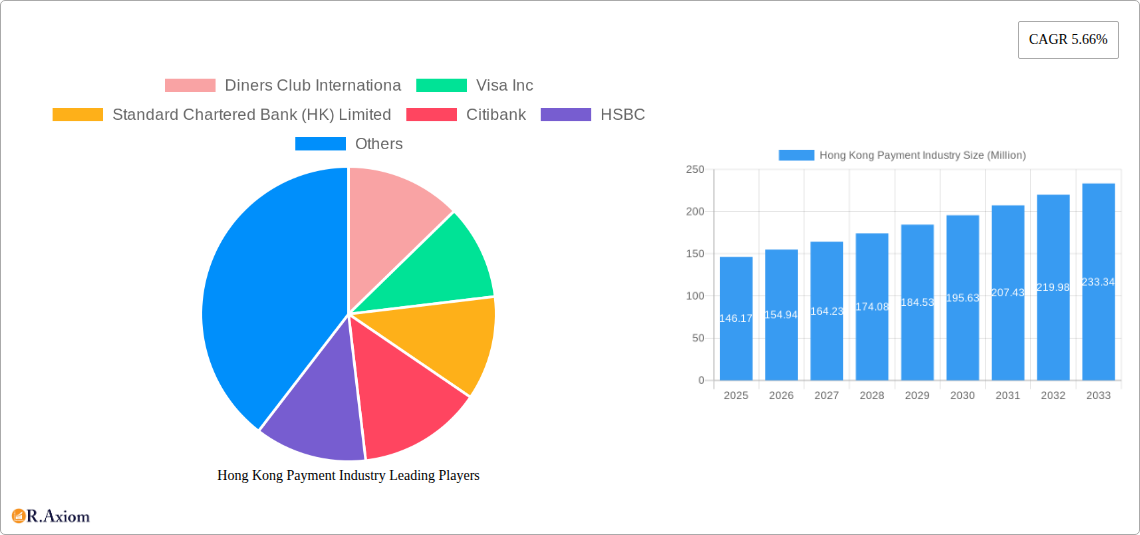
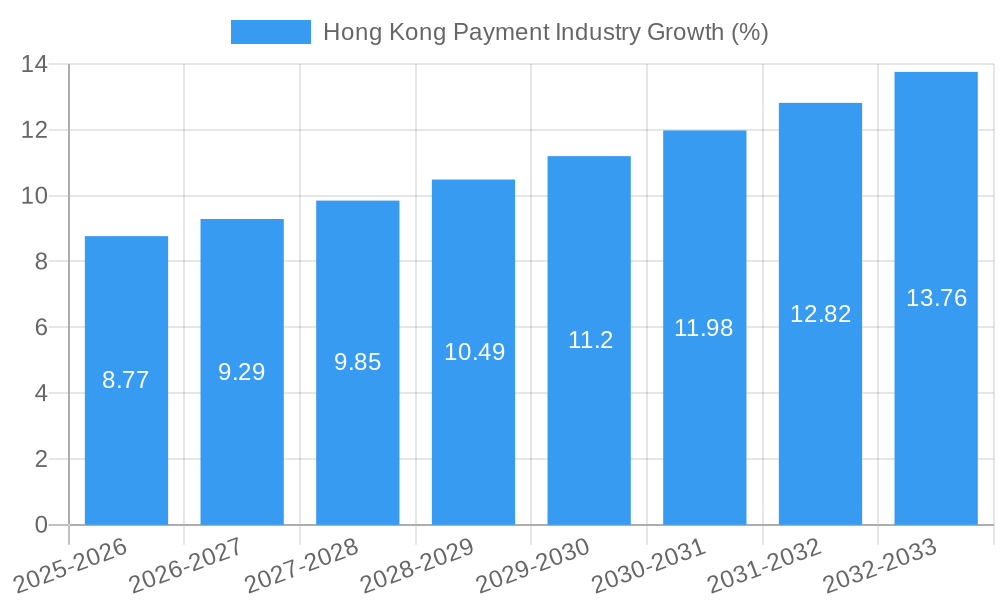
The Hong Kong payment industry, valued at $146.17 million in 2025, is projected to experience robust growth, driven by increasing digital adoption, expanding e-commerce, and a thriving tourism sector. The compound annual growth rate (CAGR) of 5.66% from 2025 to 2033 indicates a steady upward trajectory. Key drivers include the rising popularity of mobile payment solutions, contactless transactions, and the government's initiatives to promote fintech innovation. The market segmentation reveals a significant contribution from both online and point-of-sale transactions across various sectors, with retail, entertainment, and hospitality being major end-user industries. Competition among major players like Visa, Mastercard, American Express, and local banks is intensifying, leading to innovation in payment technologies and enhanced customer experiences. While regulatory hurdles and potential security concerns might pose some restraints, the overall market outlook remains positive, fueled by a growing demand for convenient and secure payment options in Hong Kong.
The industry's growth is further fueled by the increasing preference for digital wallets and the expanding use of QR code-based payments. The rise of Buy Now Pay Later (BNPL) services and the integration of embedded finance into various platforms are also contributing factors. While the historical period (2019-2024) likely saw a slower growth rate due to factors like global economic uncertainties, the forecast period (2025-2033) is anticipated to experience accelerated growth due to recovery and the ongoing digital transformation. The dominance of major international players alongside strong local banking institutions suggests a competitive landscape ripe for strategic partnerships and technological advancements. Continued investment in cybersecurity measures and regulatory compliance will be crucial for sustaining the industry's growth and ensuring consumer trust.
Hong Kong Payment Industry: A Comprehensive Market Report (2019-2033)
This detailed report provides a comprehensive analysis of the Hong Kong payment industry, covering market size, growth trends, key players, and future outlook. The study period spans from 2019 to 2033, with 2025 serving as the base and estimated year. The forecast period is 2025-2033, and the historical period is 2019-2024. This report is crucial for businesses, investors, and policymakers seeking actionable insights into this dynamic market.
Hong Kong Payment Industry Market Concentration & Innovation
The Hong Kong payment industry exhibits a concentrated yet dynamic market structure. Key players like Visa Inc, Mastercard Incorporated, and American Express Company hold significant market share, while local banks such as HSBC, Standard Chartered Bank (HK) Limited, Bank of China, and The Bank of East Asia Limited (BEA) play a vital role in domestic transactions. The rise of fintech companies and the increasing adoption of mobile payment solutions are challenging the established players. Innovation is driven by factors such as increasing smartphone penetration, government initiatives promoting digitalization, and the growing demand for seamless and secure payment experiences. Regulatory frameworks, while fostering competition, also shape the competitive landscape. The substitution of traditional methods with digital alternatives is accelerating rapidly. The recent M&A activity, while not exceeding $XX Million in total deal value during the historical period, points towards consolidation and expansion strategies among players.
- Market Share: Visa and Mastercard collectively hold an estimated xx% market share, while local banks contribute another xx%.
- M&A Activity: xx major M&A deals have been recorded between 2019 and 2024, focusing on expanding digital capabilities and cross-border payment services.
Hong Kong Payment Industry Industry Trends & Insights
The Hong Kong payment industry is experiencing robust growth, fueled by a surge in e-commerce, rising mobile penetration, and increasing adoption of digital payment methods. The Compound Annual Growth Rate (CAGR) for the industry during the forecast period (2025-2033) is projected to be xx%, driven by increasing consumer preference for contactless payments, online transactions, and improved security features. Market penetration of digital payment solutions is expected to reach xx% by 2033. Technological disruptions, such as the introduction of blockchain technology and advancements in artificial intelligence (AI), are reshaping the competitive dynamics, allowing for greater efficiency and security. Consumer preferences are shifting towards convenient, user-friendly, and secure payment solutions, emphasizing the need for continuous innovation and adaptation by industry players.
Dominant Markets & Segments in Hong Kong Payment Industry
The retail sector dominates the Hong Kong payment market, followed by hospitality and entertainment. Online sales are experiencing exponential growth, while point-of-sale (POS) transactions continue to be significant.
- By Mode of Payment: Point-of-sale (POS) transactions remain the largest segment, but online sales are rapidly gaining traction, projected to account for xx% of the market by 2033. Other point-of-sale systems, such as those used in transportation and utilities, also constitute a noteworthy segment.
- By End-user Industry:
- Retail: Dominates due to high consumer spending and widespread adoption of digital payment options. Key drivers include the robust retail infrastructure and supportive government policies.
- Entertainment: Strong growth driven by rising disposable incomes and a thriving tourism sector.
- Healthcare: Moderate growth as digital payments are increasingly integrated into healthcare systems.
- Hospitality: Significant growth in line with tourism and rising adoption of online booking platforms.
- Other End-user Industries: Growth is steady across diverse sectors, such as transportation and utilities.
Hong Kong Payment Industry Product Developments
Recent innovations include the expansion of mobile payment apps, the integration of biometric authentication, and the increasing adoption of tokenization technology to enhance security. These advancements improve customer experience, boost transaction efficiency, and address concerns about data privacy and security. The market is seeing a strong push for seamless cross-border payment solutions, benefiting both businesses and consumers.
Report Scope & Segmentation Analysis
This report segments the Hong Kong payment industry by mode of payment (point-of-sale, online sales, other POS) and end-user industry (retail, entertainment, healthcare, hospitality, and others). Each segment's growth projection, market size, and competitive dynamics are analyzed in detail, providing a complete understanding of the market's structure and potential.
Key Drivers of Hong Kong Payment Industry Growth
Key growth drivers include increasing smartphone penetration, the government's push for digitalization, rising e-commerce adoption, expanding tourism, and a growing preference for contactless and cashless transactions. These factors are creating a favorable environment for the continued expansion of the payment industry.
Challenges in the Hong Kong Payment Industry Sector
Challenges include maintaining data security, adapting to evolving consumer preferences, and navigating regulatory complexities. Competition from both established players and new entrants also poses a significant challenge. The industry faces the task of balancing innovation with maintaining robust security measures to prevent fraud.
Emerging Opportunities in Hong Kong Payment Industry
Emerging opportunities exist in areas such as the expansion of mobile payments, the adoption of open banking, and the integration of blockchain technology. Developing innovative solutions for small and medium-sized enterprises (SMEs) also presents a significant growth area.
Leading Players in the Hong Kong Payment Industry Market
- Diners Club International
- Visa Inc
- Standard Chartered Bank (HK) Limited
- Citibank
- HSBC
- Bank of China
- American Express Company
- The Bank of East Asia Limited (BEA)
- Mastercard Incorporated
- EPS Company
Key Developments in Hong Kong Payment Industry Industry
- November 2023: JCB and Stripe expanded their partnership to Europe, Singapore, and Hong Kong. Stripe added JCB to its default payment scheme for merchants. This expansion significantly broadens the acceptance of JCB cards, benefiting both consumers and businesses.
Strategic Outlook for Hong Kong Payment Industry Market
The Hong Kong payment industry is poised for continued growth, driven by technological advancements, supportive government policies, and evolving consumer preferences. The focus on enhancing security, promoting interoperability, and expanding cross-border payment solutions will shape the industry's future trajectory. The market presents attractive opportunities for both established players and innovative fintech companies.
Hong Kong Payment Industry Segmentation
-
1. Mode of Payment
-
1.1. By Point of Sale
- 1.1.1. Card Payments
- 1.1.2. Digital Wallet
- 1.1.3. Cash
- 1.1.4. Other Point of Sales
-
1.2. By Online Sale
- 1.2.1. Other Online Sales
-
1.1. By Point of Sale
-
2. End-user Industry
- 2.1. Retail
- 2.2. Entertainment
- 2.3. Healthcare
- 2.4. Hospitality
- 2.5. Other End-user Industries
Hong Kong Payment Industry Segmentation By Geography
-
1. North America
- 1.1. United States
- 1.2. Canada
- 1.3. Mexico
-
2. South America
- 2.1. Brazil
- 2.2. Argentina
- 2.3. Rest of South America
-
3. Europe
- 3.1. United Kingdom
- 3.2. Germany
- 3.3. France
- 3.4. Italy
- 3.5. Spain
- 3.6. Russia
- 3.7. Benelux
- 3.8. Nordics
- 3.9. Rest of Europe
-
4. Middle East & Africa
- 4.1. Turkey
- 4.2. Israel
- 4.3. GCC
- 4.4. North Africa
- 4.5. South Africa
- 4.6. Rest of Middle East & Africa
-
5. Asia Pacific
- 5.1. China
- 5.2. India
- 5.3. Japan
- 5.4. South Korea
- 5.5. ASEAN
- 5.6. Oceania
- 5.7. Rest of Asia Pacific
Hong Kong Payment Industry REPORT HIGHLIGHTS
| Aspects | Details |
|---|---|
| Study Period | 2019-2033 |
| Base Year | 2024 |
| Estimated Year | 2025 |
| Forecast Period | 2025-2033 |
| Historical Period | 2019-2024 |
| Growth Rate | CAGR of 5.66% from 2019-2033 |
| Segmentation |
|
Table of Contents
- 1. Introduction
- 1.1. Research Scope
- 1.2. Market Segmentation
- 1.3. Research Methodology
- 1.4. Definitions and Assumptions
- 2. Executive Summary
- 2.1. Introduction
- 3. Market Dynamics
- 3.1. Introduction
- 3.2. Market Drivers
- 3.2.1. Integration of Payment Gateways; Initiatives by the Government to Advance in Digital Payments
- 3.3. Market Restrains
- 3.3.1. Rising Concern Regarding e-Waste
- 3.4. Market Trends
- 3.4.1. Card Payments to Hold Significant Share in Online Payment Sector
- 4. Market Factor Analysis
- 4.1. Porters Five Forces
- 4.2. Supply/Value Chain
- 4.3. PESTEL analysis
- 4.4. Market Entropy
- 4.5. Patent/Trademark Analysis
- 5. Global Hong Kong Payment Industry Analysis, Insights and Forecast, 2019-2031
- 5.1. Market Analysis, Insights and Forecast - by Mode of Payment
- 5.1.1. By Point of Sale
- 5.1.1.1. Card Payments
- 5.1.1.2. Digital Wallet
- 5.1.1.3. Cash
- 5.1.1.4. Other Point of Sales
- 5.1.2. By Online Sale
- 5.1.2.1. Other Online Sales
- 5.1.1. By Point of Sale
- 5.2. Market Analysis, Insights and Forecast - by End-user Industry
- 5.2.1. Retail
- 5.2.2. Entertainment
- 5.2.3. Healthcare
- 5.2.4. Hospitality
- 5.2.5. Other End-user Industries
- 5.3. Market Analysis, Insights and Forecast - by Region
- 5.3.1. North America
- 5.3.2. South America
- 5.3.3. Europe
- 5.3.4. Middle East & Africa
- 5.3.5. Asia Pacific
- 5.1. Market Analysis, Insights and Forecast - by Mode of Payment
- 6. North America Hong Kong Payment Industry Analysis, Insights and Forecast, 2019-2031
- 6.1. Market Analysis, Insights and Forecast - by Mode of Payment
- 6.1.1. By Point of Sale
- 6.1.1.1. Card Payments
- 6.1.1.2. Digital Wallet
- 6.1.1.3. Cash
- 6.1.1.4. Other Point of Sales
- 6.1.2. By Online Sale
- 6.1.2.1. Other Online Sales
- 6.1.1. By Point of Sale
- 6.2. Market Analysis, Insights and Forecast - by End-user Industry
- 6.2.1. Retail
- 6.2.2. Entertainment
- 6.2.3. Healthcare
- 6.2.4. Hospitality
- 6.2.5. Other End-user Industries
- 6.1. Market Analysis, Insights and Forecast - by Mode of Payment
- 7. South America Hong Kong Payment Industry Analysis, Insights and Forecast, 2019-2031
- 7.1. Market Analysis, Insights and Forecast - by Mode of Payment
- 7.1.1. By Point of Sale
- 7.1.1.1. Card Payments
- 7.1.1.2. Digital Wallet
- 7.1.1.3. Cash
- 7.1.1.4. Other Point of Sales
- 7.1.2. By Online Sale
- 7.1.2.1. Other Online Sales
- 7.1.1. By Point of Sale
- 7.2. Market Analysis, Insights and Forecast - by End-user Industry
- 7.2.1. Retail
- 7.2.2. Entertainment
- 7.2.3. Healthcare
- 7.2.4. Hospitality
- 7.2.5. Other End-user Industries
- 7.1. Market Analysis, Insights and Forecast - by Mode of Payment
- 8. Europe Hong Kong Payment Industry Analysis, Insights and Forecast, 2019-2031
- 8.1. Market Analysis, Insights and Forecast - by Mode of Payment
- 8.1.1. By Point of Sale
- 8.1.1.1. Card Payments
- 8.1.1.2. Digital Wallet
- 8.1.1.3. Cash
- 8.1.1.4. Other Point of Sales
- 8.1.2. By Online Sale
- 8.1.2.1. Other Online Sales
- 8.1.1. By Point of Sale
- 8.2. Market Analysis, Insights and Forecast - by End-user Industry
- 8.2.1. Retail
- 8.2.2. Entertainment
- 8.2.3. Healthcare
- 8.2.4. Hospitality
- 8.2.5. Other End-user Industries
- 8.1. Market Analysis, Insights and Forecast - by Mode of Payment
- 9. Middle East & Africa Hong Kong Payment Industry Analysis, Insights and Forecast, 2019-2031
- 9.1. Market Analysis, Insights and Forecast - by Mode of Payment
- 9.1.1. By Point of Sale
- 9.1.1.1. Card Payments
- 9.1.1.2. Digital Wallet
- 9.1.1.3. Cash
- 9.1.1.4. Other Point of Sales
- 9.1.2. By Online Sale
- 9.1.2.1. Other Online Sales
- 9.1.1. By Point of Sale
- 9.2. Market Analysis, Insights and Forecast - by End-user Industry
- 9.2.1. Retail
- 9.2.2. Entertainment
- 9.2.3. Healthcare
- 9.2.4. Hospitality
- 9.2.5. Other End-user Industries
- 9.1. Market Analysis, Insights and Forecast - by Mode of Payment
- 10. Asia Pacific Hong Kong Payment Industry Analysis, Insights and Forecast, 2019-2031
- 10.1. Market Analysis, Insights and Forecast - by Mode of Payment
- 10.1.1. By Point of Sale
- 10.1.1.1. Card Payments
- 10.1.1.2. Digital Wallet
- 10.1.1.3. Cash
- 10.1.1.4. Other Point of Sales
- 10.1.2. By Online Sale
- 10.1.2.1. Other Online Sales
- 10.1.1. By Point of Sale
- 10.2. Market Analysis, Insights and Forecast - by End-user Industry
- 10.2.1. Retail
- 10.2.2. Entertainment
- 10.2.3. Healthcare
- 10.2.4. Hospitality
- 10.2.5. Other End-user Industries
- 10.1. Market Analysis, Insights and Forecast - by Mode of Payment
- 11. Competitive Analysis
- 11.1. Global Market Share Analysis 2024
- 11.2. Company Profiles
- 11.2.1 Diners Club Internationa
- 11.2.1.1. Overview
- 11.2.1.2. Products
- 11.2.1.3. SWOT Analysis
- 11.2.1.4. Recent Developments
- 11.2.1.5. Financials (Based on Availability)
- 11.2.2 Visa Inc
- 11.2.2.1. Overview
- 11.2.2.2. Products
- 11.2.2.3. SWOT Analysis
- 11.2.2.4. Recent Developments
- 11.2.2.5. Financials (Based on Availability)
- 11.2.3 Standard Chartered Bank (HK) Limited
- 11.2.3.1. Overview
- 11.2.3.2. Products
- 11.2.3.3. SWOT Analysis
- 11.2.3.4. Recent Developments
- 11.2.3.5. Financials (Based on Availability)
- 11.2.4 Citibank
- 11.2.4.1. Overview
- 11.2.4.2. Products
- 11.2.4.3. SWOT Analysis
- 11.2.4.4. Recent Developments
- 11.2.4.5. Financials (Based on Availability)
- 11.2.5 HSBC
- 11.2.5.1. Overview
- 11.2.5.2. Products
- 11.2.5.3. SWOT Analysis
- 11.2.5.4. Recent Developments
- 11.2.5.5. Financials (Based on Availability)
- 11.2.6 Bank of China
- 11.2.6.1. Overview
- 11.2.6.2. Products
- 11.2.6.3. SWOT Analysis
- 11.2.6.4. Recent Developments
- 11.2.6.5. Financials (Based on Availability)
- 11.2.7 American Express Company
- 11.2.7.1. Overview
- 11.2.7.2. Products
- 11.2.7.3. SWOT Analysis
- 11.2.7.4. Recent Developments
- 11.2.7.5. Financials (Based on Availability)
- 11.2.8 The Bank of East Asia Limited (BEA)
- 11.2.8.1. Overview
- 11.2.8.2. Products
- 11.2.8.3. SWOT Analysis
- 11.2.8.4. Recent Developments
- 11.2.8.5. Financials (Based on Availability)
- 11.2.9 Mastercard Incorporated
- 11.2.9.1. Overview
- 11.2.9.2. Products
- 11.2.9.3. SWOT Analysis
- 11.2.9.4. Recent Developments
- 11.2.9.5. Financials (Based on Availability)
- 11.2.10 EPS Company
- 11.2.10.1. Overview
- 11.2.10.2. Products
- 11.2.10.3. SWOT Analysis
- 11.2.10.4. Recent Developments
- 11.2.10.5. Financials (Based on Availability)
- 11.2.1 Diners Club Internationa
List of Figures
- Figure 1: Global Hong Kong Payment Industry Revenue Breakdown (Million, %) by Region 2024 & 2032
- Figure 2: Hong Kong Hong Kong Payment Industry Revenue (Million), by Country 2024 & 2032
- Figure 3: Hong Kong Hong Kong Payment Industry Revenue Share (%), by Country 2024 & 2032
- Figure 4: North America Hong Kong Payment Industry Revenue (Million), by Mode of Payment 2024 & 2032
- Figure 5: North America Hong Kong Payment Industry Revenue Share (%), by Mode of Payment 2024 & 2032
- Figure 6: North America Hong Kong Payment Industry Revenue (Million), by End-user Industry 2024 & 2032
- Figure 7: North America Hong Kong Payment Industry Revenue Share (%), by End-user Industry 2024 & 2032
- Figure 8: North America Hong Kong Payment Industry Revenue (Million), by Country 2024 & 2032
- Figure 9: North America Hong Kong Payment Industry Revenue Share (%), by Country 2024 & 2032
- Figure 10: South America Hong Kong Payment Industry Revenue (Million), by Mode of Payment 2024 & 2032
- Figure 11: South America Hong Kong Payment Industry Revenue Share (%), by Mode of Payment 2024 & 2032
- Figure 12: South America Hong Kong Payment Industry Revenue (Million), by End-user Industry 2024 & 2032
- Figure 13: South America Hong Kong Payment Industry Revenue Share (%), by End-user Industry 2024 & 2032
- Figure 14: South America Hong Kong Payment Industry Revenue (Million), by Country 2024 & 2032
- Figure 15: South America Hong Kong Payment Industry Revenue Share (%), by Country 2024 & 2032
- Figure 16: Europe Hong Kong Payment Industry Revenue (Million), by Mode of Payment 2024 & 2032
- Figure 17: Europe Hong Kong Payment Industry Revenue Share (%), by Mode of Payment 2024 & 2032
- Figure 18: Europe Hong Kong Payment Industry Revenue (Million), by End-user Industry 2024 & 2032
- Figure 19: Europe Hong Kong Payment Industry Revenue Share (%), by End-user Industry 2024 & 2032
- Figure 20: Europe Hong Kong Payment Industry Revenue (Million), by Country 2024 & 2032
- Figure 21: Europe Hong Kong Payment Industry Revenue Share (%), by Country 2024 & 2032
- Figure 22: Middle East & Africa Hong Kong Payment Industry Revenue (Million), by Mode of Payment 2024 & 2032
- Figure 23: Middle East & Africa Hong Kong Payment Industry Revenue Share (%), by Mode of Payment 2024 & 2032
- Figure 24: Middle East & Africa Hong Kong Payment Industry Revenue (Million), by End-user Industry 2024 & 2032
- Figure 25: Middle East & Africa Hong Kong Payment Industry Revenue Share (%), by End-user Industry 2024 & 2032
- Figure 26: Middle East & Africa Hong Kong Payment Industry Revenue (Million), by Country 2024 & 2032
- Figure 27: Middle East & Africa Hong Kong Payment Industry Revenue Share (%), by Country 2024 & 2032
- Figure 28: Asia Pacific Hong Kong Payment Industry Revenue (Million), by Mode of Payment 2024 & 2032
- Figure 29: Asia Pacific Hong Kong Payment Industry Revenue Share (%), by Mode of Payment 2024 & 2032
- Figure 30: Asia Pacific Hong Kong Payment Industry Revenue (Million), by End-user Industry 2024 & 2032
- Figure 31: Asia Pacific Hong Kong Payment Industry Revenue Share (%), by End-user Industry 2024 & 2032
- Figure 32: Asia Pacific Hong Kong Payment Industry Revenue (Million), by Country 2024 & 2032
- Figure 33: Asia Pacific Hong Kong Payment Industry Revenue Share (%), by Country 2024 & 2032
List of Tables
- Table 1: Global Hong Kong Payment Industry Revenue Million Forecast, by Region 2019 & 2032
- Table 2: Global Hong Kong Payment Industry Revenue Million Forecast, by Mode of Payment 2019 & 2032
- Table 3: Global Hong Kong Payment Industry Revenue Million Forecast, by End-user Industry 2019 & 2032
- Table 4: Global Hong Kong Payment Industry Revenue Million Forecast, by Region 2019 & 2032
- Table 5: Global Hong Kong Payment Industry Revenue Million Forecast, by Country 2019 & 2032
- Table 6: Global Hong Kong Payment Industry Revenue Million Forecast, by Mode of Payment 2019 & 2032
- Table 7: Global Hong Kong Payment Industry Revenue Million Forecast, by End-user Industry 2019 & 2032
- Table 8: Global Hong Kong Payment Industry Revenue Million Forecast, by Country 2019 & 2032
- Table 9: United States Hong Kong Payment Industry Revenue (Million) Forecast, by Application 2019 & 2032
- Table 10: Canada Hong Kong Payment Industry Revenue (Million) Forecast, by Application 2019 & 2032
- Table 11: Mexico Hong Kong Payment Industry Revenue (Million) Forecast, by Application 2019 & 2032
- Table 12: Global Hong Kong Payment Industry Revenue Million Forecast, by Mode of Payment 2019 & 2032
- Table 13: Global Hong Kong Payment Industry Revenue Million Forecast, by End-user Industry 2019 & 2032
- Table 14: Global Hong Kong Payment Industry Revenue Million Forecast, by Country 2019 & 2032
- Table 15: Brazil Hong Kong Payment Industry Revenue (Million) Forecast, by Application 2019 & 2032
- Table 16: Argentina Hong Kong Payment Industry Revenue (Million) Forecast, by Application 2019 & 2032
- Table 17: Rest of South America Hong Kong Payment Industry Revenue (Million) Forecast, by Application 2019 & 2032
- Table 18: Global Hong Kong Payment Industry Revenue Million Forecast, by Mode of Payment 2019 & 2032
- Table 19: Global Hong Kong Payment Industry Revenue Million Forecast, by End-user Industry 2019 & 2032
- Table 20: Global Hong Kong Payment Industry Revenue Million Forecast, by Country 2019 & 2032
- Table 21: United Kingdom Hong Kong Payment Industry Revenue (Million) Forecast, by Application 2019 & 2032
- Table 22: Germany Hong Kong Payment Industry Revenue (Million) Forecast, by Application 2019 & 2032
- Table 23: France Hong Kong Payment Industry Revenue (Million) Forecast, by Application 2019 & 2032
- Table 24: Italy Hong Kong Payment Industry Revenue (Million) Forecast, by Application 2019 & 2032
- Table 25: Spain Hong Kong Payment Industry Revenue (Million) Forecast, by Application 2019 & 2032
- Table 26: Russia Hong Kong Payment Industry Revenue (Million) Forecast, by Application 2019 & 2032
- Table 27: Benelux Hong Kong Payment Industry Revenue (Million) Forecast, by Application 2019 & 2032
- Table 28: Nordics Hong Kong Payment Industry Revenue (Million) Forecast, by Application 2019 & 2032
- Table 29: Rest of Europe Hong Kong Payment Industry Revenue (Million) Forecast, by Application 2019 & 2032
- Table 30: Global Hong Kong Payment Industry Revenue Million Forecast, by Mode of Payment 2019 & 2032
- Table 31: Global Hong Kong Payment Industry Revenue Million Forecast, by End-user Industry 2019 & 2032
- Table 32: Global Hong Kong Payment Industry Revenue Million Forecast, by Country 2019 & 2032
- Table 33: Turkey Hong Kong Payment Industry Revenue (Million) Forecast, by Application 2019 & 2032
- Table 34: Israel Hong Kong Payment Industry Revenue (Million) Forecast, by Application 2019 & 2032
- Table 35: GCC Hong Kong Payment Industry Revenue (Million) Forecast, by Application 2019 & 2032
- Table 36: North Africa Hong Kong Payment Industry Revenue (Million) Forecast, by Application 2019 & 2032
- Table 37: South Africa Hong Kong Payment Industry Revenue (Million) Forecast, by Application 2019 & 2032
- Table 38: Rest of Middle East & Africa Hong Kong Payment Industry Revenue (Million) Forecast, by Application 2019 & 2032
- Table 39: Global Hong Kong Payment Industry Revenue Million Forecast, by Mode of Payment 2019 & 2032
- Table 40: Global Hong Kong Payment Industry Revenue Million Forecast, by End-user Industry 2019 & 2032
- Table 41: Global Hong Kong Payment Industry Revenue Million Forecast, by Country 2019 & 2032
- Table 42: China Hong Kong Payment Industry Revenue (Million) Forecast, by Application 2019 & 2032
- Table 43: India Hong Kong Payment Industry Revenue (Million) Forecast, by Application 2019 & 2032
- Table 44: Japan Hong Kong Payment Industry Revenue (Million) Forecast, by Application 2019 & 2032
- Table 45: South Korea Hong Kong Payment Industry Revenue (Million) Forecast, by Application 2019 & 2032
- Table 46: ASEAN Hong Kong Payment Industry Revenue (Million) Forecast, by Application 2019 & 2032
- Table 47: Oceania Hong Kong Payment Industry Revenue (Million) Forecast, by Application 2019 & 2032
- Table 48: Rest of Asia Pacific Hong Kong Payment Industry Revenue (Million) Forecast, by Application 2019 & 2032
Frequently Asked Questions
1. What is the projected Compound Annual Growth Rate (CAGR) of the Hong Kong Payment Industry?
The projected CAGR is approximately 5.66%.
2. Which companies are prominent players in the Hong Kong Payment Industry?
Key companies in the market include Diners Club Internationa, Visa Inc, Standard Chartered Bank (HK) Limited, Citibank, HSBC, Bank of China, American Express Company, The Bank of East Asia Limited (BEA), Mastercard Incorporated, EPS Company.
3. What are the main segments of the Hong Kong Payment Industry?
The market segments include Mode of Payment, End-user Industry.
4. Can you provide details about the market size?
The market size is estimated to be USD 146.17 Million as of 2022.
5. What are some drivers contributing to market growth?
Integration of Payment Gateways; Initiatives by the Government to Advance in Digital Payments.
6. What are the notable trends driving market growth?
Card Payments to Hold Significant Share in Online Payment Sector.
7. Are there any restraints impacting market growth?
Rising Concern Regarding e-Waste.
8. Can you provide examples of recent developments in the market?
November 2023 - JCB and Stripe Expanded their Partnership to Europe, Singapore, and Hong Kong. As part of this expansion, Stripe added JCB to its default payment scheme for merchants in the United Kingdom and Ireland in August and for merchants in other European countries, Singapore and Hong Kong.
9. What pricing options are available for accessing the report?
Pricing options include single-user, multi-user, and enterprise licenses priced at USD 3800, USD 4500, and USD 5800 respectively.
10. Is the market size provided in terms of value or volume?
The market size is provided in terms of value, measured in Million.
11. Are there any specific market keywords associated with the report?
Yes, the market keyword associated with the report is "Hong Kong Payment Industry," which aids in identifying and referencing the specific market segment covered.
12. How do I determine which pricing option suits my needs best?
The pricing options vary based on user requirements and access needs. Individual users may opt for single-user licenses, while businesses requiring broader access may choose multi-user or enterprise licenses for cost-effective access to the report.
13. Are there any additional resources or data provided in the Hong Kong Payment Industry report?
While the report offers comprehensive insights, it's advisable to review the specific contents or supplementary materials provided to ascertain if additional resources or data are available.
14. How can I stay updated on further developments or reports in the Hong Kong Payment Industry?
To stay informed about further developments, trends, and reports in the Hong Kong Payment Industry, consider subscribing to industry newsletters, following relevant companies and organizations, or regularly checking reputable industry news sources and publications.
Methodology
Step 1 - Identification of Relevant Samples Size from Population Database


Step 2 - Approaches for Defining Global Market Size (Value, Volume* & Price*)

Note*: In applicable scenarios
Step 3 - Data Sources
Primary Research
- Web Analytics
- Survey Reports
- Research Institute
- Latest Research Reports
- Opinion Leaders
Secondary Research
- Annual Reports
- White Paper
- Latest Press Release
- Industry Association
- Paid Database
- Investor Presentations

Step 4 - Data Triangulation
Involves using different sources of information in order to increase the validity of a study
These sources are likely to be stakeholders in a program - participants, other researchers, program staff, other community members, and so on.
Then we put all data in single framework & apply various statistical tools to find out the dynamic on the market.
During the analysis stage, feedback from the stakeholder groups would be compared to determine areas of agreement as well as areas of divergence


