
Key Insights
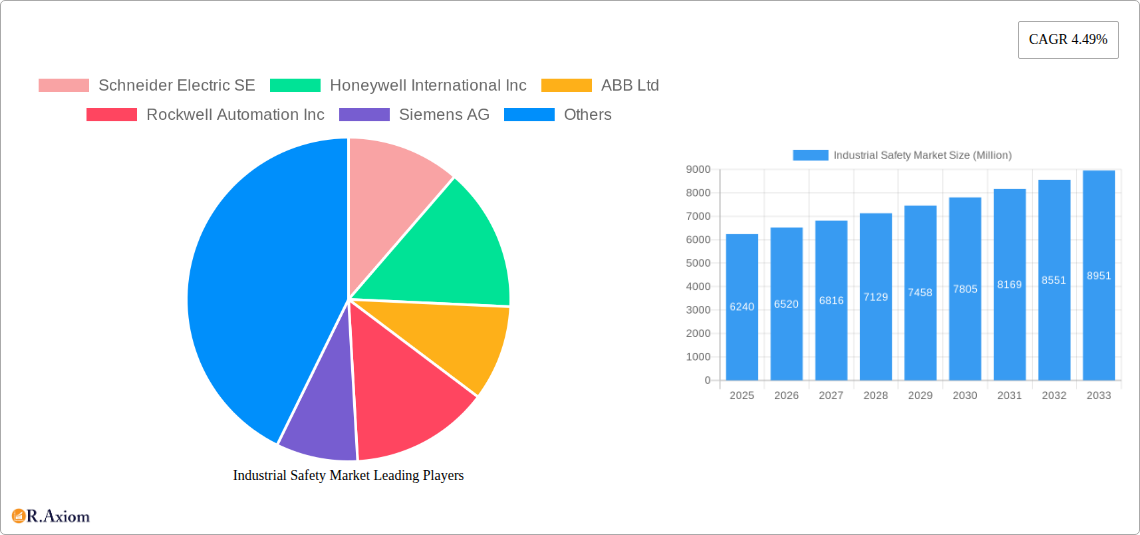
The global industrial safety market, valued at $6.24 billion in 2025, is projected to experience robust growth, driven by increasing industrial automation, stringent government regulations concerning workplace safety, and a rising awareness of the importance of worker protection across various sectors. The Compound Annual Growth Rate (CAGR) of 4.49% from 2025 to 2033 indicates a steady expansion, fueled by the adoption of advanced safety technologies such as machine vision systems, sensor-based safety solutions, and industrial safety software. Growth is further propelled by the demand for improved safety in hazardous environments like chemical plants and mining operations, alongside the expanding adoption of Industry 4.0 technologies that necessitate robust safety protocols. Key players like Schneider Electric, Honeywell, and ABB are continuously innovating and investing in R&D to enhance their product offerings and meet the rising demand for advanced safety systems. The market segmentation likely includes solutions for various industries (e.g., manufacturing, oil & gas, construction), different safety systems (e.g., personal protective equipment, machine safety, process safety), and geographical regions.
Despite the growth potential, the market faces challenges such as high initial investment costs associated with implementing advanced safety technologies, particularly for small and medium-sized enterprises (SMEs). Furthermore, the complexity of integrating different safety systems into existing infrastructure might hinder adoption in some cases. However, the increasing focus on risk management, the growing need for reducing workplace accidents and associated costs, and government incentives supporting safety improvements are expected to mitigate these challenges. The market's growth will be influenced by technological advancements, shifts in industrial automation practices, and the overall economic climate. The continued focus on improving worker safety will likely drive significant market expansion throughout the forecast period.
Industrial Safety Market: A Comprehensive Report (2019-2033)
This detailed report provides a comprehensive analysis of the Industrial Safety Market, covering market size, segmentation, growth drivers, challenges, key players, and future outlook. The study period spans from 2019 to 2033, with 2025 as the base and estimated year. The report offers actionable insights for industry stakeholders, investors, and businesses seeking to understand and capitalize on the evolving landscape of industrial safety.
Industrial Safety Market Concentration & Innovation
The Industrial Safety Market exhibits a moderately concentrated landscape, with several major players holding significant market share. The top ten companies—including Schneider Electric SE, Honeywell International Inc, ABB Ltd, Rockwell Automation Inc, Siemens AG, Emerson Electric Co, Baker Hughes, HIMA Paul Hildebrandt GmbH, Yokogawa Electric Corporation, and Omron Corporation—account for approximately xx% of the global market in 2025. However, the market also includes a considerable number of smaller, specialized players catering to niche segments.
Market share dynamics are influenced by factors such as technological innovation, M&A activity, and regulatory compliance. Recent years have witnessed several significant mergers and acquisitions, with deal values exceeding xx Million in some cases. These consolidations aim to expand product portfolios, enhance geographical reach, and gain a competitive edge. Innovation drives market growth, with companies investing heavily in R&D to develop advanced safety solutions, such as AI-powered systems and IoT-enabled monitoring devices. Stringent regulatory frameworks, particularly those related to occupational safety and health, significantly impact market trends and drive the adoption of advanced safety technologies. Furthermore, the increasing availability of product substitutes, along with evolving end-user preferences towards safer and more efficient solutions, are reshaping the competitive landscape.
Industrial Safety Market Industry Trends & Insights
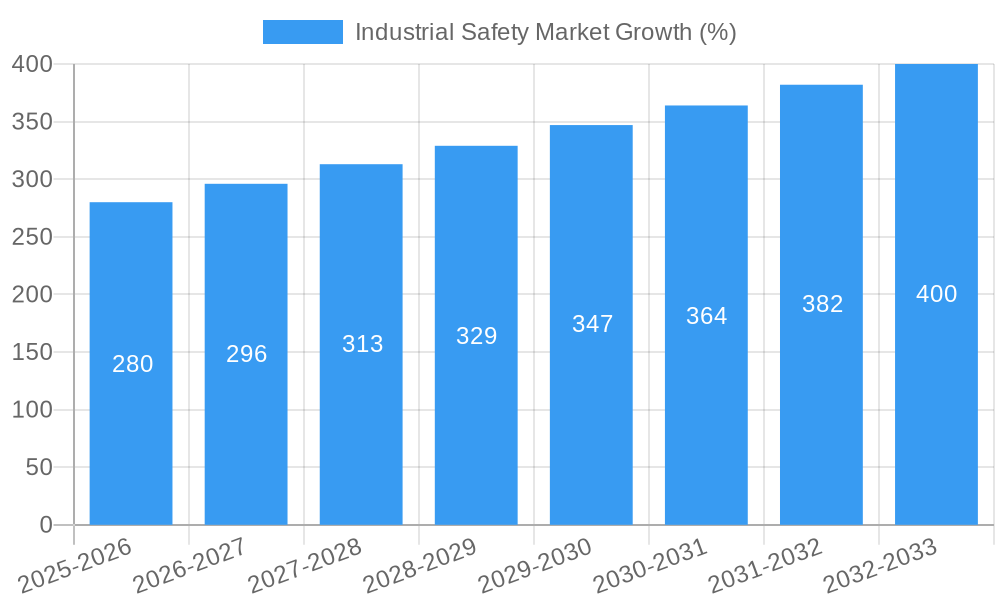
The Industrial Safety Market is experiencing robust growth, projected to reach xx Million by 2033, with a CAGR of xx% during the forecast period (2025-2033). This growth is driven by several factors including increasing industrial automation, stringent safety regulations, rising awareness of workplace safety, and technological advancements in sensor technologies, data analytics, and AI. Market penetration of advanced safety systems is also steadily increasing across various industries, especially in sectors with high-risk operations.
Technological disruptions, such as the emergence of Industry 4.0 and the Internet of Things (IoT), are fundamentally altering the industrial safety landscape. The adoption of smart sensors, predictive maintenance, and real-time monitoring systems is enhancing safety and efficiency. Consumer preferences are shifting towards integrated solutions that offer comprehensive safety coverage, seamless data integration, and user-friendly interfaces. The competitive dynamics are characterized by intense competition among established players and the emergence of innovative startups offering specialized safety solutions.
Dominant Markets & Segments in Industrial Safety Market
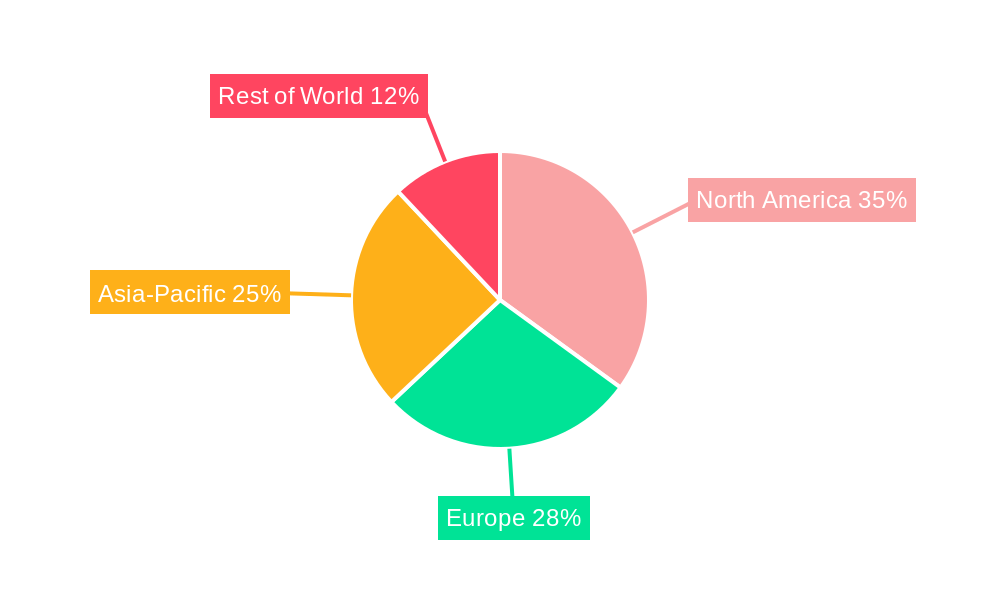
The North American region currently holds the largest market share in the Industrial Safety Market, driven by robust industrial growth, stringent regulatory compliance, and high investments in safety infrastructure. Within North America, the United States stands out as a dominant market.
- Key Drivers for North American Dominance:
- Strong industrial base and manufacturing sector.
- Stringent safety regulations and enforcement.
- High levels of investment in technological advancements.
- Increasing awareness of workplace safety and risk mitigation.
The European market is also a significant contributor, exhibiting substantial growth potential. Asia-Pacific is another rapidly expanding market, driven by increased industrialization and economic development across various countries.
Specific segment dominance varies based on factors like industry, application, and technology. Detailed segmental analysis is included in the full report, showcasing growth projections, market sizes, and competitive dynamics.
Industrial Safety Market Product Developments
Recent product innovations in the industrial safety market focus on enhancing safety, efficiency, and connectivity. New products include advanced sensors with improved accuracy and reliability, IoT-enabled safety systems providing real-time monitoring and data analysis, and AI-powered solutions enabling predictive maintenance and risk assessment. These developments cater to the growing demand for sophisticated safety solutions that improve operational efficiency and reduce the risk of accidents. The market is witnessing a trend toward integrated safety systems that seamlessly integrate with existing industrial automation infrastructure.
Report Scope & Segmentation Analysis
This report segments the Industrial Safety Market by various parameters, including product type (personal protective equipment, safety systems, etc.), application (oil & gas, manufacturing, construction, etc.), and region. Each segment is analyzed in detail, covering growth projections, market size estimates, and competitive dynamics. Detailed segment-wise analysis is provided in the full report.
Key Drivers of Industrial Safety Market Growth
Several factors contribute to the growth of the Industrial Safety Market. These include:
- Stringent government regulations: Governments worldwide are implementing increasingly stringent safety regulations, mandating the adoption of safety technologies and practices.
- Rising awareness of workplace safety: Increased awareness of occupational hazards and their impact is driving demand for better safety solutions.
- Technological advancements: Innovations in sensor technologies, data analytics, and AI are leading to the development of sophisticated and effective safety systems.
- Increasing industrial automation: Automation increases the need for advanced safety systems to protect workers and equipment.
Challenges in the Industrial Safety Market Sector
The Industrial Safety Market faces several challenges:
- High initial investment costs: Implementing advanced safety systems can require significant upfront investment.
- Integration complexities: Integrating new safety systems into existing infrastructure can be complex and time-consuming.
- Lack of skilled workforce: A shortage of skilled professionals to install, maintain, and operate advanced safety systems poses a challenge.
- Cybersecurity concerns: The increasing connectivity of safety systems raises concerns about cybersecurity vulnerabilities.
Emerging Opportunities in Industrial Safety Market
The Industrial Safety Market presents several promising opportunities:
- Growth in emerging economies: Rapid industrialization in developing countries offers significant growth potential.
- Adoption of advanced technologies: The integration of AI, IoT, and big data analytics offers opportunities for innovative safety solutions.
- Focus on predictive maintenance: Predictive maintenance solutions can help prevent accidents and reduce downtime.
- Demand for customized solutions: The need for tailored safety solutions for specific industries and applications presents opportunities for specialized players.
Leading Players in the Industrial Safety Market Market
- Schneider Electric SE
- Honeywell International Inc
- ABB Ltd
- Rockwell Automation Inc
- Siemens AG
- Emerson Electric Co
- Baker Hughes
- HIMA Paul Hildebrandt GmbH
- Yokogawa Electric Corporation
- Omron Corporation
- Johnson Controls
- Balluff GmbH
- Keyence Corporation
- IDEC Corporation
- SICK AG
- Mitsubishi Electric
- Banner Engineering
- Fortress Interlocks
- Automation Inc
Key Developments in Industrial Safety Market Industry
- April 2024: Emerson launched the ASCO Series 148/149 safety valve and motorized actuator, enhancing safety in industrial fuel oil burner systems.
- January 2024: MKS Instruments Inc. received TÜV Rheinland certification for its programmable safety interlock solution, improving design flexibility and safety standards.
Strategic Outlook for Industrial Safety Market Market
The Industrial Safety Market is poised for continued growth, driven by technological advancements, increasing regulatory pressure, and rising awareness of workplace safety. Future opportunities lie in the development and adoption of AI-powered predictive maintenance, enhanced cybersecurity measures for connected safety systems, and the expansion into emerging markets. Companies that invest in innovation, strategic partnerships, and robust supply chains will be best positioned to capitalize on the market's future potential.
Industrial Safety Market Segmentation
-
1. Component
- 1.1. Safety Sensors
- 1.2. Safety Controllers/Relays
- 1.3. Safety Valves
- 1.4. Other Components
-
2. Safety System
- 2.1. Emergency Shutdown Systems (ESD)
- 2.2. Fire and Gas Monitoring Systems
- 2.3. High Integrity Pressure Protection Systems (HIPPS)
- 2.4. Burner Management Systems (BMS)
- 2.5. Other Safety Systems
-
3. End-user Industry
- 3.1. Aerospace and Defense
- 3.2. Oil and Gas
- 3.3. Automotive
- 3.4. Energy and Power
- 3.5. Metals and Mining
- 3.6. Pharmaceutical and Healthcare
- 3.7. Food and Beverage
- 3.8. Chemical and Petrochemical
- 3.9. Other End-user Industries
Industrial Safety Market Segmentation By Geography
- 1. North America
- 2. Europe
- 3. Asia
- 4. Australia and New Zealand
- 5. Latin America
- 6. Middle East
Industrial Safety Market REPORT HIGHLIGHTS
| Aspects | Details |
|---|---|
| Study Period | 2019-2033 |
| Base Year | 2024 |
| Estimated Year | 2025 |
| Forecast Period | 2025-2033 |
| Historical Period | 2019-2024 |
| Growth Rate | CAGR of 4.49% from 2019-2033 |
| Segmentation |
|
Table of Contents
- 1. Introduction
- 1.1. Research Scope
- 1.2. Market Segmentation
- 1.3. Research Methodology
- 1.4. Definitions and Assumptions
- 2. Executive Summary
- 2.1. Introduction
- 3. Market Dynamics
- 3.1. Introduction
- 3.2. Market Drivers
- 3.2.1 Increasing Regulatory Environment in the Industry will Drive the Market Growth; The Rising Adoption of Automation
- 3.2.2 Robotics
- 3.2.3 and IoT will Increase the Demand for Industrial Safety
- 3.3. Market Restrains
- 3.3.1 Increasing Regulatory Environment in the Industry will Drive the Market Growth; The Rising Adoption of Automation
- 3.3.2 Robotics
- 3.3.3 and IoT will Increase the Demand for Industrial Safety
- 3.4. Market Trends
- 3.4.1. Safety Sensors Segment is Expected to Hold Significant Market Share
- 4. Market Factor Analysis
- 4.1. Porters Five Forces
- 4.2. Supply/Value Chain
- 4.3. PESTEL analysis
- 4.4. Market Entropy
- 4.5. Patent/Trademark Analysis
- 5. Global Industrial Safety Market Analysis, Insights and Forecast, 2019-2031
- 5.1. Market Analysis, Insights and Forecast - by Component
- 5.1.1. Safety Sensors
- 5.1.2. Safety Controllers/Relays
- 5.1.3. Safety Valves
- 5.1.4. Other Components
- 5.2. Market Analysis, Insights and Forecast - by Safety System
- 5.2.1. Emergency Shutdown Systems (ESD)
- 5.2.2. Fire and Gas Monitoring Systems
- 5.2.3. High Integrity Pressure Protection Systems (HIPPS)
- 5.2.4. Burner Management Systems (BMS)
- 5.2.5. Other Safety Systems
- 5.3. Market Analysis, Insights and Forecast - by End-user Industry
- 5.3.1. Aerospace and Defense
- 5.3.2. Oil and Gas
- 5.3.3. Automotive
- 5.3.4. Energy and Power
- 5.3.5. Metals and Mining
- 5.3.6. Pharmaceutical and Healthcare
- 5.3.7. Food and Beverage
- 5.3.8. Chemical and Petrochemical
- 5.3.9. Other End-user Industries
- 5.4. Market Analysis, Insights and Forecast - by Region
- 5.4.1. North America
- 5.4.2. Europe
- 5.4.3. Asia
- 5.4.4. Australia and New Zealand
- 5.4.5. Latin America
- 5.4.6. Middle East
- 5.1. Market Analysis, Insights and Forecast - by Component
- 6. North America Industrial Safety Market Analysis, Insights and Forecast, 2019-2031
- 6.1. Market Analysis, Insights and Forecast - by Component
- 6.1.1. Safety Sensors
- 6.1.2. Safety Controllers/Relays
- 6.1.3. Safety Valves
- 6.1.4. Other Components
- 6.2. Market Analysis, Insights and Forecast - by Safety System
- 6.2.1. Emergency Shutdown Systems (ESD)
- 6.2.2. Fire and Gas Monitoring Systems
- 6.2.3. High Integrity Pressure Protection Systems (HIPPS)
- 6.2.4. Burner Management Systems (BMS)
- 6.2.5. Other Safety Systems
- 6.3. Market Analysis, Insights and Forecast - by End-user Industry
- 6.3.1. Aerospace and Defense
- 6.3.2. Oil and Gas
- 6.3.3. Automotive
- 6.3.4. Energy and Power
- 6.3.5. Metals and Mining
- 6.3.6. Pharmaceutical and Healthcare
- 6.3.7. Food and Beverage
- 6.3.8. Chemical and Petrochemical
- 6.3.9. Other End-user Industries
- 6.1. Market Analysis, Insights and Forecast - by Component
- 7. Europe Industrial Safety Market Analysis, Insights and Forecast, 2019-2031
- 7.1. Market Analysis, Insights and Forecast - by Component
- 7.1.1. Safety Sensors
- 7.1.2. Safety Controllers/Relays
- 7.1.3. Safety Valves
- 7.1.4. Other Components
- 7.2. Market Analysis, Insights and Forecast - by Safety System
- 7.2.1. Emergency Shutdown Systems (ESD)
- 7.2.2. Fire and Gas Monitoring Systems
- 7.2.3. High Integrity Pressure Protection Systems (HIPPS)
- 7.2.4. Burner Management Systems (BMS)
- 7.2.5. Other Safety Systems
- 7.3. Market Analysis, Insights and Forecast - by End-user Industry
- 7.3.1. Aerospace and Defense
- 7.3.2. Oil and Gas
- 7.3.3. Automotive
- 7.3.4. Energy and Power
- 7.3.5. Metals and Mining
- 7.3.6. Pharmaceutical and Healthcare
- 7.3.7. Food and Beverage
- 7.3.8. Chemical and Petrochemical
- 7.3.9. Other End-user Industries
- 7.1. Market Analysis, Insights and Forecast - by Component
- 8. Asia Industrial Safety Market Analysis, Insights and Forecast, 2019-2031
- 8.1. Market Analysis, Insights and Forecast - by Component
- 8.1.1. Safety Sensors
- 8.1.2. Safety Controllers/Relays
- 8.1.3. Safety Valves
- 8.1.4. Other Components
- 8.2. Market Analysis, Insights and Forecast - by Safety System
- 8.2.1. Emergency Shutdown Systems (ESD)
- 8.2.2. Fire and Gas Monitoring Systems
- 8.2.3. High Integrity Pressure Protection Systems (HIPPS)
- 8.2.4. Burner Management Systems (BMS)
- 8.2.5. Other Safety Systems
- 8.3. Market Analysis, Insights and Forecast - by End-user Industry
- 8.3.1. Aerospace and Defense
- 8.3.2. Oil and Gas
- 8.3.3. Automotive
- 8.3.4. Energy and Power
- 8.3.5. Metals and Mining
- 8.3.6. Pharmaceutical and Healthcare
- 8.3.7. Food and Beverage
- 8.3.8. Chemical and Petrochemical
- 8.3.9. Other End-user Industries
- 8.1. Market Analysis, Insights and Forecast - by Component
- 9. Australia and New Zealand Industrial Safety Market Analysis, Insights and Forecast, 2019-2031
- 9.1. Market Analysis, Insights and Forecast - by Component
- 9.1.1. Safety Sensors
- 9.1.2. Safety Controllers/Relays
- 9.1.3. Safety Valves
- 9.1.4. Other Components
- 9.2. Market Analysis, Insights and Forecast - by Safety System
- 9.2.1. Emergency Shutdown Systems (ESD)
- 9.2.2. Fire and Gas Monitoring Systems
- 9.2.3. High Integrity Pressure Protection Systems (HIPPS)
- 9.2.4. Burner Management Systems (BMS)
- 9.2.5. Other Safety Systems
- 9.3. Market Analysis, Insights and Forecast - by End-user Industry
- 9.3.1. Aerospace and Defense
- 9.3.2. Oil and Gas
- 9.3.3. Automotive
- 9.3.4. Energy and Power
- 9.3.5. Metals and Mining
- 9.3.6. Pharmaceutical and Healthcare
- 9.3.7. Food and Beverage
- 9.3.8. Chemical and Petrochemical
- 9.3.9. Other End-user Industries
- 9.1. Market Analysis, Insights and Forecast - by Component
- 10. Latin America Industrial Safety Market Analysis, Insights and Forecast, 2019-2031
- 10.1. Market Analysis, Insights and Forecast - by Component
- 10.1.1. Safety Sensors
- 10.1.2. Safety Controllers/Relays
- 10.1.3. Safety Valves
- 10.1.4. Other Components
- 10.2. Market Analysis, Insights and Forecast - by Safety System
- 10.2.1. Emergency Shutdown Systems (ESD)
- 10.2.2. Fire and Gas Monitoring Systems
- 10.2.3. High Integrity Pressure Protection Systems (HIPPS)
- 10.2.4. Burner Management Systems (BMS)
- 10.2.5. Other Safety Systems
- 10.3. Market Analysis, Insights and Forecast - by End-user Industry
- 10.3.1. Aerospace and Defense
- 10.3.2. Oil and Gas
- 10.3.3. Automotive
- 10.3.4. Energy and Power
- 10.3.5. Metals and Mining
- 10.3.6. Pharmaceutical and Healthcare
- 10.3.7. Food and Beverage
- 10.3.8. Chemical and Petrochemical
- 10.3.9. Other End-user Industries
- 10.1. Market Analysis, Insights and Forecast - by Component
- 11. Middle East Industrial Safety Market Analysis, Insights and Forecast, 2019-2031
- 11.1. Market Analysis, Insights and Forecast - by Component
- 11.1.1. Safety Sensors
- 11.1.2. Safety Controllers/Relays
- 11.1.3. Safety Valves
- 11.1.4. Other Components
- 11.2. Market Analysis, Insights and Forecast - by Safety System
- 11.2.1. Emergency Shutdown Systems (ESD)
- 11.2.2. Fire and Gas Monitoring Systems
- 11.2.3. High Integrity Pressure Protection Systems (HIPPS)
- 11.2.4. Burner Management Systems (BMS)
- 11.2.5. Other Safety Systems
- 11.3. Market Analysis, Insights and Forecast - by End-user Industry
- 11.3.1. Aerospace and Defense
- 11.3.2. Oil and Gas
- 11.3.3. Automotive
- 11.3.4. Energy and Power
- 11.3.5. Metals and Mining
- 11.3.6. Pharmaceutical and Healthcare
- 11.3.7. Food and Beverage
- 11.3.8. Chemical and Petrochemical
- 11.3.9. Other End-user Industries
- 11.1. Market Analysis, Insights and Forecast - by Component
- 12. Competitive Analysis
- 12.1. Global Market Share Analysis 2024
- 12.2. Company Profiles
- 12.2.1 Schneider Electric SE
- 12.2.1.1. Overview
- 12.2.1.2. Products
- 12.2.1.3. SWOT Analysis
- 12.2.1.4. Recent Developments
- 12.2.1.5. Financials (Based on Availability)
- 12.2.2 Honeywell International Inc
- 12.2.2.1. Overview
- 12.2.2.2. Products
- 12.2.2.3. SWOT Analysis
- 12.2.2.4. Recent Developments
- 12.2.2.5. Financials (Based on Availability)
- 12.2.3 ABB Ltd
- 12.2.3.1. Overview
- 12.2.3.2. Products
- 12.2.3.3. SWOT Analysis
- 12.2.3.4. Recent Developments
- 12.2.3.5. Financials (Based on Availability)
- 12.2.4 Rockwell Automation Inc
- 12.2.4.1. Overview
- 12.2.4.2. Products
- 12.2.4.3. SWOT Analysis
- 12.2.4.4. Recent Developments
- 12.2.4.5. Financials (Based on Availability)
- 12.2.5 Siemens AG
- 12.2.5.1. Overview
- 12.2.5.2. Products
- 12.2.5.3. SWOT Analysis
- 12.2.5.4. Recent Developments
- 12.2.5.5. Financials (Based on Availability)
- 12.2.6 Emerson Electric Co
- 12.2.6.1. Overview
- 12.2.6.2. Products
- 12.2.6.3. SWOT Analysis
- 12.2.6.4. Recent Developments
- 12.2.6.5. Financials (Based on Availability)
- 12.2.7 Baker Hughes
- 12.2.7.1. Overview
- 12.2.7.2. Products
- 12.2.7.3. SWOT Analysis
- 12.2.7.4. Recent Developments
- 12.2.7.5. Financials (Based on Availability)
- 12.2.8 HIMA Paul Hildebrandt GmbH
- 12.2.8.1. Overview
- 12.2.8.2. Products
- 12.2.8.3. SWOT Analysis
- 12.2.8.4. Recent Developments
- 12.2.8.5. Financials (Based on Availability)
- 12.2.9 Yokogawa Electric Corporation
- 12.2.9.1. Overview
- 12.2.9.2. Products
- 12.2.9.3. SWOT Analysis
- 12.2.9.4. Recent Developments
- 12.2.9.5. Financials (Based on Availability)
- 12.2.10 Omron Corporation
- 12.2.10.1. Overview
- 12.2.10.2. Products
- 12.2.10.3. SWOT Analysis
- 12.2.10.4. Recent Developments
- 12.2.10.5. Financials (Based on Availability)
- 12.2.11 Johnson Controls
- 12.2.11.1. Overview
- 12.2.11.2. Products
- 12.2.11.3. SWOT Analysis
- 12.2.11.4. Recent Developments
- 12.2.11.5. Financials (Based on Availability)
- 12.2.12 Balluff GmbH
- 12.2.12.1. Overview
- 12.2.12.2. Products
- 12.2.12.3. SWOT Analysis
- 12.2.12.4. Recent Developments
- 12.2.12.5. Financials (Based on Availability)
- 12.2.13 Keyence Corporation
- 12.2.13.1. Overview
- 12.2.13.2. Products
- 12.2.13.3. SWOT Analysis
- 12.2.13.4. Recent Developments
- 12.2.13.5. Financials (Based on Availability)
- 12.2.14 IDEC Corporation
- 12.2.14.1. Overview
- 12.2.14.2. Products
- 12.2.14.3. SWOT Analysis
- 12.2.14.4. Recent Developments
- 12.2.14.5. Financials (Based on Availability)
- 12.2.15 SICK AG
- 12.2.15.1. Overview
- 12.2.15.2. Products
- 12.2.15.3. SWOT Analysis
- 12.2.15.4. Recent Developments
- 12.2.15.5. Financials (Based on Availability)
- 12.2.16 Mitsubishi Electric
- 12.2.16.1. Overview
- 12.2.16.2. Products
- 12.2.16.3. SWOT Analysis
- 12.2.16.4. Recent Developments
- 12.2.16.5. Financials (Based on Availability)
- 12.2.17 Banner Engineering
- 12.2.17.1. Overview
- 12.2.17.2. Products
- 12.2.17.3. SWOT Analysis
- 12.2.17.4. Recent Developments
- 12.2.17.5. Financials (Based on Availability)
- 12.2.18 Fortress Interlocks
- 12.2.18.1. Overview
- 12.2.18.2. Products
- 12.2.18.3. SWOT Analysis
- 12.2.18.4. Recent Developments
- 12.2.18.5. Financials (Based on Availability)
- 12.2.19 Automation Inc
- 12.2.19.1. Overview
- 12.2.19.2. Products
- 12.2.19.3. SWOT Analysis
- 12.2.19.4. Recent Developments
- 12.2.19.5. Financials (Based on Availability)
- 12.2.1 Schneider Electric SE
List of Figures
- Figure 1: Global Industrial Safety Market Revenue Breakdown (Million, %) by Region 2024 & 2032
- Figure 2: Global Industrial Safety Market Volume Breakdown (Billion, %) by Region 2024 & 2032
- Figure 3: North America Industrial Safety Market Revenue (Million), by Component 2024 & 2032
- Figure 4: North America Industrial Safety Market Volume (Billion), by Component 2024 & 2032
- Figure 5: North America Industrial Safety Market Revenue Share (%), by Component 2024 & 2032
- Figure 6: North America Industrial Safety Market Volume Share (%), by Component 2024 & 2032
- Figure 7: North America Industrial Safety Market Revenue (Million), by Safety System 2024 & 2032
- Figure 8: North America Industrial Safety Market Volume (Billion), by Safety System 2024 & 2032
- Figure 9: North America Industrial Safety Market Revenue Share (%), by Safety System 2024 & 2032
- Figure 10: North America Industrial Safety Market Volume Share (%), by Safety System 2024 & 2032
- Figure 11: North America Industrial Safety Market Revenue (Million), by End-user Industry 2024 & 2032
- Figure 12: North America Industrial Safety Market Volume (Billion), by End-user Industry 2024 & 2032
- Figure 13: North America Industrial Safety Market Revenue Share (%), by End-user Industry 2024 & 2032
- Figure 14: North America Industrial Safety Market Volume Share (%), by End-user Industry 2024 & 2032
- Figure 15: North America Industrial Safety Market Revenue (Million), by Country 2024 & 2032
- Figure 16: North America Industrial Safety Market Volume (Billion), by Country 2024 & 2032
- Figure 17: North America Industrial Safety Market Revenue Share (%), by Country 2024 & 2032
- Figure 18: North America Industrial Safety Market Volume Share (%), by Country 2024 & 2032
- Figure 19: Europe Industrial Safety Market Revenue (Million), by Component 2024 & 2032
- Figure 20: Europe Industrial Safety Market Volume (Billion), by Component 2024 & 2032
- Figure 21: Europe Industrial Safety Market Revenue Share (%), by Component 2024 & 2032
- Figure 22: Europe Industrial Safety Market Volume Share (%), by Component 2024 & 2032
- Figure 23: Europe Industrial Safety Market Revenue (Million), by Safety System 2024 & 2032
- Figure 24: Europe Industrial Safety Market Volume (Billion), by Safety System 2024 & 2032
- Figure 25: Europe Industrial Safety Market Revenue Share (%), by Safety System 2024 & 2032
- Figure 26: Europe Industrial Safety Market Volume Share (%), by Safety System 2024 & 2032
- Figure 27: Europe Industrial Safety Market Revenue (Million), by End-user Industry 2024 & 2032
- Figure 28: Europe Industrial Safety Market Volume (Billion), by End-user Industry 2024 & 2032
- Figure 29: Europe Industrial Safety Market Revenue Share (%), by End-user Industry 2024 & 2032
- Figure 30: Europe Industrial Safety Market Volume Share (%), by End-user Industry 2024 & 2032
- Figure 31: Europe Industrial Safety Market Revenue (Million), by Country 2024 & 2032
- Figure 32: Europe Industrial Safety Market Volume (Billion), by Country 2024 & 2032
- Figure 33: Europe Industrial Safety Market Revenue Share (%), by Country 2024 & 2032
- Figure 34: Europe Industrial Safety Market Volume Share (%), by Country 2024 & 2032
- Figure 35: Asia Industrial Safety Market Revenue (Million), by Component 2024 & 2032
- Figure 36: Asia Industrial Safety Market Volume (Billion), by Component 2024 & 2032
- Figure 37: Asia Industrial Safety Market Revenue Share (%), by Component 2024 & 2032
- Figure 38: Asia Industrial Safety Market Volume Share (%), by Component 2024 & 2032
- Figure 39: Asia Industrial Safety Market Revenue (Million), by Safety System 2024 & 2032
- Figure 40: Asia Industrial Safety Market Volume (Billion), by Safety System 2024 & 2032
- Figure 41: Asia Industrial Safety Market Revenue Share (%), by Safety System 2024 & 2032
- Figure 42: Asia Industrial Safety Market Volume Share (%), by Safety System 2024 & 2032
- Figure 43: Asia Industrial Safety Market Revenue (Million), by End-user Industry 2024 & 2032
- Figure 44: Asia Industrial Safety Market Volume (Billion), by End-user Industry 2024 & 2032
- Figure 45: Asia Industrial Safety Market Revenue Share (%), by End-user Industry 2024 & 2032
- Figure 46: Asia Industrial Safety Market Volume Share (%), by End-user Industry 2024 & 2032
- Figure 47: Asia Industrial Safety Market Revenue (Million), by Country 2024 & 2032
- Figure 48: Asia Industrial Safety Market Volume (Billion), by Country 2024 & 2032
- Figure 49: Asia Industrial Safety Market Revenue Share (%), by Country 2024 & 2032
- Figure 50: Asia Industrial Safety Market Volume Share (%), by Country 2024 & 2032
- Figure 51: Australia and New Zealand Industrial Safety Market Revenue (Million), by Component 2024 & 2032
- Figure 52: Australia and New Zealand Industrial Safety Market Volume (Billion), by Component 2024 & 2032
- Figure 53: Australia and New Zealand Industrial Safety Market Revenue Share (%), by Component 2024 & 2032
- Figure 54: Australia and New Zealand Industrial Safety Market Volume Share (%), by Component 2024 & 2032
- Figure 55: Australia and New Zealand Industrial Safety Market Revenue (Million), by Safety System 2024 & 2032
- Figure 56: Australia and New Zealand Industrial Safety Market Volume (Billion), by Safety System 2024 & 2032
- Figure 57: Australia and New Zealand Industrial Safety Market Revenue Share (%), by Safety System 2024 & 2032
- Figure 58: Australia and New Zealand Industrial Safety Market Volume Share (%), by Safety System 2024 & 2032
- Figure 59: Australia and New Zealand Industrial Safety Market Revenue (Million), by End-user Industry 2024 & 2032
- Figure 60: Australia and New Zealand Industrial Safety Market Volume (Billion), by End-user Industry 2024 & 2032
- Figure 61: Australia and New Zealand Industrial Safety Market Revenue Share (%), by End-user Industry 2024 & 2032
- Figure 62: Australia and New Zealand Industrial Safety Market Volume Share (%), by End-user Industry 2024 & 2032
- Figure 63: Australia and New Zealand Industrial Safety Market Revenue (Million), by Country 2024 & 2032
- Figure 64: Australia and New Zealand Industrial Safety Market Volume (Billion), by Country 2024 & 2032
- Figure 65: Australia and New Zealand Industrial Safety Market Revenue Share (%), by Country 2024 & 2032
- Figure 66: Australia and New Zealand Industrial Safety Market Volume Share (%), by Country 2024 & 2032
- Figure 67: Latin America Industrial Safety Market Revenue (Million), by Component 2024 & 2032
- Figure 68: Latin America Industrial Safety Market Volume (Billion), by Component 2024 & 2032
- Figure 69: Latin America Industrial Safety Market Revenue Share (%), by Component 2024 & 2032
- Figure 70: Latin America Industrial Safety Market Volume Share (%), by Component 2024 & 2032
- Figure 71: Latin America Industrial Safety Market Revenue (Million), by Safety System 2024 & 2032
- Figure 72: Latin America Industrial Safety Market Volume (Billion), by Safety System 2024 & 2032
- Figure 73: Latin America Industrial Safety Market Revenue Share (%), by Safety System 2024 & 2032
- Figure 74: Latin America Industrial Safety Market Volume Share (%), by Safety System 2024 & 2032
- Figure 75: Latin America Industrial Safety Market Revenue (Million), by End-user Industry 2024 & 2032
- Figure 76: Latin America Industrial Safety Market Volume (Billion), by End-user Industry 2024 & 2032
- Figure 77: Latin America Industrial Safety Market Revenue Share (%), by End-user Industry 2024 & 2032
- Figure 78: Latin America Industrial Safety Market Volume Share (%), by End-user Industry 2024 & 2032
- Figure 79: Latin America Industrial Safety Market Revenue (Million), by Country 2024 & 2032
- Figure 80: Latin America Industrial Safety Market Volume (Billion), by Country 2024 & 2032
- Figure 81: Latin America Industrial Safety Market Revenue Share (%), by Country 2024 & 2032
- Figure 82: Latin America Industrial Safety Market Volume Share (%), by Country 2024 & 2032
- Figure 83: Middle East Industrial Safety Market Revenue (Million), by Component 2024 & 2032
- Figure 84: Middle East Industrial Safety Market Volume (Billion), by Component 2024 & 2032
- Figure 85: Middle East Industrial Safety Market Revenue Share (%), by Component 2024 & 2032
- Figure 86: Middle East Industrial Safety Market Volume Share (%), by Component 2024 & 2032
- Figure 87: Middle East Industrial Safety Market Revenue (Million), by Safety System 2024 & 2032
- Figure 88: Middle East Industrial Safety Market Volume (Billion), by Safety System 2024 & 2032
- Figure 89: Middle East Industrial Safety Market Revenue Share (%), by Safety System 2024 & 2032
- Figure 90: Middle East Industrial Safety Market Volume Share (%), by Safety System 2024 & 2032
- Figure 91: Middle East Industrial Safety Market Revenue (Million), by End-user Industry 2024 & 2032
- Figure 92: Middle East Industrial Safety Market Volume (Billion), by End-user Industry 2024 & 2032
- Figure 93: Middle East Industrial Safety Market Revenue Share (%), by End-user Industry 2024 & 2032
- Figure 94: Middle East Industrial Safety Market Volume Share (%), by End-user Industry 2024 & 2032
- Figure 95: Middle East Industrial Safety Market Revenue (Million), by Country 2024 & 2032
- Figure 96: Middle East Industrial Safety Market Volume (Billion), by Country 2024 & 2032
- Figure 97: Middle East Industrial Safety Market Revenue Share (%), by Country 2024 & 2032
- Figure 98: Middle East Industrial Safety Market Volume Share (%), by Country 2024 & 2032
List of Tables
- Table 1: Global Industrial Safety Market Revenue Million Forecast, by Region 2019 & 2032
- Table 2: Global Industrial Safety Market Volume Billion Forecast, by Region 2019 & 2032
- Table 3: Global Industrial Safety Market Revenue Million Forecast, by Component 2019 & 2032
- Table 4: Global Industrial Safety Market Volume Billion Forecast, by Component 2019 & 2032
- Table 5: Global Industrial Safety Market Revenue Million Forecast, by Safety System 2019 & 2032
- Table 6: Global Industrial Safety Market Volume Billion Forecast, by Safety System 2019 & 2032
- Table 7: Global Industrial Safety Market Revenue Million Forecast, by End-user Industry 2019 & 2032
- Table 8: Global Industrial Safety Market Volume Billion Forecast, by End-user Industry 2019 & 2032
- Table 9: Global Industrial Safety Market Revenue Million Forecast, by Region 2019 & 2032
- Table 10: Global Industrial Safety Market Volume Billion Forecast, by Region 2019 & 2032
- Table 11: Global Industrial Safety Market Revenue Million Forecast, by Component 2019 & 2032
- Table 12: Global Industrial Safety Market Volume Billion Forecast, by Component 2019 & 2032
- Table 13: Global Industrial Safety Market Revenue Million Forecast, by Safety System 2019 & 2032
- Table 14: Global Industrial Safety Market Volume Billion Forecast, by Safety System 2019 & 2032
- Table 15: Global Industrial Safety Market Revenue Million Forecast, by End-user Industry 2019 & 2032
- Table 16: Global Industrial Safety Market Volume Billion Forecast, by End-user Industry 2019 & 2032
- Table 17: Global Industrial Safety Market Revenue Million Forecast, by Country 2019 & 2032
- Table 18: Global Industrial Safety Market Volume Billion Forecast, by Country 2019 & 2032
- Table 19: Global Industrial Safety Market Revenue Million Forecast, by Component 2019 & 2032
- Table 20: Global Industrial Safety Market Volume Billion Forecast, by Component 2019 & 2032
- Table 21: Global Industrial Safety Market Revenue Million Forecast, by Safety System 2019 & 2032
- Table 22: Global Industrial Safety Market Volume Billion Forecast, by Safety System 2019 & 2032
- Table 23: Global Industrial Safety Market Revenue Million Forecast, by End-user Industry 2019 & 2032
- Table 24: Global Industrial Safety Market Volume Billion Forecast, by End-user Industry 2019 & 2032
- Table 25: Global Industrial Safety Market Revenue Million Forecast, by Country 2019 & 2032
- Table 26: Global Industrial Safety Market Volume Billion Forecast, by Country 2019 & 2032
- Table 27: Global Industrial Safety Market Revenue Million Forecast, by Component 2019 & 2032
- Table 28: Global Industrial Safety Market Volume Billion Forecast, by Component 2019 & 2032
- Table 29: Global Industrial Safety Market Revenue Million Forecast, by Safety System 2019 & 2032
- Table 30: Global Industrial Safety Market Volume Billion Forecast, by Safety System 2019 & 2032
- Table 31: Global Industrial Safety Market Revenue Million Forecast, by End-user Industry 2019 & 2032
- Table 32: Global Industrial Safety Market Volume Billion Forecast, by End-user Industry 2019 & 2032
- Table 33: Global Industrial Safety Market Revenue Million Forecast, by Country 2019 & 2032
- Table 34: Global Industrial Safety Market Volume Billion Forecast, by Country 2019 & 2032
- Table 35: Global Industrial Safety Market Revenue Million Forecast, by Component 2019 & 2032
- Table 36: Global Industrial Safety Market Volume Billion Forecast, by Component 2019 & 2032
- Table 37: Global Industrial Safety Market Revenue Million Forecast, by Safety System 2019 & 2032
- Table 38: Global Industrial Safety Market Volume Billion Forecast, by Safety System 2019 & 2032
- Table 39: Global Industrial Safety Market Revenue Million Forecast, by End-user Industry 2019 & 2032
- Table 40: Global Industrial Safety Market Volume Billion Forecast, by End-user Industry 2019 & 2032
- Table 41: Global Industrial Safety Market Revenue Million Forecast, by Country 2019 & 2032
- Table 42: Global Industrial Safety Market Volume Billion Forecast, by Country 2019 & 2032
- Table 43: Global Industrial Safety Market Revenue Million Forecast, by Component 2019 & 2032
- Table 44: Global Industrial Safety Market Volume Billion Forecast, by Component 2019 & 2032
- Table 45: Global Industrial Safety Market Revenue Million Forecast, by Safety System 2019 & 2032
- Table 46: Global Industrial Safety Market Volume Billion Forecast, by Safety System 2019 & 2032
- Table 47: Global Industrial Safety Market Revenue Million Forecast, by End-user Industry 2019 & 2032
- Table 48: Global Industrial Safety Market Volume Billion Forecast, by End-user Industry 2019 & 2032
- Table 49: Global Industrial Safety Market Revenue Million Forecast, by Country 2019 & 2032
- Table 50: Global Industrial Safety Market Volume Billion Forecast, by Country 2019 & 2032
- Table 51: Global Industrial Safety Market Revenue Million Forecast, by Component 2019 & 2032
- Table 52: Global Industrial Safety Market Volume Billion Forecast, by Component 2019 & 2032
- Table 53: Global Industrial Safety Market Revenue Million Forecast, by Safety System 2019 & 2032
- Table 54: Global Industrial Safety Market Volume Billion Forecast, by Safety System 2019 & 2032
- Table 55: Global Industrial Safety Market Revenue Million Forecast, by End-user Industry 2019 & 2032
- Table 56: Global Industrial Safety Market Volume Billion Forecast, by End-user Industry 2019 & 2032
- Table 57: Global Industrial Safety Market Revenue Million Forecast, by Country 2019 & 2032
- Table 58: Global Industrial Safety Market Volume Billion Forecast, by Country 2019 & 2032
Frequently Asked Questions
1. What is the projected Compound Annual Growth Rate (CAGR) of the Industrial Safety Market?
The projected CAGR is approximately 4.49%.
2. Which companies are prominent players in the Industrial Safety Market?
Key companies in the market include Schneider Electric SE, Honeywell International Inc, ABB Ltd, Rockwell Automation Inc, Siemens AG, Emerson Electric Co, Baker Hughes, HIMA Paul Hildebrandt GmbH, Yokogawa Electric Corporation, Omron Corporation, Johnson Controls, Balluff GmbH, Keyence Corporation, IDEC Corporation, SICK AG, Mitsubishi Electric, Banner Engineering, Fortress Interlocks, Automation Inc.
3. What are the main segments of the Industrial Safety Market?
The market segments include Component, Safety System, End-user Industry.
4. Can you provide details about the market size?
The market size is estimated to be USD 6.24 Million as of 2022.
5. What are some drivers contributing to market growth?
Increasing Regulatory Environment in the Industry will Drive the Market Growth; The Rising Adoption of Automation. Robotics. and IoT will Increase the Demand for Industrial Safety.
6. What are the notable trends driving market growth?
Safety Sensors Segment is Expected to Hold Significant Market Share.
7. Are there any restraints impacting market growth?
Increasing Regulatory Environment in the Industry will Drive the Market Growth; The Rising Adoption of Automation. Robotics. and IoT will Increase the Demand for Industrial Safety.
8. Can you provide examples of recent developments in the market?
April 2024 - Emerson launched the ASCO Series 148/149 safety valve and motorized actuator, specifically engineered for industrial fuel oil burner recirculation and safety shutoff functions. This innovative solution offers industrial users a dependable and adaptable instrument to mitigate risks of overpressure, leaks, and system failures that may result in health and safety hazards, with a single configuration applicable to various combustion system applications.
9. What pricing options are available for accessing the report?
Pricing options include single-user, multi-user, and enterprise licenses priced at USD 4750, USD 5250, and USD 8750 respectively.
10. Is the market size provided in terms of value or volume?
The market size is provided in terms of value, measured in Million and volume, measured in Billion.
11. Are there any specific market keywords associated with the report?
Yes, the market keyword associated with the report is "Industrial Safety Market," which aids in identifying and referencing the specific market segment covered.
12. How do I determine which pricing option suits my needs best?
The pricing options vary based on user requirements and access needs. Individual users may opt for single-user licenses, while businesses requiring broader access may choose multi-user or enterprise licenses for cost-effective access to the report.
13. Are there any additional resources or data provided in the Industrial Safety Market report?
While the report offers comprehensive insights, it's advisable to review the specific contents or supplementary materials provided to ascertain if additional resources or data are available.
14. How can I stay updated on further developments or reports in the Industrial Safety Market?
To stay informed about further developments, trends, and reports in the Industrial Safety Market, consider subscribing to industry newsletters, following relevant companies and organizations, or regularly checking reputable industry news sources and publications.
Methodology
Step 1 - Identification of Relevant Samples Size from Population Database


Step 2 - Approaches for Defining Global Market Size (Value, Volume* & Price*)

Note*: In applicable scenarios
Step 3 - Data Sources
Primary Research
- Web Analytics
- Survey Reports
- Research Institute
- Latest Research Reports
- Opinion Leaders
Secondary Research
- Annual Reports
- White Paper
- Latest Press Release
- Industry Association
- Paid Database
- Investor Presentations

Step 4 - Data Triangulation
Involves using different sources of information in order to increase the validity of a study
These sources are likely to be stakeholders in a program - participants, other researchers, program staff, other community members, and so on.
Then we put all data in single framework & apply various statistical tools to find out the dynamic on the market.
During the analysis stage, feedback from the stakeholder groups would be compared to determine areas of agreement as well as areas of divergence


