
Key Insights
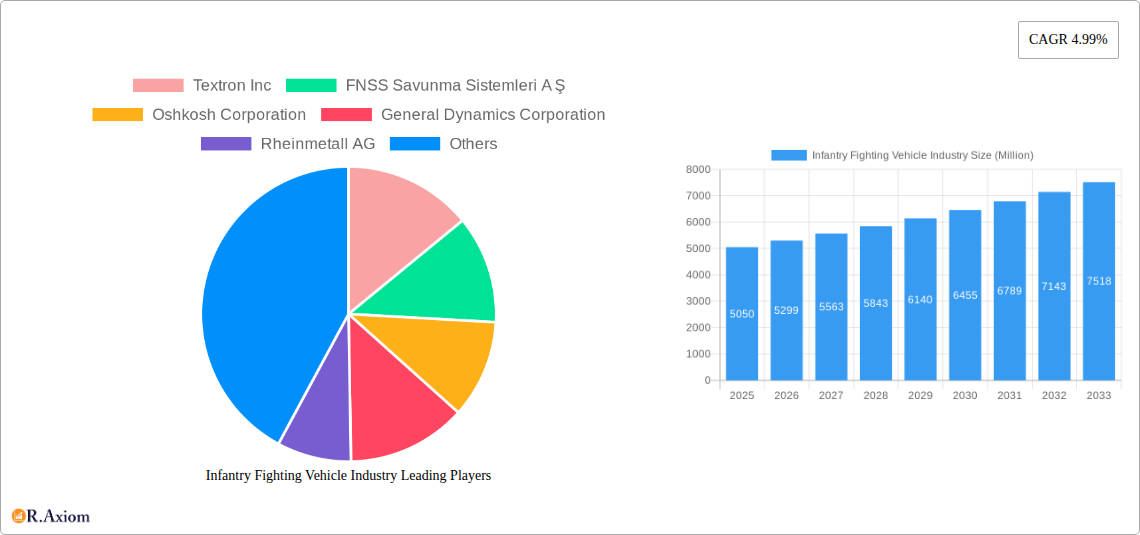
The Infantry Fighting Vehicle (IFV) industry, a crucial segment within the broader armored vehicle market, is projected to experience robust growth over the forecast period (2025-2033). The market, valued at approximately $5.05 billion in 2025 (estimated based on the overall market size and assuming a reasonable segment share for IFVs), is poised for expansion driven by several key factors. Increased geopolitical instability and the modernization of armed forces globally are primary drivers, fueling demand for advanced IFVs with enhanced capabilities such as improved firepower, survivability, and technological integration. Technological advancements, such as the integration of advanced sensors, communication systems, and artificial intelligence, further contribute to market growth by improving the effectiveness and operational efficiency of IFVs. This trend is expected to continue, leading to increased investments in research and development, driving innovation and competition within the sector. Furthermore, the growing adoption of hybrid and electric propulsion systems offers opportunities for IFV manufacturers to enhance fuel efficiency and reduce operational costs, fostering further market expansion.
However, the industry also faces certain challenges. High procurement costs associated with IFVs, particularly those incorporating cutting-edge technologies, can constrain growth, especially in countries with limited defense budgets. Also, the fluctuating global economic conditions and shifting geopolitical alliances can influence government spending on defense equipment, impacting overall market demand. Despite these restraints, the long-term outlook for the IFV market remains positive, largely driven by persistent demand from major global military powers and the increasing need for modernized armored vehicles in various conflict zones. This necessitates continuous technological innovation and strategic partnerships amongst manufacturers to cater to the evolving requirements of military forces worldwide, ensuring the industry's sustainable growth. The competitive landscape features established players like General Dynamics, BAE Systems, and Rheinmetall, alongside emerging players from regions like Asia-Pacific.
This comprehensive report provides an in-depth analysis of the Infantry Fighting Vehicle (IFV) industry, encompassing market size, growth projections, competitive landscape, and key trends from 2019 to 2033. The study period covers the historical period (2019-2024), the base year (2025), and the forecast period (2025-2033). This report is essential for industry stakeholders, investors, and strategic decision-makers seeking a comprehensive understanding of this dynamic market. The report includes detailed segmentation by vehicle type (Armored Personnel Carrier (APC), Infantry Fighting Vehicle (IFV), Mine-resistant Ambush Protected (MRAP), Main Battle Tank (MBT), and Other Types), offering granular insights into market performance across diverse segments. The report also incorporates current and predicted market values in Millions.
Infantry Fighting Vehicle Industry Market Concentration & Innovation
The global Infantry Fighting Vehicle (IFV) industry exhibits moderate concentration, with several key players holding significant market share. However, the landscape is dynamic, influenced by continuous innovation, strategic mergers and acquisitions (M&A), and evolving regulatory frameworks. Market share data for 2024 suggests that the top five players hold approximately xx% of the total market, with a significant portion (xx%) belonging to smaller, regional manufacturers.
Market Share: Textron Inc., General Dynamics Corporation, and BAE Systems plc are estimated to hold the largest market shares in 2024. Precise figures are proprietary to the full report.
M&A Activity: The IFV industry has witnessed several significant M&A deals in recent years, valued at approximately $xx Million collectively, driving consolidation and enhancing technological capabilities. These transactions are detailed in the full report.
Innovation Drivers: Ongoing technological advancements in areas like advanced armor, improved mobility, enhanced fire control systems, and integration of autonomous features drive innovation and create competitive differentiation.
Regulatory Frameworks: Government regulations related to defense spending, export controls, and environmental compliance influence market dynamics and investment decisions.
Product Substitutes: The absence of direct substitutes reinforces the importance of IFVs for ground forces; however, increased adoption of drones and other unmanned systems may indirectly affect the future demand for IFVs.
End-User Trends: Growing demand for enhanced protection, improved situational awareness, and networked capabilities from defense forces are shaping product development and market demand.
Infantry Fighting Vehicle Industry Industry Trends & Insights
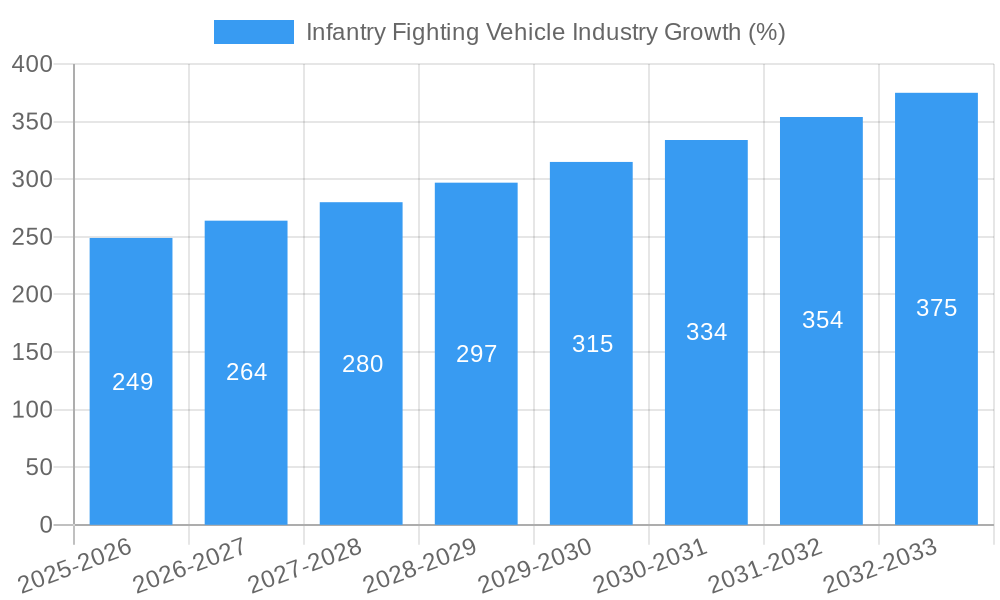
The IFV market is projected to experience robust growth during the forecast period (2025-2033), with a Compound Annual Growth Rate (CAGR) of xx%. This growth is driven by increasing global defense budgets, modernization programs in several key markets, and evolving geopolitical scenarios. Technological advancements, such as the integration of AI and autonomous capabilities, are transforming the IFV landscape, leading to improved performance and enhanced battlefield effectiveness. There is also a growing demand for lightweight and highly mobile IFVs to counter asymmetric warfare threats. The market penetration of advanced IFV models is projected to grow steadily, reaching approximately xx% by 2033. Competitive dynamics are intensifying, with manufacturers focusing on technological innovation, cost reduction, and strategic partnerships to gain a competitive edge. Consumer preferences are shifting toward multi-role IFVs capable of fulfilling diverse missions.
Dominant Markets & Segments in Infantry Fighting Vehicle Industry
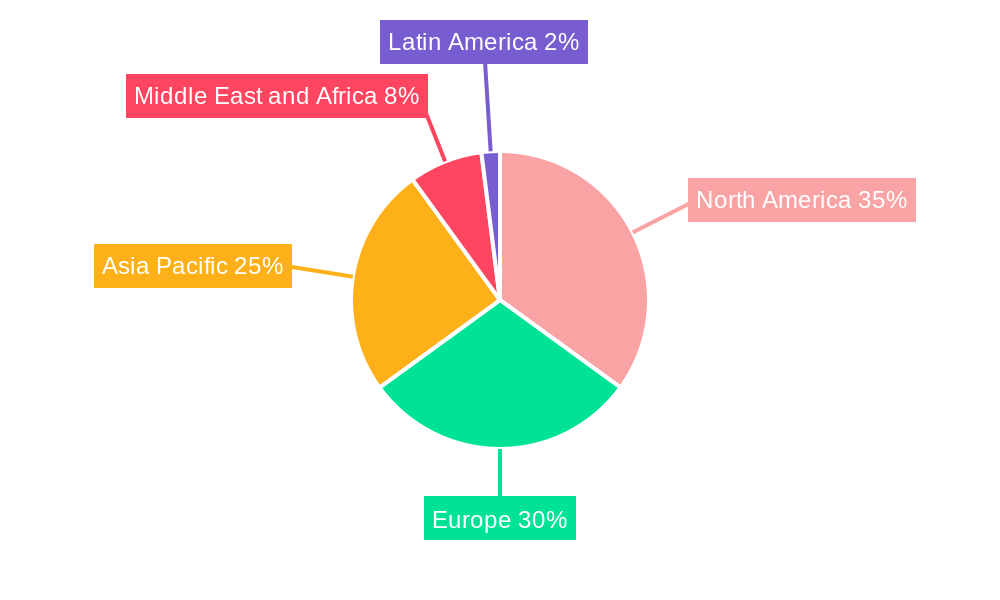
The Asia-Pacific region is currently a dominant market for IFVs, driven by substantial defense investments from several countries. North America remains a significant market, with ongoing modernization and fleet upgrades. Europe also presents a strong market for IFVs, especially due to international cooperation on procurement.
Leading Segment: The Infantry Fighting Vehicle (IFV) segment dominates the market, accounting for the largest share of revenue. This dominance reflects the versatility and core role IFVs play in modern warfare.
Key Drivers:
- Asia-Pacific: Increased defense spending, modernization of armed forces, and territorial disputes are driving growth in this region.
- North America: Focus on military modernization, technological advancements, and robust defense budgets contribute to market growth.
- Europe: Collaborative procurement programs among various European nations are boosting the IFV market.
Infantry Fighting Vehicle Industry Product Developments
Recent product developments emphasize enhanced protection, improved mobility, and increased firepower. New IFVs incorporate advanced armor systems, adaptable modular designs, and improved fire control systems. Technological trends include the integration of advanced sensors, networked communication systems, and AI-driven capabilities. The market is witnessing a shift towards lighter, more agile IFVs with improved fuel efficiency, suitable for diverse terrains and operating environments. These developments align with the needs of modern warfare, enhancing tactical flexibility and operational effectiveness.
Report Scope & Segmentation Analysis
This report provides a detailed segmentation of the IFV market based on vehicle type:
Armored Personnel Carrier (APC): This segment comprises vehicles designed primarily for troop transport, exhibiting steady growth driven by requirements for secure troop mobility.
Infantry Fighting Vehicle (IFV): This segment, the largest in the market, comprises vehicles combining troop transport with significant firepower, exhibiting strong growth due to continuous modernization.
Mine-resistant Ambush Protected (MRAP): This niche segment focuses on enhanced protection against mines and improvised explosive devices (IEDs), exhibiting growth due to ongoing conflicts.
Main Battle Tank (MBT): While distinct from IFVs, this segment is included for comparative analysis, showing stable growth due to ongoing modernization efforts.
Other Types: This segment encompasses specialized variants like reconnaissance vehicles and command and control vehicles, exhibiting diverse growth based on specific requirements.
Each segment's growth projection, market size, and competitive dynamics are analyzed in detail within the full report.
Key Drivers of Infantry Fighting Vehicle Industry Growth
Several factors are driving the growth of the IFV industry: increased global defense expenditure, modernization programs of armed forces worldwide, technological advancements leading to enhanced capabilities (e.g., AI-powered systems, improved armor), and geopolitical instability prompting nations to bolster their defense capabilities. The growing demand for lighter, more mobile, and adaptable IFVs for asymmetric warfare also fuels market expansion. Furthermore, collaborative procurement efforts among nations are increasing market volumes.
Challenges in the Infantry Fighting Vehicle Industry Sector
The IFV industry faces challenges such as fluctuating defense budgets, stringent regulatory requirements concerning exports and environmental standards, supply chain complexities impacting production costs and timelines, and fierce competition among established and emerging players. These factors impose considerable pressure on profit margins and necessitate continuous innovation and strategic partnerships. The potential impact of these challenges is estimated to affect growth by approximately xx% by 2033.
Emerging Opportunities in Infantry Fighting Vehicle Industry
Emerging opportunities include expanding into new markets in developing nations, focusing on the development of lightweight and modular IFVs, integration of autonomous and AI-powered capabilities, and the provision of comprehensive lifecycle support services for customers. The increasing adoption of advanced sensors and communication technologies also presents significant opportunities for innovation. The development of hybrid-electric propulsion systems offers a significant opportunity to reduce fuel consumption and operational costs.
Leading Players in the Infantry Fighting Vehicle Industry Market
- Textron Inc.
- FNSS Savunma Sistemleri A Ş
- Oshkosh Corporation
- General Dynamics Corporation
- Rheinmetall AG
- Elbit Systems Ltd
- Patria Group
- Denel SOC Ltd
- Saudi Arabian Military Industries (SAMI)
- Nexter Group
- BMC Otomotiv Sanayi ve Ticarest AS
- BAE Systems plc
- Hanwha Corporation
- Mitsubishi Heavy Industries Ltd
Key Developments in Infantry Fighting Vehicle Industry Industry
December 2022: Japan selected Patria-built armored modular vehicles (AMV) to replace its Type-96 8X8 wheeled armored personnel carriers. This highlights the growing preference for adaptable and modular designs.
March 2023: Australia and Germany agreed to cooperate on procuring new combat reconnaissance vehicles based on the Boxer family of armored fighting vehicles. This collaborative effort indicates a shift towards international cooperation in procurement.
Strategic Outlook for Infantry Fighting Vehicle Industry Market
The IFV market is poised for continued growth, driven by technological advancements, ongoing modernization efforts by armed forces globally, and geopolitical factors. Opportunities exist for manufacturers who can offer innovative, cost-effective, and adaptable solutions tailored to evolving military requirements. Focusing on advanced technologies, such as AI and autonomous systems, and developing strong partnerships within the defense ecosystem will be crucial for success in this competitive landscape. The market is expected to witness continuous innovation, with a focus on enhancing protection, mobility, and lethality.
Infantry Fighting Vehicle Industry Segmentation
-
1. Type
- 1.1. Armored Personnel Carrier (APC)
- 1.2. Infantry Fighting Vehicle (IFV)
- 1.3. Mine-resistant Ambush Protected (MRAP)
- 1.4. Main Battle Tank (MBT)
- 1.5. Other Types
Infantry Fighting Vehicle Industry Segmentation By Geography
-
1. North America
- 1.1. United States
- 1.2. Canada
-
2. Europe
- 2.1. United Kingdom
- 2.2. France
- 2.3. Germany
- 2.4. Russia
- 2.5. Rest of Europe
-
3. Asia Pacific
- 3.1. China
- 3.2. India
- 3.3. Japan
- 3.4. South Korea
- 3.5. Rest of Asia Pacific
-
4. Latin America
- 4.1. Brazil
- 4.2. Rest of Latin America
-
5. Middle East and Africa
- 5.1. Saudi Arabia
- 5.2. United Arab Emirates
- 5.3. Turkey
- 5.4. Rest of Middle East and Africa
Infantry Fighting Vehicle Industry REPORT HIGHLIGHTS
| Aspects | Details |
|---|---|
| Study Period | 2019-2033 |
| Base Year | 2024 |
| Estimated Year | 2025 |
| Forecast Period | 2025-2033 |
| Historical Period | 2019-2024 |
| Growth Rate | CAGR of 4.99% from 2019-2033 |
| Segmentation |
|
Table of Contents
- 1. Introduction
- 1.1. Research Scope
- 1.2. Market Segmentation
- 1.3. Research Methodology
- 1.4. Definitions and Assumptions
- 2. Executive Summary
- 2.1. Introduction
- 3. Market Dynamics
- 3.1. Introduction
- 3.2. Market Drivers
- 3.3. Market Restrains
- 3.4. Market Trends
- 3.4.1. Infantry Fighting Vehicle (IFV) to Dominate Market Share
- 4. Market Factor Analysis
- 4.1. Porters Five Forces
- 4.2. Supply/Value Chain
- 4.3. PESTEL analysis
- 4.4. Market Entropy
- 4.5. Patent/Trademark Analysis
- 5. Global Infantry Fighting Vehicle Industry Analysis, Insights and Forecast, 2019-2031
- 5.1. Market Analysis, Insights and Forecast - by Type
- 5.1.1. Armored Personnel Carrier (APC)
- 5.1.2. Infantry Fighting Vehicle (IFV)
- 5.1.3. Mine-resistant Ambush Protected (MRAP)
- 5.1.4. Main Battle Tank (MBT)
- 5.1.5. Other Types
- 5.2. Market Analysis, Insights and Forecast - by Region
- 5.2.1. North America
- 5.2.2. Europe
- 5.2.3. Asia Pacific
- 5.2.4. Latin America
- 5.2.5. Middle East and Africa
- 5.1. Market Analysis, Insights and Forecast - by Type
- 6. North America Infantry Fighting Vehicle Industry Analysis, Insights and Forecast, 2019-2031
- 6.1. Market Analysis, Insights and Forecast - by Type
- 6.1.1. Armored Personnel Carrier (APC)
- 6.1.2. Infantry Fighting Vehicle (IFV)
- 6.1.3. Mine-resistant Ambush Protected (MRAP)
- 6.1.4. Main Battle Tank (MBT)
- 6.1.5. Other Types
- 6.1. Market Analysis, Insights and Forecast - by Type
- 7. Europe Infantry Fighting Vehicle Industry Analysis, Insights and Forecast, 2019-2031
- 7.1. Market Analysis, Insights and Forecast - by Type
- 7.1.1. Armored Personnel Carrier (APC)
- 7.1.2. Infantry Fighting Vehicle (IFV)
- 7.1.3. Mine-resistant Ambush Protected (MRAP)
- 7.1.4. Main Battle Tank (MBT)
- 7.1.5. Other Types
- 7.1. Market Analysis, Insights and Forecast - by Type
- 8. Asia Pacific Infantry Fighting Vehicle Industry Analysis, Insights and Forecast, 2019-2031
- 8.1. Market Analysis, Insights and Forecast - by Type
- 8.1.1. Armored Personnel Carrier (APC)
- 8.1.2. Infantry Fighting Vehicle (IFV)
- 8.1.3. Mine-resistant Ambush Protected (MRAP)
- 8.1.4. Main Battle Tank (MBT)
- 8.1.5. Other Types
- 8.1. Market Analysis, Insights and Forecast - by Type
- 9. Latin America Infantry Fighting Vehicle Industry Analysis, Insights and Forecast, 2019-2031
- 9.1. Market Analysis, Insights and Forecast - by Type
- 9.1.1. Armored Personnel Carrier (APC)
- 9.1.2. Infantry Fighting Vehicle (IFV)
- 9.1.3. Mine-resistant Ambush Protected (MRAP)
- 9.1.4. Main Battle Tank (MBT)
- 9.1.5. Other Types
- 9.1. Market Analysis, Insights and Forecast - by Type
- 10. Middle East and Africa Infantry Fighting Vehicle Industry Analysis, Insights and Forecast, 2019-2031
- 10.1. Market Analysis, Insights and Forecast - by Type
- 10.1.1. Armored Personnel Carrier (APC)
- 10.1.2. Infantry Fighting Vehicle (IFV)
- 10.1.3. Mine-resistant Ambush Protected (MRAP)
- 10.1.4. Main Battle Tank (MBT)
- 10.1.5. Other Types
- 10.1. Market Analysis, Insights and Forecast - by Type
- 11. North America Infantry Fighting Vehicle Industry Analysis, Insights and Forecast, 2019-2031
- 11.1. Market Analysis, Insights and Forecast - By Country/Sub-region
- 11.1.1 United States
- 11.1.2 Canada
- 12. Europe Infantry Fighting Vehicle Industry Analysis, Insights and Forecast, 2019-2031
- 12.1. Market Analysis, Insights and Forecast - By Country/Sub-region
- 12.1.1 United Kingdom
- 12.1.2 France
- 12.1.3 Germany
- 12.1.4 Russia
- 12.1.5 Rest of Europe
- 13. Asia Pacific Infantry Fighting Vehicle Industry Analysis, Insights and Forecast, 2019-2031
- 13.1. Market Analysis, Insights and Forecast - By Country/Sub-region
- 13.1.1 China
- 13.1.2 India
- 13.1.3 Japan
- 13.1.4 South Korea
- 13.1.5 Rest of Asia Pacific
- 14. Latin America Infantry Fighting Vehicle Industry Analysis, Insights and Forecast, 2019-2031
- 14.1. Market Analysis, Insights and Forecast - By Country/Sub-region
- 14.1.1 Brazil
- 14.1.2 Rest of Latin America
- 15. Middle East and Africa Infantry Fighting Vehicle Industry Analysis, Insights and Forecast, 2019-2031
- 15.1. Market Analysis, Insights and Forecast - By Country/Sub-region
- 15.1.1 Saudi Arabia
- 15.1.2 United Arab Emirates
- 15.1.3 Turkey
- 15.1.4 Rest of Middle East and Africa
- 16. Competitive Analysis
- 16.1. Global Market Share Analysis 2024
- 16.2. Company Profiles
- 16.2.1 Textron Inc
- 16.2.1.1. Overview
- 16.2.1.2. Products
- 16.2.1.3. SWOT Analysis
- 16.2.1.4. Recent Developments
- 16.2.1.5. Financials (Based on Availability)
- 16.2.2 FNSS Savunma Sistemleri A Ş
- 16.2.2.1. Overview
- 16.2.2.2. Products
- 16.2.2.3. SWOT Analysis
- 16.2.2.4. Recent Developments
- 16.2.2.5. Financials (Based on Availability)
- 16.2.3 Oshkosh Corporation
- 16.2.3.1. Overview
- 16.2.3.2. Products
- 16.2.3.3. SWOT Analysis
- 16.2.3.4. Recent Developments
- 16.2.3.5. Financials (Based on Availability)
- 16.2.4 General Dynamics Corporation
- 16.2.4.1. Overview
- 16.2.4.2. Products
- 16.2.4.3. SWOT Analysis
- 16.2.4.4. Recent Developments
- 16.2.4.5. Financials (Based on Availability)
- 16.2.5 Rheinmetall AG
- 16.2.5.1. Overview
- 16.2.5.2. Products
- 16.2.5.3. SWOT Analysis
- 16.2.5.4. Recent Developments
- 16.2.5.5. Financials (Based on Availability)
- 16.2.6 Elbit Systems Ltd
- 16.2.6.1. Overview
- 16.2.6.2. Products
- 16.2.6.3. SWOT Analysis
- 16.2.6.4. Recent Developments
- 16.2.6.5. Financials (Based on Availability)
- 16.2.7 Patria Group
- 16.2.7.1. Overview
- 16.2.7.2. Products
- 16.2.7.3. SWOT Analysis
- 16.2.7.4. Recent Developments
- 16.2.7.5. Financials (Based on Availability)
- 16.2.8 Denel SOC Ltd
- 16.2.8.1. Overview
- 16.2.8.2. Products
- 16.2.8.3. SWOT Analysis
- 16.2.8.4. Recent Developments
- 16.2.8.5. Financials (Based on Availability)
- 16.2.9 Saudi Arabian Military Industries (SAMI)
- 16.2.9.1. Overview
- 16.2.9.2. Products
- 16.2.9.3. SWOT Analysis
- 16.2.9.4. Recent Developments
- 16.2.9.5. Financials (Based on Availability)
- 16.2.10 Nexter Group
- 16.2.10.1. Overview
- 16.2.10.2. Products
- 16.2.10.3. SWOT Analysis
- 16.2.10.4. Recent Developments
- 16.2.10.5. Financials (Based on Availability)
- 16.2.11 BMC Otomotiv Sanayi ve Ticarest AS
- 16.2.11.1. Overview
- 16.2.11.2. Products
- 16.2.11.3. SWOT Analysis
- 16.2.11.4. Recent Developments
- 16.2.11.5. Financials (Based on Availability)
- 16.2.12 BAE Systems plc
- 16.2.12.1. Overview
- 16.2.12.2. Products
- 16.2.12.3. SWOT Analysis
- 16.2.12.4. Recent Developments
- 16.2.12.5. Financials (Based on Availability)
- 16.2.13 Hanwha Corporation
- 16.2.13.1. Overview
- 16.2.13.2. Products
- 16.2.13.3. SWOT Analysis
- 16.2.13.4. Recent Developments
- 16.2.13.5. Financials (Based on Availability)
- 16.2.14 Mitsubishi Heavy Industries Ltd
- 16.2.14.1. Overview
- 16.2.14.2. Products
- 16.2.14.3. SWOT Analysis
- 16.2.14.4. Recent Developments
- 16.2.14.5. Financials (Based on Availability)
- 16.2.1 Textron Inc
List of Figures
- Figure 1: Global Infantry Fighting Vehicle Industry Revenue Breakdown (Million, %) by Region 2024 & 2032
- Figure 2: North America Infantry Fighting Vehicle Industry Revenue (Million), by Country 2024 & 2032
- Figure 3: North America Infantry Fighting Vehicle Industry Revenue Share (%), by Country 2024 & 2032
- Figure 4: Europe Infantry Fighting Vehicle Industry Revenue (Million), by Country 2024 & 2032
- Figure 5: Europe Infantry Fighting Vehicle Industry Revenue Share (%), by Country 2024 & 2032
- Figure 6: Asia Pacific Infantry Fighting Vehicle Industry Revenue (Million), by Country 2024 & 2032
- Figure 7: Asia Pacific Infantry Fighting Vehicle Industry Revenue Share (%), by Country 2024 & 2032
- Figure 8: Latin America Infantry Fighting Vehicle Industry Revenue (Million), by Country 2024 & 2032
- Figure 9: Latin America Infantry Fighting Vehicle Industry Revenue Share (%), by Country 2024 & 2032
- Figure 10: Middle East and Africa Infantry Fighting Vehicle Industry Revenue (Million), by Country 2024 & 2032
- Figure 11: Middle East and Africa Infantry Fighting Vehicle Industry Revenue Share (%), by Country 2024 & 2032
- Figure 12: North America Infantry Fighting Vehicle Industry Revenue (Million), by Type 2024 & 2032
- Figure 13: North America Infantry Fighting Vehicle Industry Revenue Share (%), by Type 2024 & 2032
- Figure 14: North America Infantry Fighting Vehicle Industry Revenue (Million), by Country 2024 & 2032
- Figure 15: North America Infantry Fighting Vehicle Industry Revenue Share (%), by Country 2024 & 2032
- Figure 16: Europe Infantry Fighting Vehicle Industry Revenue (Million), by Type 2024 & 2032
- Figure 17: Europe Infantry Fighting Vehicle Industry Revenue Share (%), by Type 2024 & 2032
- Figure 18: Europe Infantry Fighting Vehicle Industry Revenue (Million), by Country 2024 & 2032
- Figure 19: Europe Infantry Fighting Vehicle Industry Revenue Share (%), by Country 2024 & 2032
- Figure 20: Asia Pacific Infantry Fighting Vehicle Industry Revenue (Million), by Type 2024 & 2032
- Figure 21: Asia Pacific Infantry Fighting Vehicle Industry Revenue Share (%), by Type 2024 & 2032
- Figure 22: Asia Pacific Infantry Fighting Vehicle Industry Revenue (Million), by Country 2024 & 2032
- Figure 23: Asia Pacific Infantry Fighting Vehicle Industry Revenue Share (%), by Country 2024 & 2032
- Figure 24: Latin America Infantry Fighting Vehicle Industry Revenue (Million), by Type 2024 & 2032
- Figure 25: Latin America Infantry Fighting Vehicle Industry Revenue Share (%), by Type 2024 & 2032
- Figure 26: Latin America Infantry Fighting Vehicle Industry Revenue (Million), by Country 2024 & 2032
- Figure 27: Latin America Infantry Fighting Vehicle Industry Revenue Share (%), by Country 2024 & 2032
- Figure 28: Middle East and Africa Infantry Fighting Vehicle Industry Revenue (Million), by Type 2024 & 2032
- Figure 29: Middle East and Africa Infantry Fighting Vehicle Industry Revenue Share (%), by Type 2024 & 2032
- Figure 30: Middle East and Africa Infantry Fighting Vehicle Industry Revenue (Million), by Country 2024 & 2032
- Figure 31: Middle East and Africa Infantry Fighting Vehicle Industry Revenue Share (%), by Country 2024 & 2032
List of Tables
- Table 1: Global Infantry Fighting Vehicle Industry Revenue Million Forecast, by Region 2019 & 2032
- Table 2: Global Infantry Fighting Vehicle Industry Revenue Million Forecast, by Type 2019 & 2032
- Table 3: Global Infantry Fighting Vehicle Industry Revenue Million Forecast, by Region 2019 & 2032
- Table 4: Global Infantry Fighting Vehicle Industry Revenue Million Forecast, by Country 2019 & 2032
- Table 5: United States Infantry Fighting Vehicle Industry Revenue (Million) Forecast, by Application 2019 & 2032
- Table 6: Canada Infantry Fighting Vehicle Industry Revenue (Million) Forecast, by Application 2019 & 2032
- Table 7: Global Infantry Fighting Vehicle Industry Revenue Million Forecast, by Country 2019 & 2032
- Table 8: United Kingdom Infantry Fighting Vehicle Industry Revenue (Million) Forecast, by Application 2019 & 2032
- Table 9: France Infantry Fighting Vehicle Industry Revenue (Million) Forecast, by Application 2019 & 2032
- Table 10: Germany Infantry Fighting Vehicle Industry Revenue (Million) Forecast, by Application 2019 & 2032
- Table 11: Russia Infantry Fighting Vehicle Industry Revenue (Million) Forecast, by Application 2019 & 2032
- Table 12: Rest of Europe Infantry Fighting Vehicle Industry Revenue (Million) Forecast, by Application 2019 & 2032
- Table 13: Global Infantry Fighting Vehicle Industry Revenue Million Forecast, by Country 2019 & 2032
- Table 14: China Infantry Fighting Vehicle Industry Revenue (Million) Forecast, by Application 2019 & 2032
- Table 15: India Infantry Fighting Vehicle Industry Revenue (Million) Forecast, by Application 2019 & 2032
- Table 16: Japan Infantry Fighting Vehicle Industry Revenue (Million) Forecast, by Application 2019 & 2032
- Table 17: South Korea Infantry Fighting Vehicle Industry Revenue (Million) Forecast, by Application 2019 & 2032
- Table 18: Rest of Asia Pacific Infantry Fighting Vehicle Industry Revenue (Million) Forecast, by Application 2019 & 2032
- Table 19: Global Infantry Fighting Vehicle Industry Revenue Million Forecast, by Country 2019 & 2032
- Table 20: Brazil Infantry Fighting Vehicle Industry Revenue (Million) Forecast, by Application 2019 & 2032
- Table 21: Rest of Latin America Infantry Fighting Vehicle Industry Revenue (Million) Forecast, by Application 2019 & 2032
- Table 22: Global Infantry Fighting Vehicle Industry Revenue Million Forecast, by Country 2019 & 2032
- Table 23: Saudi Arabia Infantry Fighting Vehicle Industry Revenue (Million) Forecast, by Application 2019 & 2032
- Table 24: United Arab Emirates Infantry Fighting Vehicle Industry Revenue (Million) Forecast, by Application 2019 & 2032
- Table 25: Turkey Infantry Fighting Vehicle Industry Revenue (Million) Forecast, by Application 2019 & 2032
- Table 26: Rest of Middle East and Africa Infantry Fighting Vehicle Industry Revenue (Million) Forecast, by Application 2019 & 2032
- Table 27: Global Infantry Fighting Vehicle Industry Revenue Million Forecast, by Type 2019 & 2032
- Table 28: Global Infantry Fighting Vehicle Industry Revenue Million Forecast, by Country 2019 & 2032
- Table 29: United States Infantry Fighting Vehicle Industry Revenue (Million) Forecast, by Application 2019 & 2032
- Table 30: Canada Infantry Fighting Vehicle Industry Revenue (Million) Forecast, by Application 2019 & 2032
- Table 31: Global Infantry Fighting Vehicle Industry Revenue Million Forecast, by Type 2019 & 2032
- Table 32: Global Infantry Fighting Vehicle Industry Revenue Million Forecast, by Country 2019 & 2032
- Table 33: United Kingdom Infantry Fighting Vehicle Industry Revenue (Million) Forecast, by Application 2019 & 2032
- Table 34: France Infantry Fighting Vehicle Industry Revenue (Million) Forecast, by Application 2019 & 2032
- Table 35: Germany Infantry Fighting Vehicle Industry Revenue (Million) Forecast, by Application 2019 & 2032
- Table 36: Russia Infantry Fighting Vehicle Industry Revenue (Million) Forecast, by Application 2019 & 2032
- Table 37: Rest of Europe Infantry Fighting Vehicle Industry Revenue (Million) Forecast, by Application 2019 & 2032
- Table 38: Global Infantry Fighting Vehicle Industry Revenue Million Forecast, by Type 2019 & 2032
- Table 39: Global Infantry Fighting Vehicle Industry Revenue Million Forecast, by Country 2019 & 2032
- Table 40: China Infantry Fighting Vehicle Industry Revenue (Million) Forecast, by Application 2019 & 2032
- Table 41: India Infantry Fighting Vehicle Industry Revenue (Million) Forecast, by Application 2019 & 2032
- Table 42: Japan Infantry Fighting Vehicle Industry Revenue (Million) Forecast, by Application 2019 & 2032
- Table 43: South Korea Infantry Fighting Vehicle Industry Revenue (Million) Forecast, by Application 2019 & 2032
- Table 44: Rest of Asia Pacific Infantry Fighting Vehicle Industry Revenue (Million) Forecast, by Application 2019 & 2032
- Table 45: Global Infantry Fighting Vehicle Industry Revenue Million Forecast, by Type 2019 & 2032
- Table 46: Global Infantry Fighting Vehicle Industry Revenue Million Forecast, by Country 2019 & 2032
- Table 47: Brazil Infantry Fighting Vehicle Industry Revenue (Million) Forecast, by Application 2019 & 2032
- Table 48: Rest of Latin America Infantry Fighting Vehicle Industry Revenue (Million) Forecast, by Application 2019 & 2032
- Table 49: Global Infantry Fighting Vehicle Industry Revenue Million Forecast, by Type 2019 & 2032
- Table 50: Global Infantry Fighting Vehicle Industry Revenue Million Forecast, by Country 2019 & 2032
- Table 51: Saudi Arabia Infantry Fighting Vehicle Industry Revenue (Million) Forecast, by Application 2019 & 2032
- Table 52: United Arab Emirates Infantry Fighting Vehicle Industry Revenue (Million) Forecast, by Application 2019 & 2032
- Table 53: Turkey Infantry Fighting Vehicle Industry Revenue (Million) Forecast, by Application 2019 & 2032
- Table 54: Rest of Middle East and Africa Infantry Fighting Vehicle Industry Revenue (Million) Forecast, by Application 2019 & 2032
Frequently Asked Questions
1. What is the projected Compound Annual Growth Rate (CAGR) of the Infantry Fighting Vehicle Industry?
The projected CAGR is approximately 4.99%.
2. Which companies are prominent players in the Infantry Fighting Vehicle Industry?
Key companies in the market include Textron Inc, FNSS Savunma Sistemleri A Ş, Oshkosh Corporation, General Dynamics Corporation, Rheinmetall AG, Elbit Systems Ltd, Patria Group, Denel SOC Ltd, Saudi Arabian Military Industries (SAMI), Nexter Group, BMC Otomotiv Sanayi ve Ticarest AS, BAE Systems plc, Hanwha Corporation, Mitsubishi Heavy Industries Ltd.
3. What are the main segments of the Infantry Fighting Vehicle Industry?
The market segments include Type.
4. Can you provide details about the market size?
The market size is estimated to be USD 25.25 Million as of 2022.
5. What are some drivers contributing to market growth?
N/A
6. What are the notable trends driving market growth?
Infantry Fighting Vehicle (IFV) to Dominate Market Share.
7. Are there any restraints impacting market growth?
N/A
8. Can you provide examples of recent developments in the market?
March 2023: Australian and German officials signed an agreement to cooperate on the procurement of the new combat reconnaissance vehicles, based on the Boxer family of armored fighting vehicles and equipped with a 30-millimeter gun. The deliveries will start in 2025.
9. What pricing options are available for accessing the report?
Pricing options include single-user, multi-user, and enterprise licenses priced at USD 4750, USD 5250, and USD 8750 respectively.
10. Is the market size provided in terms of value or volume?
The market size is provided in terms of value, measured in Million.
11. Are there any specific market keywords associated with the report?
Yes, the market keyword associated with the report is "Infantry Fighting Vehicle Industry," which aids in identifying and referencing the specific market segment covered.
12. How do I determine which pricing option suits my needs best?
The pricing options vary based on user requirements and access needs. Individual users may opt for single-user licenses, while businesses requiring broader access may choose multi-user or enterprise licenses for cost-effective access to the report.
13. Are there any additional resources or data provided in the Infantry Fighting Vehicle Industry report?
While the report offers comprehensive insights, it's advisable to review the specific contents or supplementary materials provided to ascertain if additional resources or data are available.
14. How can I stay updated on further developments or reports in the Infantry Fighting Vehicle Industry?
To stay informed about further developments, trends, and reports in the Infantry Fighting Vehicle Industry, consider subscribing to industry newsletters, following relevant companies and organizations, or regularly checking reputable industry news sources and publications.
Methodology
Step 1 - Identification of Relevant Samples Size from Population Database


Step 2 - Approaches for Defining Global Market Size (Value, Volume* & Price*)

Note*: In applicable scenarios
Step 3 - Data Sources
Primary Research
- Web Analytics
- Survey Reports
- Research Institute
- Latest Research Reports
- Opinion Leaders
Secondary Research
- Annual Reports
- White Paper
- Latest Press Release
- Industry Association
- Paid Database
- Investor Presentations

Step 4 - Data Triangulation
Involves using different sources of information in order to increase the validity of a study
These sources are likely to be stakeholders in a program - participants, other researchers, program staff, other community members, and so on.
Then we put all data in single framework & apply various statistical tools to find out the dynamic on the market.
During the analysis stage, feedback from the stakeholder groups would be compared to determine areas of agreement as well as areas of divergence


