
Key Insights
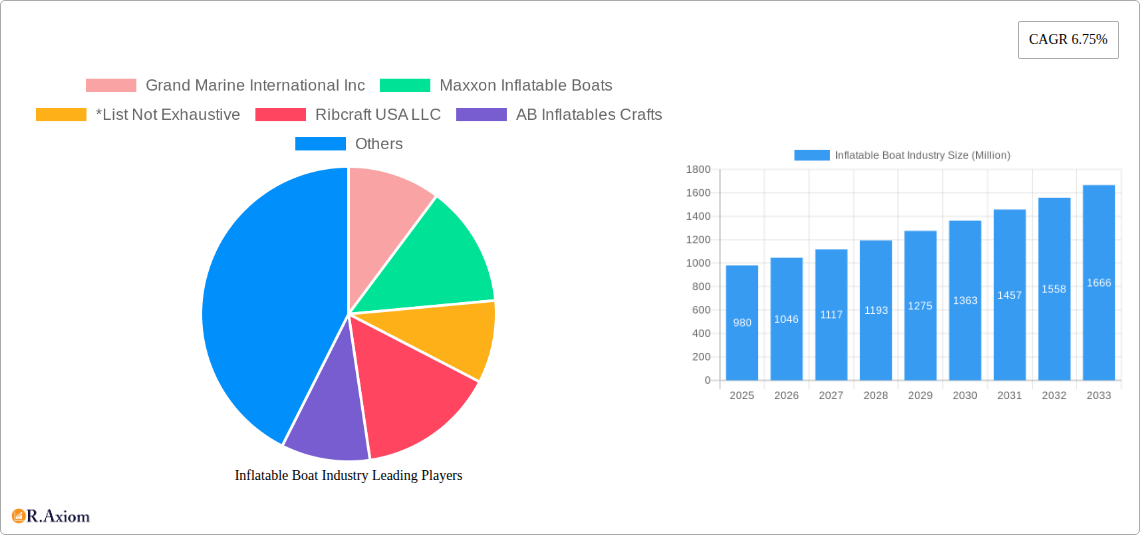
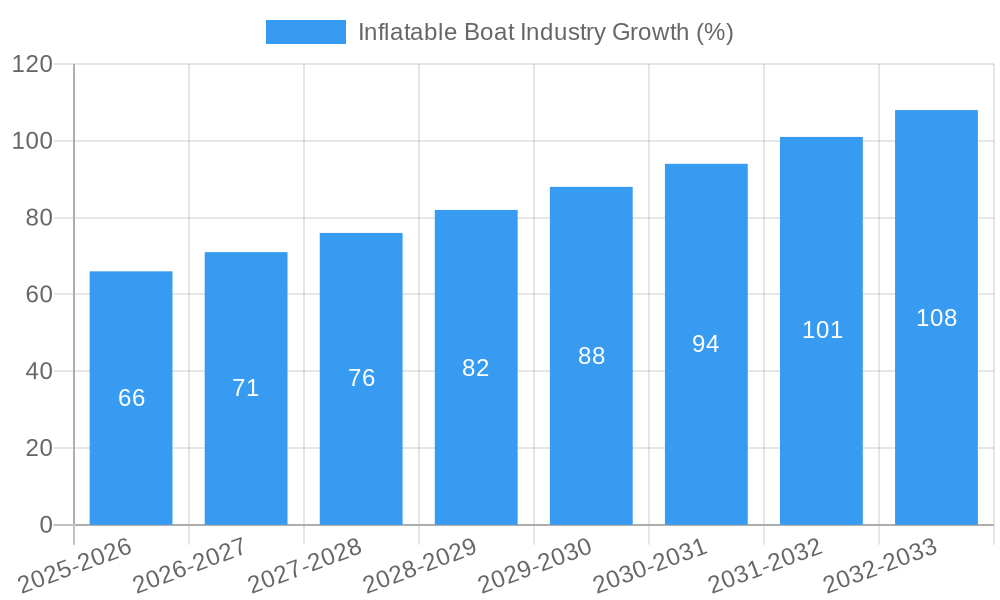
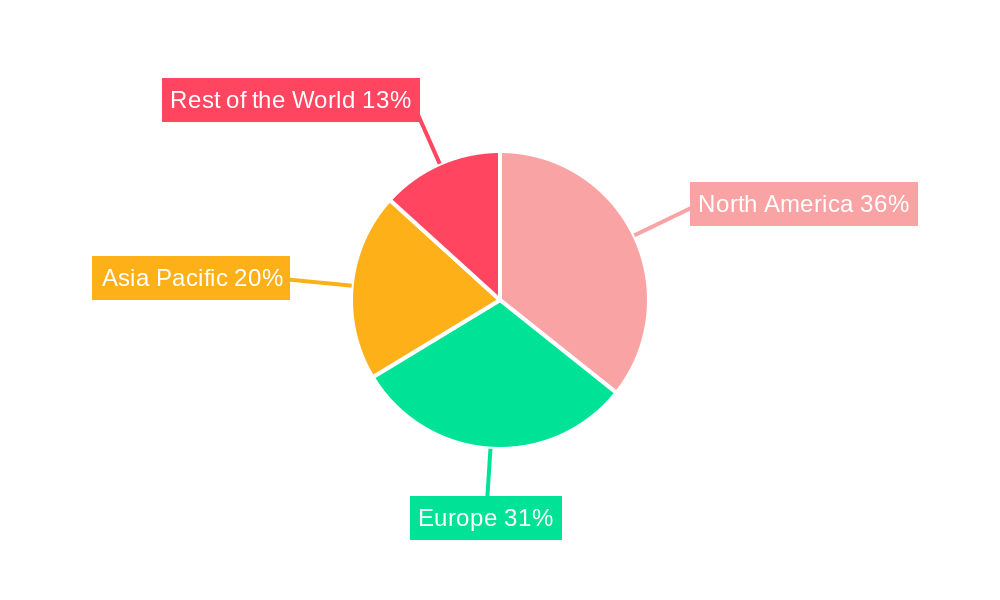
The global inflatable boat market, valued at $0.98 billion in 2025, is projected to experience robust growth, driven by increasing demand from leisure activities and the defense sector. A Compound Annual Growth Rate (CAGR) of 6.75% from 2025 to 2033 indicates a significant expansion of this market. The leisure segment, encompassing recreational boating and fishing, is the largest contributor, fueled by rising disposable incomes and growing participation in water sports. The defense sector's adoption of inflatable boats for specialized operations, such as coastal patrol and search and rescue, also contributes substantially to market growth. Technological advancements, such as the development of more durable and lightweight materials, are further enhancing the appeal of inflatable boats. However, fluctuating raw material prices and the potential impact of stricter environmental regulations could pose challenges to market expansion. The market is segmented by end-user type (leisure, defense, others) and boat type (rigid inflatable boats (RIBs), soft inflatable boats). RIBs currently dominate due to their superior performance and stability, but the soft inflatable boat segment is witnessing growth due to its affordability and portability. Key players like Grand Marine International Inc., Maxxon Inflatable Boats, Ribcraft USA LLC, AB Inflatables Crafts, Zodiac Nautic, Survitec Group Limited, Mercury Marine, Damen Shipyard Group, and Walker's Bay are actively shaping market dynamics through innovation and strategic expansion. North America and Europe are currently the leading regional markets, but Asia-Pacific is expected to show significant growth potential in the coming years driven by increasing tourism and recreational activities.
The forecast period of 2025-2033 presents lucrative opportunities for manufacturers focusing on customization, enhanced safety features, and eco-friendly materials. Growth will likely be concentrated in regions with increasing disposable incomes and developing tourism infrastructure. Companies are likely to focus on strategic partnerships, acquisitions, and product diversification to maintain a competitive edge in this growing market. Further segmentation within the leisure sector, encompassing specific niche applications like fishing, waterskiing, and kayaking, will drive specialized product development. The defense sector is likely to see continued demand for advanced, high-performance inflatable boats with enhanced durability and specialized equipment integration. A careful consideration of environmental sustainability concerns will play an increasingly important role in shaping future market growth and product development.
This comprehensive report provides a detailed analysis of the global inflatable boat industry, offering valuable insights for industry stakeholders, investors, and businesses seeking to understand and capitalize on market opportunities. Covering the period 2019-2033, with a base year of 2025 and a forecast period of 2025-2033, this report unveils the market's size, growth trajectory, key segments, competitive landscape, and emerging trends. The report's analysis is based on meticulous research and incorporates data from various sources, including industry experts, financial reports, and market research databases. The total market size is estimated at $XX Million in 2025.
Inflatable Boat Industry Market Concentration & Innovation
This section analyzes the level of market concentration, identifying key players and their market share. Innovation drivers, including technological advancements and regulatory changes, are also examined, along with the impact of product substitutes and mergers and acquisitions (M&A) activity. The competitive landscape is characterized by a mix of large multinational corporations and smaller specialized manufacturers. The estimated market concentration ratio (CR4) for 2025 is xx%, indicating a moderately concentrated market.
- Market Share: Leading players like Zodiac Nautic and Mercury Marine hold significant market share, while several smaller companies compete intensely in niche segments. Precise market share data for individual companies is proprietary information and unavailable for disclosure at this time.
- M&A Activity: The inflatable boat industry has witnessed several M&A deals in recent years, primarily driven by consolidation and expansion efforts, though specific deal values are unavailable for public release. The impact of these activities on market dynamics is discussed within the report.
- Innovation Drivers: Technological innovations, such as advancements in materials science (lighter, stronger fabrics) and manufacturing processes, are driving growth. Stringent safety regulations and environmental concerns also influence innovation, pushing towards more sustainable and eco-friendly products.
- Regulatory Frameworks: International maritime regulations and safety standards significantly impact the industry. Compliance requirements affect the design, manufacturing, and operation of inflatable boats, shaping innovation and market dynamics.
Inflatable Boat Industry Industry Trends & Insights
The global inflatable boat market is experiencing significant growth, driven by factors such as increasing recreational boating activities, rising defense spending, and expanding applications across various sectors. The market's Compound Annual Growth Rate (CAGR) during the forecast period (2025-2033) is estimated at xx%. This growth is fueled by several key trends:
- Technological Disruptions: The introduction of new materials, improved manufacturing techniques, and enhanced technological features are changing the landscape. Advanced features such as GPS integration, improved propulsion systems, and enhanced safety measures are creating opportunities for manufacturers.
- Consumer Preferences: Demand is rising for lightweight, durable, and easy-to-use inflatable boats catering to diverse user needs, ranging from recreational to commercial applications. Customization options and aesthetically appealing designs are also driving sales.
- Competitive Dynamics: Intense competition between established players and emerging companies is driving innovation and price competitiveness. Strategic partnerships and collaborations are becoming increasingly important for market expansion and product diversification.
- Market Penetration: The market penetration of inflatable boats in emerging economies is expected to increase substantially due to rising disposable incomes and growing interest in leisure activities.
Dominant Markets & Segments in Inflatable Boat Industry
The leisure segment dominates the inflatable boat market globally, accounting for an estimated xx% of the total market value in 2025. This is followed by the defense segment and others combined representing xx%. The rigid inflatable boat (RIB) segment is experiencing higher growth than the soft inflatable boat segment, driven by demand for higher performance and durability. Geographically, North America and Europe are major markets, but Asia-Pacific is expected to show high growth in the coming years.
- Key Drivers (Leisure Segment):
- Rising disposable incomes and increased participation in water sports.
- Growing tourism and recreational activities.
- Improved availability of financing options.
- Key Drivers (Defense Segment):
- Increased defense budgets and modernization of naval forces globally.
- Demand for versatile and lightweight boats for various military operations.
- Technological advancements in RIB technology suitable for military applications.
- Dominance Analysis: The leisure segment's dominance is attributed to a larger consumer base and diverse applications, while the defense segment's importance arises from high-value contracts and specialized requirements.
Inflatable Boat Industry Product Developments
Recent product innovations focus on enhancing durability, performance, and safety features. This includes the use of advanced materials, improved hull designs, and incorporation of advanced technologies like GPS navigation and electric propulsion systems. These innovations are enhancing market competitiveness and addressing the growing demand for specialized inflatable boats. Companies are also focusing on environmentally friendly materials and sustainable manufacturing practices.
Report Scope & Segmentation Analysis
This report segments the inflatable boat market based on end-user type (Leisure, Defense, Others) and boat type (Rigid, Soft).
- End-User Type: The Leisure segment is expected to maintain its dominance, with steady growth projected. The Defense segment is expected to show moderate growth driven by government spending and technological advancements. The "Others" segment, encompassing commercial and industrial applications, is also expected to exhibit growth.
- Boat Type: The Rigid inflatable boat (RIB) segment is anticipated to witness comparatively higher growth compared to the soft inflatable boat segment due to its superior performance and durability. Market size estimations for each segment are included in the detailed report.
Key Drivers of Inflatable Boat Industry Growth
Several factors contribute to the inflatable boat industry's growth, including:
- Technological Advancements: Innovations in materials, design, and manufacturing processes enhance boat performance, durability, and safety.
- Economic Growth: Rising disposable incomes, particularly in emerging economies, fuel increased demand for recreational boating.
- Favorable Regulatory Environment: Supportive government policies and regulations promote the industry's expansion.
Challenges in the Inflatable Boat Industry Sector
The industry faces challenges such as:
- Raw Material Fluctuations: Price volatility in raw materials can impact production costs and profitability.
- Stringent Safety Regulations: Meeting rigorous safety and environmental standards can be expensive and complex.
- Intense Competition: The market's competitive nature necessitates continuous innovation and cost-effectiveness.
Emerging Opportunities in Inflatable Boat Industry
The inflatable boat industry presents several emerging opportunities:
- Expansion into New Markets: Untapped markets in developing economies offer significant growth potential.
- Technological Innovation: Development of advanced features and materials creates new market segments.
- Sustainable Practices: Adoption of eco-friendly materials and manufacturing processes enhances brand image and attracts environmentally conscious customers.
Leading Players in the Inflatable Boat Industry Market
- Zodiac Nautic
- Mercury Marine
- Grand Marine International Inc
- Maxxon Inflatable Boats
- Ribcraft USA LLC
- AB Inflatables Crafts
- Survitec Group Limited
- Damen Shipyard Group
- Walker's Bay
Key Developments in Inflatable Boat Industry Industry
- 2023 Q4: Zodiac Nautic launched a new line of high-performance RIBs with advanced features.
- 2022 Q3: Mercury Marine announced a strategic partnership with a leading inflatable boat manufacturer.
- (Further key developments are included in the full report)
Strategic Outlook for Inflatable Boat Industry Market
The inflatable boat market is poised for sustained growth, driven by technological advancements, rising consumer demand, and expanding applications across various sectors. The industry's future depends on adapting to evolving consumer preferences, embracing sustainable practices, and continuously innovating to meet the demands of a dynamic market. The market's strategic outlook indicates a positive trajectory, with significant growth potential in the forecast period.
Inflatable Boat Industry Segmentation
-
1. End-User Type
- 1.1. Leisure
- 1.2. Defense
- 1.3. Others
-
2. Boat Type
- 2.1. Rigid
- 2.2. Soft
Inflatable Boat Industry Segmentation By Geography
-
1. North America
- 1.1. United States
- 1.2. Canada
- 1.3. Rest of North America
-
2. Europe
- 2.1. Germany
- 2.2. United Kingdom
- 2.3. France
- 2.4. Rest of Europe
-
3. Asia Pacific
- 3.1. India
- 3.2. China
- 3.3. Japan
- 3.4. South Korea
- 3.5. Rest of Asia Pacific
-
4. Rest of the World
- 4.1. Brazil
- 4.2. Mexico
- 4.3. United Arab Emirates
- 4.4. Other Countries
Inflatable Boat Industry REPORT HIGHLIGHTS
| Aspects | Details |
|---|---|
| Study Period | 2019-2033 |
| Base Year | 2024 |
| Estimated Year | 2025 |
| Forecast Period | 2025-2033 |
| Historical Period | 2019-2024 |
| Growth Rate | CAGR of 6.75% from 2019-2033 |
| Segmentation |
|
Table of Contents
- 1. Introduction
- 1.1. Research Scope
- 1.2. Market Segmentation
- 1.3. Research Methodology
- 1.4. Definitions and Assumptions
- 2. Executive Summary
- 2.1. Introduction
- 3. Market Dynamics
- 3.1. Introduction
- 3.2. Market Drivers
- 3.2.1. Increasing Demand For Electric Vehicles is Anticipated to Boost the Market
- 3.3. Market Restrains
- 3.3.1. High Cost Associated with Electric Vehicles is Anticipated to Restrain the Growth of the Market
- 3.4. Market Trends
- 3.4.1. Leisure Segment is Expected to Dominate
- 4. Market Factor Analysis
- 4.1. Porters Five Forces
- 4.2. Supply/Value Chain
- 4.3. PESTEL analysis
- 4.4. Market Entropy
- 4.5. Patent/Trademark Analysis
- 5. Global Inflatable Boat Industry Analysis, Insights and Forecast, 2019-2031
- 5.1. Market Analysis, Insights and Forecast - by End-User Type
- 5.1.1. Leisure
- 5.1.2. Defense
- 5.1.3. Others
- 5.2. Market Analysis, Insights and Forecast - by Boat Type
- 5.2.1. Rigid
- 5.2.2. Soft
- 5.3. Market Analysis, Insights and Forecast - by Region
- 5.3.1. North America
- 5.3.2. Europe
- 5.3.3. Asia Pacific
- 5.3.4. Rest of the World
- 5.1. Market Analysis, Insights and Forecast - by End-User Type
- 6. North America Inflatable Boat Industry Analysis, Insights and Forecast, 2019-2031
- 6.1. Market Analysis, Insights and Forecast - by End-User Type
- 6.1.1. Leisure
- 6.1.2. Defense
- 6.1.3. Others
- 6.2. Market Analysis, Insights and Forecast - by Boat Type
- 6.2.1. Rigid
- 6.2.2. Soft
- 6.1. Market Analysis, Insights and Forecast - by End-User Type
- 7. Europe Inflatable Boat Industry Analysis, Insights and Forecast, 2019-2031
- 7.1. Market Analysis, Insights and Forecast - by End-User Type
- 7.1.1. Leisure
- 7.1.2. Defense
- 7.1.3. Others
- 7.2. Market Analysis, Insights and Forecast - by Boat Type
- 7.2.1. Rigid
- 7.2.2. Soft
- 7.1. Market Analysis, Insights and Forecast - by End-User Type
- 8. Asia Pacific Inflatable Boat Industry Analysis, Insights and Forecast, 2019-2031
- 8.1. Market Analysis, Insights and Forecast - by End-User Type
- 8.1.1. Leisure
- 8.1.2. Defense
- 8.1.3. Others
- 8.2. Market Analysis, Insights and Forecast - by Boat Type
- 8.2.1. Rigid
- 8.2.2. Soft
- 8.1. Market Analysis, Insights and Forecast - by End-User Type
- 9. Rest of the World Inflatable Boat Industry Analysis, Insights and Forecast, 2019-2031
- 9.1. Market Analysis, Insights and Forecast - by End-User Type
- 9.1.1. Leisure
- 9.1.2. Defense
- 9.1.3. Others
- 9.2. Market Analysis, Insights and Forecast - by Boat Type
- 9.2.1. Rigid
- 9.2.2. Soft
- 9.1. Market Analysis, Insights and Forecast - by End-User Type
- 10. North America Inflatable Boat Industry Analysis, Insights and Forecast, 2019-2031
- 10.1. Market Analysis, Insights and Forecast - By Country/Sub-region
- 10.1.1 United States
- 10.1.2 Canada
- 10.1.3 Rest of North America
- 11. Europe Inflatable Boat Industry Analysis, Insights and Forecast, 2019-2031
- 11.1. Market Analysis, Insights and Forecast - By Country/Sub-region
- 11.1.1 Germany
- 11.1.2 United Kingdom
- 11.1.3 France
- 11.1.4 Rest of Europe
- 12. Asia Pacific Inflatable Boat Industry Analysis, Insights and Forecast, 2019-2031
- 12.1. Market Analysis, Insights and Forecast - By Country/Sub-region
- 12.1.1 India
- 12.1.2 China
- 12.1.3 Japan
- 12.1.4 South Korea
- 12.1.5 Rest of Asia Pacific
- 13. Rest of the World Inflatable Boat Industry Analysis, Insights and Forecast, 2019-2031
- 13.1. Market Analysis, Insights and Forecast - By Country/Sub-region
- 13.1.1 Brazil
- 13.1.2 Mexico
- 13.1.3 United Arab Emirates
- 13.1.4 Other Countries
- 14. Competitive Analysis
- 14.1. Global Market Share Analysis 2024
- 14.2. Company Profiles
- 14.2.1 Grand Marine International Inc
- 14.2.1.1. Overview
- 14.2.1.2. Products
- 14.2.1.3. SWOT Analysis
- 14.2.1.4. Recent Developments
- 14.2.1.5. Financials (Based on Availability)
- 14.2.2 Maxxon Inflatable Boats
- 14.2.2.1. Overview
- 14.2.2.2. Products
- 14.2.2.3. SWOT Analysis
- 14.2.2.4. Recent Developments
- 14.2.2.5. Financials (Based on Availability)
- 14.2.3 *List Not Exhaustive
- 14.2.3.1. Overview
- 14.2.3.2. Products
- 14.2.3.3. SWOT Analysis
- 14.2.3.4. Recent Developments
- 14.2.3.5. Financials (Based on Availability)
- 14.2.4 Ribcraft USA LLC
- 14.2.4.1. Overview
- 14.2.4.2. Products
- 14.2.4.3. SWOT Analysis
- 14.2.4.4. Recent Developments
- 14.2.4.5. Financials (Based on Availability)
- 14.2.5 AB Inflatables Crafts
- 14.2.5.1. Overview
- 14.2.5.2. Products
- 14.2.5.3. SWOT Analysis
- 14.2.5.4. Recent Developments
- 14.2.5.5. Financials (Based on Availability)
- 14.2.6 Zodiac Nautic
- 14.2.6.1. Overview
- 14.2.6.2. Products
- 14.2.6.3. SWOT Analysis
- 14.2.6.4. Recent Developments
- 14.2.6.5. Financials (Based on Availability)
- 14.2.7 Survitec Group Limited
- 14.2.7.1. Overview
- 14.2.7.2. Products
- 14.2.7.3. SWOT Analysis
- 14.2.7.4. Recent Developments
- 14.2.7.5. Financials (Based on Availability)
- 14.2.8 Mercury Marine
- 14.2.8.1. Overview
- 14.2.8.2. Products
- 14.2.8.3. SWOT Analysis
- 14.2.8.4. Recent Developments
- 14.2.8.5. Financials (Based on Availability)
- 14.2.9 Damen Shipyard Group
- 14.2.9.1. Overview
- 14.2.9.2. Products
- 14.2.9.3. SWOT Analysis
- 14.2.9.4. Recent Developments
- 14.2.9.5. Financials (Based on Availability)
- 14.2.10 Walker's Bay
- 14.2.10.1. Overview
- 14.2.10.2. Products
- 14.2.10.3. SWOT Analysis
- 14.2.10.4. Recent Developments
- 14.2.10.5. Financials (Based on Availability)
- 14.2.1 Grand Marine International Inc
List of Figures
- Figure 1: Global Inflatable Boat Industry Revenue Breakdown (Million, %) by Region 2024 & 2032
- Figure 2: North America Inflatable Boat Industry Revenue (Million), by Country 2024 & 2032
- Figure 3: North America Inflatable Boat Industry Revenue Share (%), by Country 2024 & 2032
- Figure 4: Europe Inflatable Boat Industry Revenue (Million), by Country 2024 & 2032
- Figure 5: Europe Inflatable Boat Industry Revenue Share (%), by Country 2024 & 2032
- Figure 6: Asia Pacific Inflatable Boat Industry Revenue (Million), by Country 2024 & 2032
- Figure 7: Asia Pacific Inflatable Boat Industry Revenue Share (%), by Country 2024 & 2032
- Figure 8: Rest of the World Inflatable Boat Industry Revenue (Million), by Country 2024 & 2032
- Figure 9: Rest of the World Inflatable Boat Industry Revenue Share (%), by Country 2024 & 2032
- Figure 10: North America Inflatable Boat Industry Revenue (Million), by End-User Type 2024 & 2032
- Figure 11: North America Inflatable Boat Industry Revenue Share (%), by End-User Type 2024 & 2032
- Figure 12: North America Inflatable Boat Industry Revenue (Million), by Boat Type 2024 & 2032
- Figure 13: North America Inflatable Boat Industry Revenue Share (%), by Boat Type 2024 & 2032
- Figure 14: North America Inflatable Boat Industry Revenue (Million), by Country 2024 & 2032
- Figure 15: North America Inflatable Boat Industry Revenue Share (%), by Country 2024 & 2032
- Figure 16: Europe Inflatable Boat Industry Revenue (Million), by End-User Type 2024 & 2032
- Figure 17: Europe Inflatable Boat Industry Revenue Share (%), by End-User Type 2024 & 2032
- Figure 18: Europe Inflatable Boat Industry Revenue (Million), by Boat Type 2024 & 2032
- Figure 19: Europe Inflatable Boat Industry Revenue Share (%), by Boat Type 2024 & 2032
- Figure 20: Europe Inflatable Boat Industry Revenue (Million), by Country 2024 & 2032
- Figure 21: Europe Inflatable Boat Industry Revenue Share (%), by Country 2024 & 2032
- Figure 22: Asia Pacific Inflatable Boat Industry Revenue (Million), by End-User Type 2024 & 2032
- Figure 23: Asia Pacific Inflatable Boat Industry Revenue Share (%), by End-User Type 2024 & 2032
- Figure 24: Asia Pacific Inflatable Boat Industry Revenue (Million), by Boat Type 2024 & 2032
- Figure 25: Asia Pacific Inflatable Boat Industry Revenue Share (%), by Boat Type 2024 & 2032
- Figure 26: Asia Pacific Inflatable Boat Industry Revenue (Million), by Country 2024 & 2032
- Figure 27: Asia Pacific Inflatable Boat Industry Revenue Share (%), by Country 2024 & 2032
- Figure 28: Rest of the World Inflatable Boat Industry Revenue (Million), by End-User Type 2024 & 2032
- Figure 29: Rest of the World Inflatable Boat Industry Revenue Share (%), by End-User Type 2024 & 2032
- Figure 30: Rest of the World Inflatable Boat Industry Revenue (Million), by Boat Type 2024 & 2032
- Figure 31: Rest of the World Inflatable Boat Industry Revenue Share (%), by Boat Type 2024 & 2032
- Figure 32: Rest of the World Inflatable Boat Industry Revenue (Million), by Country 2024 & 2032
- Figure 33: Rest of the World Inflatable Boat Industry Revenue Share (%), by Country 2024 & 2032
List of Tables
- Table 1: Global Inflatable Boat Industry Revenue Million Forecast, by Region 2019 & 2032
- Table 2: Global Inflatable Boat Industry Revenue Million Forecast, by End-User Type 2019 & 2032
- Table 3: Global Inflatable Boat Industry Revenue Million Forecast, by Boat Type 2019 & 2032
- Table 4: Global Inflatable Boat Industry Revenue Million Forecast, by Region 2019 & 2032
- Table 5: Global Inflatable Boat Industry Revenue Million Forecast, by Country 2019 & 2032
- Table 6: United States Inflatable Boat Industry Revenue (Million) Forecast, by Application 2019 & 2032
- Table 7: Canada Inflatable Boat Industry Revenue (Million) Forecast, by Application 2019 & 2032
- Table 8: Rest of North America Inflatable Boat Industry Revenue (Million) Forecast, by Application 2019 & 2032
- Table 9: Global Inflatable Boat Industry Revenue Million Forecast, by Country 2019 & 2032
- Table 10: Germany Inflatable Boat Industry Revenue (Million) Forecast, by Application 2019 & 2032
- Table 11: United Kingdom Inflatable Boat Industry Revenue (Million) Forecast, by Application 2019 & 2032
- Table 12: France Inflatable Boat Industry Revenue (Million) Forecast, by Application 2019 & 2032
- Table 13: Rest of Europe Inflatable Boat Industry Revenue (Million) Forecast, by Application 2019 & 2032
- Table 14: Global Inflatable Boat Industry Revenue Million Forecast, by Country 2019 & 2032
- Table 15: India Inflatable Boat Industry Revenue (Million) Forecast, by Application 2019 & 2032
- Table 16: China Inflatable Boat Industry Revenue (Million) Forecast, by Application 2019 & 2032
- Table 17: Japan Inflatable Boat Industry Revenue (Million) Forecast, by Application 2019 & 2032
- Table 18: South Korea Inflatable Boat Industry Revenue (Million) Forecast, by Application 2019 & 2032
- Table 19: Rest of Asia Pacific Inflatable Boat Industry Revenue (Million) Forecast, by Application 2019 & 2032
- Table 20: Global Inflatable Boat Industry Revenue Million Forecast, by Country 2019 & 2032
- Table 21: Brazil Inflatable Boat Industry Revenue (Million) Forecast, by Application 2019 & 2032
- Table 22: Mexico Inflatable Boat Industry Revenue (Million) Forecast, by Application 2019 & 2032
- Table 23: United Arab Emirates Inflatable Boat Industry Revenue (Million) Forecast, by Application 2019 & 2032
- Table 24: Other Countries Inflatable Boat Industry Revenue (Million) Forecast, by Application 2019 & 2032
- Table 25: Global Inflatable Boat Industry Revenue Million Forecast, by End-User Type 2019 & 2032
- Table 26: Global Inflatable Boat Industry Revenue Million Forecast, by Boat Type 2019 & 2032
- Table 27: Global Inflatable Boat Industry Revenue Million Forecast, by Country 2019 & 2032
- Table 28: United States Inflatable Boat Industry Revenue (Million) Forecast, by Application 2019 & 2032
- Table 29: Canada Inflatable Boat Industry Revenue (Million) Forecast, by Application 2019 & 2032
- Table 30: Rest of North America Inflatable Boat Industry Revenue (Million) Forecast, by Application 2019 & 2032
- Table 31: Global Inflatable Boat Industry Revenue Million Forecast, by End-User Type 2019 & 2032
- Table 32: Global Inflatable Boat Industry Revenue Million Forecast, by Boat Type 2019 & 2032
- Table 33: Global Inflatable Boat Industry Revenue Million Forecast, by Country 2019 & 2032
- Table 34: Germany Inflatable Boat Industry Revenue (Million) Forecast, by Application 2019 & 2032
- Table 35: United Kingdom Inflatable Boat Industry Revenue (Million) Forecast, by Application 2019 & 2032
- Table 36: France Inflatable Boat Industry Revenue (Million) Forecast, by Application 2019 & 2032
- Table 37: Rest of Europe Inflatable Boat Industry Revenue (Million) Forecast, by Application 2019 & 2032
- Table 38: Global Inflatable Boat Industry Revenue Million Forecast, by End-User Type 2019 & 2032
- Table 39: Global Inflatable Boat Industry Revenue Million Forecast, by Boat Type 2019 & 2032
- Table 40: Global Inflatable Boat Industry Revenue Million Forecast, by Country 2019 & 2032
- Table 41: India Inflatable Boat Industry Revenue (Million) Forecast, by Application 2019 & 2032
- Table 42: China Inflatable Boat Industry Revenue (Million) Forecast, by Application 2019 & 2032
- Table 43: Japan Inflatable Boat Industry Revenue (Million) Forecast, by Application 2019 & 2032
- Table 44: South Korea Inflatable Boat Industry Revenue (Million) Forecast, by Application 2019 & 2032
- Table 45: Rest of Asia Pacific Inflatable Boat Industry Revenue (Million) Forecast, by Application 2019 & 2032
- Table 46: Global Inflatable Boat Industry Revenue Million Forecast, by End-User Type 2019 & 2032
- Table 47: Global Inflatable Boat Industry Revenue Million Forecast, by Boat Type 2019 & 2032
- Table 48: Global Inflatable Boat Industry Revenue Million Forecast, by Country 2019 & 2032
- Table 49: Brazil Inflatable Boat Industry Revenue (Million) Forecast, by Application 2019 & 2032
- Table 50: Mexico Inflatable Boat Industry Revenue (Million) Forecast, by Application 2019 & 2032
- Table 51: United Arab Emirates Inflatable Boat Industry Revenue (Million) Forecast, by Application 2019 & 2032
- Table 52: Other Countries Inflatable Boat Industry Revenue (Million) Forecast, by Application 2019 & 2032
Frequently Asked Questions
1. What is the projected Compound Annual Growth Rate (CAGR) of the Inflatable Boat Industry?
The projected CAGR is approximately 6.75%.
2. Which companies are prominent players in the Inflatable Boat Industry?
Key companies in the market include Grand Marine International Inc, Maxxon Inflatable Boats, *List Not Exhaustive, Ribcraft USA LLC, AB Inflatables Crafts, Zodiac Nautic, Survitec Group Limited, Mercury Marine, Damen Shipyard Group, Walker's Bay.
3. What are the main segments of the Inflatable Boat Industry?
The market segments include End-User Type, Boat Type.
4. Can you provide details about the market size?
The market size is estimated to be USD 0.98 Million as of 2022.
5. What are some drivers contributing to market growth?
Increasing Demand For Electric Vehicles is Anticipated to Boost the Market.
6. What are the notable trends driving market growth?
Leisure Segment is Expected to Dominate.
7. Are there any restraints impacting market growth?
High Cost Associated with Electric Vehicles is Anticipated to Restrain the Growth of the Market.
8. Can you provide examples of recent developments in the market?
N/A
9. What pricing options are available for accessing the report?
Pricing options include single-user, multi-user, and enterprise licenses priced at USD 4750, USD 5250, and USD 8750 respectively.
10. Is the market size provided in terms of value or volume?
The market size is provided in terms of value, measured in Million.
11. Are there any specific market keywords associated with the report?
Yes, the market keyword associated with the report is "Inflatable Boat Industry," which aids in identifying and referencing the specific market segment covered.
12. How do I determine which pricing option suits my needs best?
The pricing options vary based on user requirements and access needs. Individual users may opt for single-user licenses, while businesses requiring broader access may choose multi-user or enterprise licenses for cost-effective access to the report.
13. Are there any additional resources or data provided in the Inflatable Boat Industry report?
While the report offers comprehensive insights, it's advisable to review the specific contents or supplementary materials provided to ascertain if additional resources or data are available.
14. How can I stay updated on further developments or reports in the Inflatable Boat Industry?
To stay informed about further developments, trends, and reports in the Inflatable Boat Industry, consider subscribing to industry newsletters, following relevant companies and organizations, or regularly checking reputable industry news sources and publications.
Methodology
Step 1 - Identification of Relevant Samples Size from Population Database


Step 2 - Approaches for Defining Global Market Size (Value, Volume* & Price*)

Note*: In applicable scenarios
Step 3 - Data Sources
Primary Research
- Web Analytics
- Survey Reports
- Research Institute
- Latest Research Reports
- Opinion Leaders
Secondary Research
- Annual Reports
- White Paper
- Latest Press Release
- Industry Association
- Paid Database
- Investor Presentations

Step 4 - Data Triangulation
Involves using different sources of information in order to increase the validity of a study
These sources are likely to be stakeholders in a program - participants, other researchers, program staff, other community members, and so on.
Then we put all data in single framework & apply various statistical tools to find out the dynamic on the market.
During the analysis stage, feedback from the stakeholder groups would be compared to determine areas of agreement as well as areas of divergence


