
Key Insights
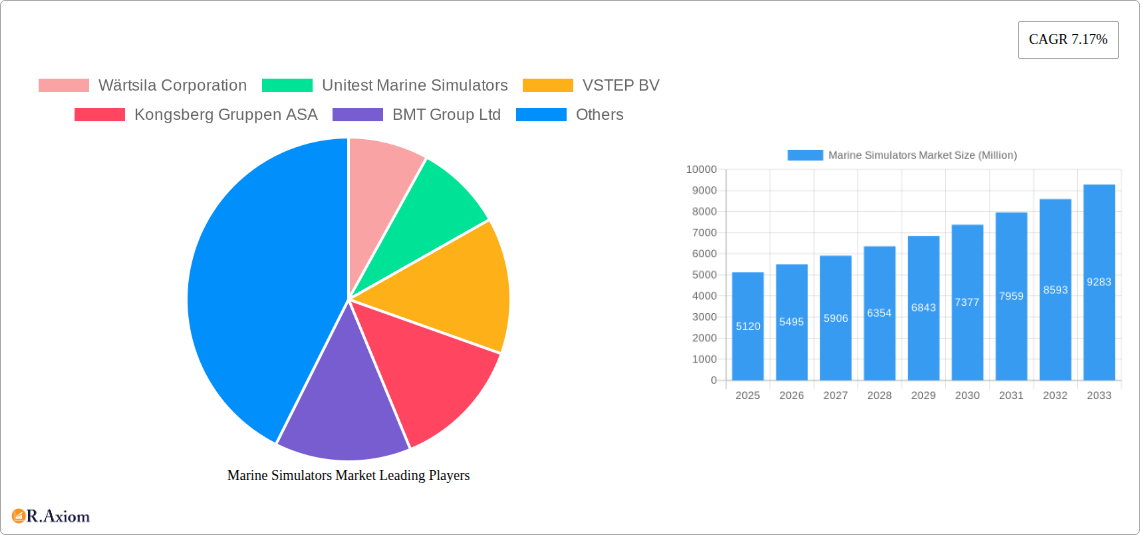
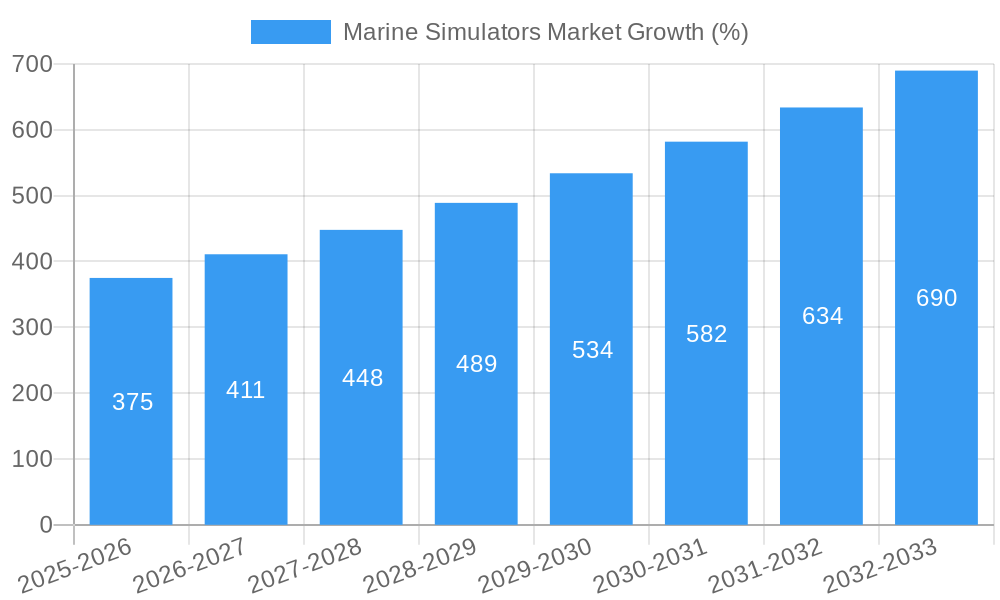
The global marine simulator market is experiencing robust growth, projected to reach \$5.12 billion in 2025 and maintain a Compound Annual Growth Rate (CAGR) of 7.17% from 2025 to 2033. This expansion is driven by several key factors. Increasing demand for enhanced maritime training to improve safety and operational efficiency is a significant driver. Stringent regulatory requirements mandating higher training standards across various maritime sectors, including commercial shipping, offshore oil and gas, and naval operations, are further fueling market growth. Technological advancements, such as the integration of advanced simulation technologies like virtual reality (VR) and augmented reality (AR), are enhancing the realism and effectiveness of training programs, leading to increased adoption. Furthermore, the rising focus on cost optimization within maritime operations and the growing preference for cost-effective training solutions are also contributing positively to market expansion. Key players like Wärtsilä Corporation, Kongsberg Gruppen ASA, and VSTEP BV are leveraging these trends to develop and offer innovative simulation solutions.
The market segmentation reveals a diverse landscape, with various types of simulators catering to specific training needs. Full-mission bridge simulators are likely the largest segment, given their comprehensive functionality. This segment is likely experiencing considerable growth due to the increasing complexity of modern vessels and navigational challenges. Other segments, such as engine room simulators and specialized simulators for specific vessel types (e.g., tankers, cruise ships), also contribute to the overall market value. Regionally, North America and Europe are currently likely to hold substantial market share, driven by the presence of major maritime training institutions and a strong regulatory framework. However, Asia-Pacific is poised for significant growth, driven by increasing maritime activities and investments in maritime infrastructure across the region. The market's future growth will depend on sustained regulatory pressure for improved maritime safety, continued technological innovation, and increased investments in maritime training infrastructure.
This in-depth report provides a comprehensive analysis of the global Marine Simulators Market, covering the period 2019-2033. With a focus on market dynamics, competitive landscapes, and future growth projections, this report is an essential resource for industry stakeholders, investors, and strategic decision-makers. The report utilizes data from the historical period (2019-2024), the base year (2025), and provides estimations for the forecast period (2025-2033). The total market size is projected to reach xx Million by 2033, exhibiting a CAGR of xx% during the forecast period.
Marine Simulators Market Concentration & Innovation
The Marine Simulators market exhibits a moderately concentrated landscape, with key players such as Wärtsilä Corporation, Kongsberg Gruppen ASA, and BMT Group Ltd holding significant market share. Precise market share figures for individual companies are unavailable and require further investigation for this particular report. However, the market is characterized by ongoing innovation driven by the need for enhanced realism, advanced training capabilities, and cost-effective solutions. Regulatory frameworks, particularly concerning safety and training standards, significantly influence market dynamics. While direct substitutes are limited, the emergence of advanced simulation technologies from other industries could pose potential competition.
- Market Concentration: Moderately concentrated, with a few dominant players.
- Innovation Drivers: Demand for realistic simulations, advanced training features (e.g., AR/VR integration), and cost optimization.
- Regulatory Frameworks: Stringent safety and training standards influencing product development and adoption.
- Product Substitutes: Limited direct substitutes, but potential indirect competition from advanced simulation technologies in other sectors.
- End-User Trends: Growing emphasis on digitalization, improved crew training efficiency, and reduced operational costs.
- M&A Activities: While precise deal values are unavailable at this time, M&A activities within the industry are expected to be xx Million during the forecast period, driven by the desire for expansion and technological enhancement.
Marine Simulators Market Industry Trends & Insights
The global Marine Simulators market is experiencing robust growth, driven by factors such as increasing demand for skilled maritime professionals, stricter regulatory compliance requirements, and technological advancements. The market's expansion is particularly fueled by the rising adoption of sophisticated simulation technologies, including augmented reality (AR) and virtual reality (VR) systems. The integration of these technologies creates immersive and realistic training environments, thereby enhancing the effectiveness of training programs and improving the overall safety and proficiency of maritime personnel.
Furthermore, the global maritime industry's focus on operational efficiency and cost reduction is driving the adoption of marine simulators as cost-effective alternatives to traditional on-the-job training methods. This trend is expected to propel market growth further in the coming years. The market penetration rate for marine simulators in the maritime training sector is estimated to be xx% in 2025, expected to grow to xx% by 2033. The projected market size increase during the forecast period can be attributed to these key trends, resulting in a significant market growth opportunity. The competition in the market remains strong, with key players continuously striving to enhance their product offerings and expand their market reach.
Dominant Markets & Segments in Marine Simulators Market
The Asia-Pacific region is currently the dominant market for marine simulators, driven by strong economic growth, expanding maritime activities, and increased investment in maritime infrastructure development. China and other countries in the region are experiencing significant growth in their maritime industries, resulting in a high demand for advanced training solutions that marine simulators provide. The segment showing the most robust growth is the full-mission bridge simulators, due to the advanced training capabilities they offer.
- Key Drivers for Asia-Pacific Dominance:
- Rapid economic growth and expansion of maritime activities.
- Significant investments in port infrastructure and maritime training centers.
- Increasing demand for skilled maritime professionals.
- Stringent safety regulations and compliance requirements.
- Government support and initiatives promoting maritime sector development.
The dominance of the Asia-Pacific region is expected to continue throughout the forecast period, driven by ongoing infrastructure development and expanding maritime operations. Other regions, such as Europe and North America, are also showing considerable growth, albeit at a slower rate than Asia-Pacific.
Marine Simulators Market Product Developments
Recent product innovations have focused on enhancing realism, incorporating advanced technologies like AR/VR, and developing more cost-effective solutions. Full-mission bridge simulators are becoming increasingly sophisticated, integrating advanced sensor systems and dynamic environmental modeling. This improved realism ensures that trainees receive more realistic and effective training. The competitive advantage is derived from the ability to provide highly realistic, cost-effective, and engaging training experiences that improve maritime safety and operational efficiency.
Report Scope & Segmentation Analysis
This report segments the marine simulators market by type (full-mission bridge simulators, part-task trainers, and others), application (training, simulation, and others), and region (North America, Europe, Asia-Pacific, Middle East & Africa, and South America). Each segment's market size and growth projections are analyzed, along with insights into the competitive dynamics within each segment. The growth projections are based on various factors, including market size in the base year, forecast period, CAGR, and anticipated changes in demand. For example, the full-mission bridge simulator segment is projected to maintain a significant market share due to its extensive training capabilities.
Key Drivers of Marine Simulators Market Growth
Several factors are driving the growth of the marine simulators market. These include:
- Technological advancements: The integration of AR/VR and advanced simulation technologies enhances realism and training effectiveness.
- Stringent safety regulations: Increased emphasis on maritime safety mandates effective training programs, driving demand for simulators.
- Cost-effectiveness: Simulators offer a cost-effective alternative to traditional on-the-job training.
- Growing demand for skilled maritime professionals: The expanding global maritime industry requires a well-trained workforce.
Challenges in the Marine Simulators Market Sector
The Marine Simulators market faces challenges such as high initial investment costs for advanced systems, the need for continuous software updates and maintenance, and competition from alternative training methods. Supply chain disruptions could also impact the availability and pricing of components. Regulatory changes and evolving maritime safety standards require constant adaptation. These factors can influence market growth and profitability.
Emerging Opportunities in Marine Simulators Market
Emerging opportunities include the expansion into new geographic markets, especially developing economies with growing maritime sectors. The incorporation of AI and machine learning into simulators offers the potential for personalized and adaptive training programs. Furthermore, the development of cloud-based simulators could improve accessibility and reduce infrastructure costs.
Leading Players in the Marine Simulators Market Market
- Wärtsilä Corporation
- Unitest Marine Simulators
- VSTEP BV
- Kongsberg Gruppen ASA
- BMT Group Ltd
- Virtual Marine Inc
- FORCE Technology
- NAUDEQ
- Altair Engineering Inc
- Global Dynamic Systems
- Pivot Maritime International
Key Developments in Marine Simulators Market Industry
- May 2023: The MoD awarded BMT a hydrodynamic marine simulator training contract for the Queen Elizabeth-class aircraft carriers, highlighting the increasing demand for advanced training solutions in the naval sector.
- January 2024: FORCE Technology's SimFlex4 AR solution was implemented at Smartship Australia, showcasing the growing adoption of AR technology in maritime simulation. This signifies a significant trend towards enhanced realism and immersive training experiences.
Strategic Outlook for Marine Simulators Market Market
The future of the marine simulators market is bright, driven by continuous technological innovation, increasing demand for skilled maritime personnel, and a growing focus on safety and efficiency. The integration of AI, VR/AR, and cloud technologies will further enhance the realism and effectiveness of simulators, creating new market opportunities and driving significant growth in the coming years. The market is projected to experience substantial growth, driven by the aforementioned factors. Companies that can adapt quickly to technological advancements and meet the evolving training needs of the maritime industry are poised for success.
Marine Simulators Market Segmentation
-
1. Type
- 1.1. Ship Bridge Simulators
- 1.2. Engine Room Simulators
- 1.3. Cargo Handling Simulators
- 1.4. Communic
- 1.5. Other Types
-
2. Application
- 2.1. Training and Education
- 2.2. Fleet Operations
- 2.3. Port and Terminal Operations
-
3. End Use
- 3.1. Commercial
- 3.2. Military
Marine Simulators Market Segmentation By Geography
-
1. North America
- 1.1. United States
- 1.2. Canada
-
2. Europe
- 2.1. Germany
- 2.2. United Kingdom
- 2.3. Russia
- 2.4. France
- 2.5. Rest of Europe
-
3. Asia Pacific
- 3.1. India
- 3.2. China
- 3.3. Japan
- 3.4. South Korea
- 3.5. Rest of Asia Pacific
-
4. Latin America
- 4.1. Brazil
- 4.2. Rest of Latin America
-
5. Middle East and Africa
- 5.1. United Arab Emirates
- 5.2. Saudi Arabia
- 5.3. Israel
- 5.4. Rest of Middle East and Africa

Marine Simulators Market REPORT HIGHLIGHTS
| Aspects | Details |
|---|---|
| Study Period | 2019-2033 |
| Base Year | 2024 |
| Estimated Year | 2025 |
| Forecast Period | 2025-2033 |
| Historical Period | 2019-2024 |
| Growth Rate | CAGR of 7.17% from 2019-2033 |
| Segmentation |
|
Table of Contents
- 1. Introduction
- 1.1. Research Scope
- 1.2. Market Segmentation
- 1.3. Research Methodology
- 1.4. Definitions and Assumptions
- 2. Executive Summary
- 2.1. Introduction
- 3. Market Dynamics
- 3.1. Introduction
- 3.2. Market Drivers
- 3.3. Market Restrains
- 3.4. Market Trends
- 3.4.1. The Military Segment is Expected to Showcase Significant Growth During the Forecast Period
- 4. Market Factor Analysis
- 4.1. Porters Five Forces
- 4.2. Supply/Value Chain
- 4.3. PESTEL analysis
- 4.4. Market Entropy
- 4.5. Patent/Trademark Analysis
- 5. Global Marine Simulators Market Analysis, Insights and Forecast, 2019-2031
- 5.1. Market Analysis, Insights and Forecast - by Type
- 5.1.1. Ship Bridge Simulators
- 5.1.2. Engine Room Simulators
- 5.1.3. Cargo Handling Simulators
- 5.1.4. Communic
- 5.1.5. Other Types
- 5.2. Market Analysis, Insights and Forecast - by Application
- 5.2.1. Training and Education
- 5.2.2. Fleet Operations
- 5.2.3. Port and Terminal Operations
- 5.3. Market Analysis, Insights and Forecast - by End Use
- 5.3.1. Commercial
- 5.3.2. Military
- 5.4. Market Analysis, Insights and Forecast - by Region
- 5.4.1. North America
- 5.4.2. Europe
- 5.4.3. Asia Pacific
- 5.4.4. Latin America
- 5.4.5. Middle East and Africa
- 5.1. Market Analysis, Insights and Forecast - by Type
- 6. North America Marine Simulators Market Analysis, Insights and Forecast, 2019-2031
- 6.1. Market Analysis, Insights and Forecast - by Type
- 6.1.1. Ship Bridge Simulators
- 6.1.2. Engine Room Simulators
- 6.1.3. Cargo Handling Simulators
- 6.1.4. Communic
- 6.1.5. Other Types
- 6.2. Market Analysis, Insights and Forecast - by Application
- 6.2.1. Training and Education
- 6.2.2. Fleet Operations
- 6.2.3. Port and Terminal Operations
- 6.3. Market Analysis, Insights and Forecast - by End Use
- 6.3.1. Commercial
- 6.3.2. Military
- 6.1. Market Analysis, Insights and Forecast - by Type
- 7. Europe Marine Simulators Market Analysis, Insights and Forecast, 2019-2031
- 7.1. Market Analysis, Insights and Forecast - by Type
- 7.1.1. Ship Bridge Simulators
- 7.1.2. Engine Room Simulators
- 7.1.3. Cargo Handling Simulators
- 7.1.4. Communic
- 7.1.5. Other Types
- 7.2. Market Analysis, Insights and Forecast - by Application
- 7.2.1. Training and Education
- 7.2.2. Fleet Operations
- 7.2.3. Port and Terminal Operations
- 7.3. Market Analysis, Insights and Forecast - by End Use
- 7.3.1. Commercial
- 7.3.2. Military
- 7.1. Market Analysis, Insights and Forecast - by Type
- 8. Asia Pacific Marine Simulators Market Analysis, Insights and Forecast, 2019-2031
- 8.1. Market Analysis, Insights and Forecast - by Type
- 8.1.1. Ship Bridge Simulators
- 8.1.2. Engine Room Simulators
- 8.1.3. Cargo Handling Simulators
- 8.1.4. Communic
- 8.1.5. Other Types
- 8.2. Market Analysis, Insights and Forecast - by Application
- 8.2.1. Training and Education
- 8.2.2. Fleet Operations
- 8.2.3. Port and Terminal Operations
- 8.3. Market Analysis, Insights and Forecast - by End Use
- 8.3.1. Commercial
- 8.3.2. Military
- 8.1. Market Analysis, Insights and Forecast - by Type
- 9. Latin America Marine Simulators Market Analysis, Insights and Forecast, 2019-2031
- 9.1. Market Analysis, Insights and Forecast - by Type
- 9.1.1. Ship Bridge Simulators
- 9.1.2. Engine Room Simulators
- 9.1.3. Cargo Handling Simulators
- 9.1.4. Communic
- 9.1.5. Other Types
- 9.2. Market Analysis, Insights and Forecast - by Application
- 9.2.1. Training and Education
- 9.2.2. Fleet Operations
- 9.2.3. Port and Terminal Operations
- 9.3. Market Analysis, Insights and Forecast - by End Use
- 9.3.1. Commercial
- 9.3.2. Military
- 9.1. Market Analysis, Insights and Forecast - by Type
- 10. Middle East and Africa Marine Simulators Market Analysis, Insights and Forecast, 2019-2031
- 10.1. Market Analysis, Insights and Forecast - by Type
- 10.1.1. Ship Bridge Simulators
- 10.1.2. Engine Room Simulators
- 10.1.3. Cargo Handling Simulators
- 10.1.4. Communic
- 10.1.5. Other Types
- 10.2. Market Analysis, Insights and Forecast - by Application
- 10.2.1. Training and Education
- 10.2.2. Fleet Operations
- 10.2.3. Port and Terminal Operations
- 10.3. Market Analysis, Insights and Forecast - by End Use
- 10.3.1. Commercial
- 10.3.2. Military
- 10.1. Market Analysis, Insights and Forecast - by Type
- 11. Competitive Analysis
- 11.1. Global Market Share Analysis 2024
- 11.2. Company Profiles
- 11.2.1 Wärtsila Corporation
- 11.2.1.1. Overview
- 11.2.1.2. Products
- 11.2.1.3. SWOT Analysis
- 11.2.1.4. Recent Developments
- 11.2.1.5. Financials (Based on Availability)
- 11.2.2 Unitest Marine Simulators
- 11.2.2.1. Overview
- 11.2.2.2. Products
- 11.2.2.3. SWOT Analysis
- 11.2.2.4. Recent Developments
- 11.2.2.5. Financials (Based on Availability)
- 11.2.3 VSTEP BV
- 11.2.3.1. Overview
- 11.2.3.2. Products
- 11.2.3.3. SWOT Analysis
- 11.2.3.4. Recent Developments
- 11.2.3.5. Financials (Based on Availability)
- 11.2.4 Kongsberg Gruppen ASA
- 11.2.4.1. Overview
- 11.2.4.2. Products
- 11.2.4.3. SWOT Analysis
- 11.2.4.4. Recent Developments
- 11.2.4.5. Financials (Based on Availability)
- 11.2.5 BMT Group Ltd
- 11.2.5.1. Overview
- 11.2.5.2. Products
- 11.2.5.3. SWOT Analysis
- 11.2.5.4. Recent Developments
- 11.2.5.5. Financials (Based on Availability)
- 11.2.6 Virtual Marine Inc
- 11.2.6.1. Overview
- 11.2.6.2. Products
- 11.2.6.3. SWOT Analysis
- 11.2.6.4. Recent Developments
- 11.2.6.5. Financials (Based on Availability)
- 11.2.7 FORCE Technology
- 11.2.7.1. Overview
- 11.2.7.2. Products
- 11.2.7.3. SWOT Analysis
- 11.2.7.4. Recent Developments
- 11.2.7.5. Financials (Based on Availability)
- 11.2.8 NAUDEQ
- 11.2.8.1. Overview
- 11.2.8.2. Products
- 11.2.8.3. SWOT Analysis
- 11.2.8.4. Recent Developments
- 11.2.8.5. Financials (Based on Availability)
- 11.2.9 Altair Engineering Inc
- 11.2.9.1. Overview
- 11.2.9.2. Products
- 11.2.9.3. SWOT Analysis
- 11.2.9.4. Recent Developments
- 11.2.9.5. Financials (Based on Availability)
- 11.2.10 Global Dynamic Systems
- 11.2.10.1. Overview
- 11.2.10.2. Products
- 11.2.10.3. SWOT Analysis
- 11.2.10.4. Recent Developments
- 11.2.10.5. Financials (Based on Availability)
- 11.2.11 Pivot Maritime Internationa
- 11.2.11.1. Overview
- 11.2.11.2. Products
- 11.2.11.3. SWOT Analysis
- 11.2.11.4. Recent Developments
- 11.2.11.5. Financials (Based on Availability)
- 11.2.1 Wärtsila Corporation
List of Figures
- Figure 1: Global Marine Simulators Market Revenue Breakdown (Million, %) by Region 2024 & 2032
- Figure 2: Global Marine Simulators Market Volume Breakdown (Billion, %) by Region 2024 & 2032
- Figure 3: North America Marine Simulators Market Revenue (Million), by Type 2024 & 2032
- Figure 4: North America Marine Simulators Market Volume (Billion), by Type 2024 & 2032
- Figure 5: North America Marine Simulators Market Revenue Share (%), by Type 2024 & 2032
- Figure 6: North America Marine Simulators Market Volume Share (%), by Type 2024 & 2032
- Figure 7: North America Marine Simulators Market Revenue (Million), by Application 2024 & 2032
- Figure 8: North America Marine Simulators Market Volume (Billion), by Application 2024 & 2032
- Figure 9: North America Marine Simulators Market Revenue Share (%), by Application 2024 & 2032
- Figure 10: North America Marine Simulators Market Volume Share (%), by Application 2024 & 2032
- Figure 11: North America Marine Simulators Market Revenue (Million), by End Use 2024 & 2032
- Figure 12: North America Marine Simulators Market Volume (Billion), by End Use 2024 & 2032
- Figure 13: North America Marine Simulators Market Revenue Share (%), by End Use 2024 & 2032
- Figure 14: North America Marine Simulators Market Volume Share (%), by End Use 2024 & 2032
- Figure 15: North America Marine Simulators Market Revenue (Million), by Country 2024 & 2032
- Figure 16: North America Marine Simulators Market Volume (Billion), by Country 2024 & 2032
- Figure 17: North America Marine Simulators Market Revenue Share (%), by Country 2024 & 2032
- Figure 18: North America Marine Simulators Market Volume Share (%), by Country 2024 & 2032
- Figure 19: Europe Marine Simulators Market Revenue (Million), by Type 2024 & 2032
- Figure 20: Europe Marine Simulators Market Volume (Billion), by Type 2024 & 2032
- Figure 21: Europe Marine Simulators Market Revenue Share (%), by Type 2024 & 2032
- Figure 22: Europe Marine Simulators Market Volume Share (%), by Type 2024 & 2032
- Figure 23: Europe Marine Simulators Market Revenue (Million), by Application 2024 & 2032
- Figure 24: Europe Marine Simulators Market Volume (Billion), by Application 2024 & 2032
- Figure 25: Europe Marine Simulators Market Revenue Share (%), by Application 2024 & 2032
- Figure 26: Europe Marine Simulators Market Volume Share (%), by Application 2024 & 2032
- Figure 27: Europe Marine Simulators Market Revenue (Million), by End Use 2024 & 2032
- Figure 28: Europe Marine Simulators Market Volume (Billion), by End Use 2024 & 2032
- Figure 29: Europe Marine Simulators Market Revenue Share (%), by End Use 2024 & 2032
- Figure 30: Europe Marine Simulators Market Volume Share (%), by End Use 2024 & 2032
- Figure 31: Europe Marine Simulators Market Revenue (Million), by Country 2024 & 2032
- Figure 32: Europe Marine Simulators Market Volume (Billion), by Country 2024 & 2032
- Figure 33: Europe Marine Simulators Market Revenue Share (%), by Country 2024 & 2032
- Figure 34: Europe Marine Simulators Market Volume Share (%), by Country 2024 & 2032
- Figure 35: Asia Pacific Marine Simulators Market Revenue (Million), by Type 2024 & 2032
- Figure 36: Asia Pacific Marine Simulators Market Volume (Billion), by Type 2024 & 2032
- Figure 37: Asia Pacific Marine Simulators Market Revenue Share (%), by Type 2024 & 2032
- Figure 38: Asia Pacific Marine Simulators Market Volume Share (%), by Type 2024 & 2032
- Figure 39: Asia Pacific Marine Simulators Market Revenue (Million), by Application 2024 & 2032
- Figure 40: Asia Pacific Marine Simulators Market Volume (Billion), by Application 2024 & 2032
- Figure 41: Asia Pacific Marine Simulators Market Revenue Share (%), by Application 2024 & 2032
- Figure 42: Asia Pacific Marine Simulators Market Volume Share (%), by Application 2024 & 2032
- Figure 43: Asia Pacific Marine Simulators Market Revenue (Million), by End Use 2024 & 2032
- Figure 44: Asia Pacific Marine Simulators Market Volume (Billion), by End Use 2024 & 2032
- Figure 45: Asia Pacific Marine Simulators Market Revenue Share (%), by End Use 2024 & 2032
- Figure 46: Asia Pacific Marine Simulators Market Volume Share (%), by End Use 2024 & 2032
- Figure 47: Asia Pacific Marine Simulators Market Revenue (Million), by Country 2024 & 2032
- Figure 48: Asia Pacific Marine Simulators Market Volume (Billion), by Country 2024 & 2032
- Figure 49: Asia Pacific Marine Simulators Market Revenue Share (%), by Country 2024 & 2032
- Figure 50: Asia Pacific Marine Simulators Market Volume Share (%), by Country 2024 & 2032
- Figure 51: Latin America Marine Simulators Market Revenue (Million), by Type 2024 & 2032
- Figure 52: Latin America Marine Simulators Market Volume (Billion), by Type 2024 & 2032
- Figure 53: Latin America Marine Simulators Market Revenue Share (%), by Type 2024 & 2032
- Figure 54: Latin America Marine Simulators Market Volume Share (%), by Type 2024 & 2032
- Figure 55: Latin America Marine Simulators Market Revenue (Million), by Application 2024 & 2032
- Figure 56: Latin America Marine Simulators Market Volume (Billion), by Application 2024 & 2032
- Figure 57: Latin America Marine Simulators Market Revenue Share (%), by Application 2024 & 2032
- Figure 58: Latin America Marine Simulators Market Volume Share (%), by Application 2024 & 2032
- Figure 59: Latin America Marine Simulators Market Revenue (Million), by End Use 2024 & 2032
- Figure 60: Latin America Marine Simulators Market Volume (Billion), by End Use 2024 & 2032
- Figure 61: Latin America Marine Simulators Market Revenue Share (%), by End Use 2024 & 2032
- Figure 62: Latin America Marine Simulators Market Volume Share (%), by End Use 2024 & 2032
- Figure 63: Latin America Marine Simulators Market Revenue (Million), by Country 2024 & 2032
- Figure 64: Latin America Marine Simulators Market Volume (Billion), by Country 2024 & 2032
- Figure 65: Latin America Marine Simulators Market Revenue Share (%), by Country 2024 & 2032
- Figure 66: Latin America Marine Simulators Market Volume Share (%), by Country 2024 & 2032
- Figure 67: Middle East and Africa Marine Simulators Market Revenue (Million), by Type 2024 & 2032
- Figure 68: Middle East and Africa Marine Simulators Market Volume (Billion), by Type 2024 & 2032
- Figure 69: Middle East and Africa Marine Simulators Market Revenue Share (%), by Type 2024 & 2032
- Figure 70: Middle East and Africa Marine Simulators Market Volume Share (%), by Type 2024 & 2032
- Figure 71: Middle East and Africa Marine Simulators Market Revenue (Million), by Application 2024 & 2032
- Figure 72: Middle East and Africa Marine Simulators Market Volume (Billion), by Application 2024 & 2032
- Figure 73: Middle East and Africa Marine Simulators Market Revenue Share (%), by Application 2024 & 2032
- Figure 74: Middle East and Africa Marine Simulators Market Volume Share (%), by Application 2024 & 2032
- Figure 75: Middle East and Africa Marine Simulators Market Revenue (Million), by End Use 2024 & 2032
- Figure 76: Middle East and Africa Marine Simulators Market Volume (Billion), by End Use 2024 & 2032
- Figure 77: Middle East and Africa Marine Simulators Market Revenue Share (%), by End Use 2024 & 2032
- Figure 78: Middle East and Africa Marine Simulators Market Volume Share (%), by End Use 2024 & 2032
- Figure 79: Middle East and Africa Marine Simulators Market Revenue (Million), by Country 2024 & 2032
- Figure 80: Middle East and Africa Marine Simulators Market Volume (Billion), by Country 2024 & 2032
- Figure 81: Middle East and Africa Marine Simulators Market Revenue Share (%), by Country 2024 & 2032
- Figure 82: Middle East and Africa Marine Simulators Market Volume Share (%), by Country 2024 & 2032
List of Tables
- Table 1: Global Marine Simulators Market Revenue Million Forecast, by Region 2019 & 2032
- Table 2: Global Marine Simulators Market Volume Billion Forecast, by Region 2019 & 2032
- Table 3: Global Marine Simulators Market Revenue Million Forecast, by Type 2019 & 2032
- Table 4: Global Marine Simulators Market Volume Billion Forecast, by Type 2019 & 2032
- Table 5: Global Marine Simulators Market Revenue Million Forecast, by Application 2019 & 2032
- Table 6: Global Marine Simulators Market Volume Billion Forecast, by Application 2019 & 2032
- Table 7: Global Marine Simulators Market Revenue Million Forecast, by End Use 2019 & 2032
- Table 8: Global Marine Simulators Market Volume Billion Forecast, by End Use 2019 & 2032
- Table 9: Global Marine Simulators Market Revenue Million Forecast, by Region 2019 & 2032
- Table 10: Global Marine Simulators Market Volume Billion Forecast, by Region 2019 & 2032
- Table 11: Global Marine Simulators Market Revenue Million Forecast, by Type 2019 & 2032
- Table 12: Global Marine Simulators Market Volume Billion Forecast, by Type 2019 & 2032
- Table 13: Global Marine Simulators Market Revenue Million Forecast, by Application 2019 & 2032
- Table 14: Global Marine Simulators Market Volume Billion Forecast, by Application 2019 & 2032
- Table 15: Global Marine Simulators Market Revenue Million Forecast, by End Use 2019 & 2032
- Table 16: Global Marine Simulators Market Volume Billion Forecast, by End Use 2019 & 2032
- Table 17: Global Marine Simulators Market Revenue Million Forecast, by Country 2019 & 2032
- Table 18: Global Marine Simulators Market Volume Billion Forecast, by Country 2019 & 2032
- Table 19: United States Marine Simulators Market Revenue (Million) Forecast, by Application 2019 & 2032
- Table 20: United States Marine Simulators Market Volume (Billion) Forecast, by Application 2019 & 2032
- Table 21: Canada Marine Simulators Market Revenue (Million) Forecast, by Application 2019 & 2032
- Table 22: Canada Marine Simulators Market Volume (Billion) Forecast, by Application 2019 & 2032
- Table 23: Global Marine Simulators Market Revenue Million Forecast, by Type 2019 & 2032
- Table 24: Global Marine Simulators Market Volume Billion Forecast, by Type 2019 & 2032
- Table 25: Global Marine Simulators Market Revenue Million Forecast, by Application 2019 & 2032
- Table 26: Global Marine Simulators Market Volume Billion Forecast, by Application 2019 & 2032
- Table 27: Global Marine Simulators Market Revenue Million Forecast, by End Use 2019 & 2032
- Table 28: Global Marine Simulators Market Volume Billion Forecast, by End Use 2019 & 2032
- Table 29: Global Marine Simulators Market Revenue Million Forecast, by Country 2019 & 2032
- Table 30: Global Marine Simulators Market Volume Billion Forecast, by Country 2019 & 2032
- Table 31: Germany Marine Simulators Market Revenue (Million) Forecast, by Application 2019 & 2032
- Table 32: Germany Marine Simulators Market Volume (Billion) Forecast, by Application 2019 & 2032
- Table 33: United Kingdom Marine Simulators Market Revenue (Million) Forecast, by Application 2019 & 2032
- Table 34: United Kingdom Marine Simulators Market Volume (Billion) Forecast, by Application 2019 & 2032
- Table 35: Russia Marine Simulators Market Revenue (Million) Forecast, by Application 2019 & 2032
- Table 36: Russia Marine Simulators Market Volume (Billion) Forecast, by Application 2019 & 2032
- Table 37: France Marine Simulators Market Revenue (Million) Forecast, by Application 2019 & 2032
- Table 38: France Marine Simulators Market Volume (Billion) Forecast, by Application 2019 & 2032
- Table 39: Rest of Europe Marine Simulators Market Revenue (Million) Forecast, by Application 2019 & 2032
- Table 40: Rest of Europe Marine Simulators Market Volume (Billion) Forecast, by Application 2019 & 2032
- Table 41: Global Marine Simulators Market Revenue Million Forecast, by Type 2019 & 2032
- Table 42: Global Marine Simulators Market Volume Billion Forecast, by Type 2019 & 2032
- Table 43: Global Marine Simulators Market Revenue Million Forecast, by Application 2019 & 2032
- Table 44: Global Marine Simulators Market Volume Billion Forecast, by Application 2019 & 2032
- Table 45: Global Marine Simulators Market Revenue Million Forecast, by End Use 2019 & 2032
- Table 46: Global Marine Simulators Market Volume Billion Forecast, by End Use 2019 & 2032
- Table 47: Global Marine Simulators Market Revenue Million Forecast, by Country 2019 & 2032
- Table 48: Global Marine Simulators Market Volume Billion Forecast, by Country 2019 & 2032
- Table 49: India Marine Simulators Market Revenue (Million) Forecast, by Application 2019 & 2032
- Table 50: India Marine Simulators Market Volume (Billion) Forecast, by Application 2019 & 2032
- Table 51: China Marine Simulators Market Revenue (Million) Forecast, by Application 2019 & 2032
- Table 52: China Marine Simulators Market Volume (Billion) Forecast, by Application 2019 & 2032
- Table 53: Japan Marine Simulators Market Revenue (Million) Forecast, by Application 2019 & 2032
- Table 54: Japan Marine Simulators Market Volume (Billion) Forecast, by Application 2019 & 2032
- Table 55: South Korea Marine Simulators Market Revenue (Million) Forecast, by Application 2019 & 2032
- Table 56: South Korea Marine Simulators Market Volume (Billion) Forecast, by Application 2019 & 2032
- Table 57: Rest of Asia Pacific Marine Simulators Market Revenue (Million) Forecast, by Application 2019 & 2032
- Table 58: Rest of Asia Pacific Marine Simulators Market Volume (Billion) Forecast, by Application 2019 & 2032
- Table 59: Global Marine Simulators Market Revenue Million Forecast, by Type 2019 & 2032
- Table 60: Global Marine Simulators Market Volume Billion Forecast, by Type 2019 & 2032
- Table 61: Global Marine Simulators Market Revenue Million Forecast, by Application 2019 & 2032
- Table 62: Global Marine Simulators Market Volume Billion Forecast, by Application 2019 & 2032
- Table 63: Global Marine Simulators Market Revenue Million Forecast, by End Use 2019 & 2032
- Table 64: Global Marine Simulators Market Volume Billion Forecast, by End Use 2019 & 2032
- Table 65: Global Marine Simulators Market Revenue Million Forecast, by Country 2019 & 2032
- Table 66: Global Marine Simulators Market Volume Billion Forecast, by Country 2019 & 2032
- Table 67: Brazil Marine Simulators Market Revenue (Million) Forecast, by Application 2019 & 2032
- Table 68: Brazil Marine Simulators Market Volume (Billion) Forecast, by Application 2019 & 2032
- Table 69: Rest of Latin America Marine Simulators Market Revenue (Million) Forecast, by Application 2019 & 2032
- Table 70: Rest of Latin America Marine Simulators Market Volume (Billion) Forecast, by Application 2019 & 2032
- Table 71: Global Marine Simulators Market Revenue Million Forecast, by Type 2019 & 2032
- Table 72: Global Marine Simulators Market Volume Billion Forecast, by Type 2019 & 2032
- Table 73: Global Marine Simulators Market Revenue Million Forecast, by Application 2019 & 2032
- Table 74: Global Marine Simulators Market Volume Billion Forecast, by Application 2019 & 2032
- Table 75: Global Marine Simulators Market Revenue Million Forecast, by End Use 2019 & 2032
- Table 76: Global Marine Simulators Market Volume Billion Forecast, by End Use 2019 & 2032
- Table 77: Global Marine Simulators Market Revenue Million Forecast, by Country 2019 & 2032
- Table 78: Global Marine Simulators Market Volume Billion Forecast, by Country 2019 & 2032
- Table 79: United Arab Emirates Marine Simulators Market Revenue (Million) Forecast, by Application 2019 & 2032
- Table 80: United Arab Emirates Marine Simulators Market Volume (Billion) Forecast, by Application 2019 & 2032
- Table 81: Saudi Arabia Marine Simulators Market Revenue (Million) Forecast, by Application 2019 & 2032
- Table 82: Saudi Arabia Marine Simulators Market Volume (Billion) Forecast, by Application 2019 & 2032
- Table 83: Israel Marine Simulators Market Revenue (Million) Forecast, by Application 2019 & 2032
- Table 84: Israel Marine Simulators Market Volume (Billion) Forecast, by Application 2019 & 2032
- Table 85: Rest of Middle East and Africa Marine Simulators Market Revenue (Million) Forecast, by Application 2019 & 2032
- Table 86: Rest of Middle East and Africa Marine Simulators Market Volume (Billion) Forecast, by Application 2019 & 2032
Frequently Asked Questions
1. What is the projected Compound Annual Growth Rate (CAGR) of the Marine Simulators Market?
The projected CAGR is approximately 7.17%.
2. Which companies are prominent players in the Marine Simulators Market?
Key companies in the market include Wärtsila Corporation, Unitest Marine Simulators, VSTEP BV, Kongsberg Gruppen ASA, BMT Group Ltd, Virtual Marine Inc, FORCE Technology, NAUDEQ, Altair Engineering Inc, Global Dynamic Systems, Pivot Maritime Internationa.
3. What are the main segments of the Marine Simulators Market?
The market segments include Type, Application, End Use.
4. Can you provide details about the market size?
The market size is estimated to be USD 5.12 Million as of 2022.
5. What are some drivers contributing to market growth?
N/A
6. What are the notable trends driving market growth?
The Military Segment is Expected to Showcase Significant Growth During the Forecast Period.
7. Are there any restraints impacting market growth?
N/A
8. Can you provide examples of recent developments in the market?
January 2024: FORCE Technology was chosen to implement its SimFlex4 AR solution in a comprehensive upgrade for Smartship Australia, a Queensland maritime simulation and training facility.
9. What pricing options are available for accessing the report?
Pricing options include single-user, multi-user, and enterprise licenses priced at USD 4750, USD 5250, and USD 8750 respectively.
10. Is the market size provided in terms of value or volume?
The market size is provided in terms of value, measured in Million and volume, measured in Billion.
11. Are there any specific market keywords associated with the report?
Yes, the market keyword associated with the report is "Marine Simulators Market," which aids in identifying and referencing the specific market segment covered.
12. How do I determine which pricing option suits my needs best?
The pricing options vary based on user requirements and access needs. Individual users may opt for single-user licenses, while businesses requiring broader access may choose multi-user or enterprise licenses for cost-effective access to the report.
13. Are there any additional resources or data provided in the Marine Simulators Market report?
While the report offers comprehensive insights, it's advisable to review the specific contents or supplementary materials provided to ascertain if additional resources or data are available.
14. How can I stay updated on further developments or reports in the Marine Simulators Market?
To stay informed about further developments, trends, and reports in the Marine Simulators Market, consider subscribing to industry newsletters, following relevant companies and organizations, or regularly checking reputable industry news sources and publications.
Methodology
Step 1 - Identification of Relevant Samples Size from Population Database


Step 2 - Approaches for Defining Global Market Size (Value, Volume* & Price*)

Note*: In applicable scenarios
Step 3 - Data Sources
Primary Research
- Web Analytics
- Survey Reports
- Research Institute
- Latest Research Reports
- Opinion Leaders
Secondary Research
- Annual Reports
- White Paper
- Latest Press Release
- Industry Association
- Paid Database
- Investor Presentations

Step 4 - Data Triangulation
Involves using different sources of information in order to increase the validity of a study
These sources are likely to be stakeholders in a program - participants, other researchers, program staff, other community members, and so on.
Then we put all data in single framework & apply various statistical tools to find out the dynamic on the market.
During the analysis stage, feedback from the stakeholder groups would be compared to determine areas of agreement as well as areas of divergence


