
Key Insights
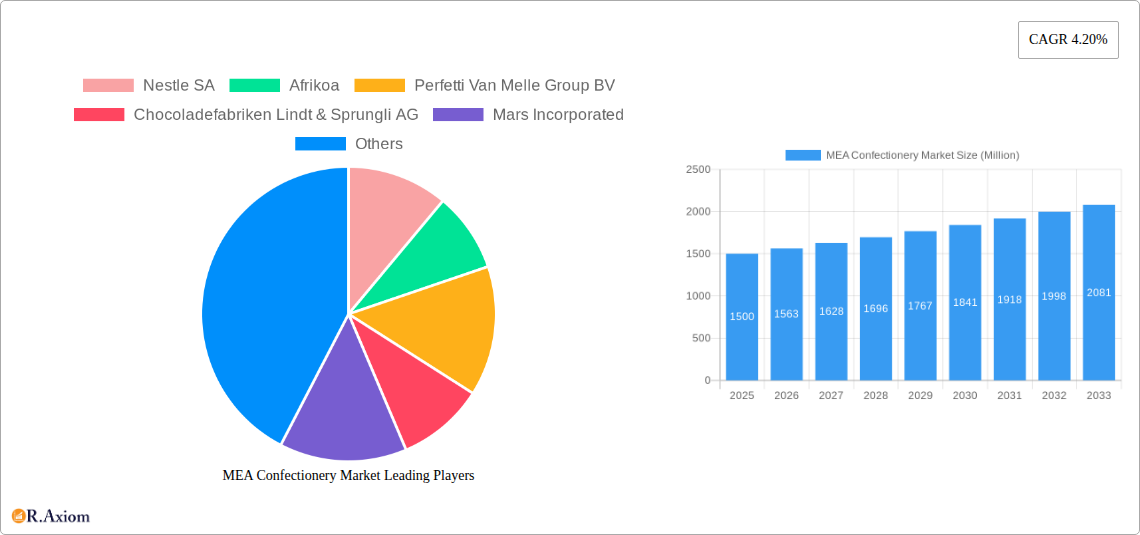
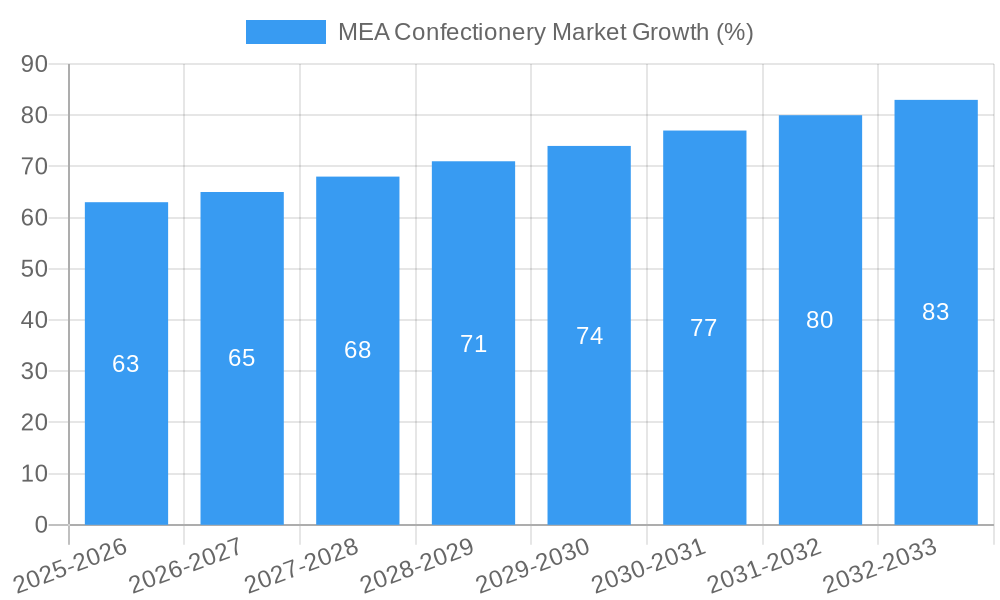
The Middle East and Africa (MEA) confectionery market, valued at approximately $XX million in 2025, is projected to experience robust growth, driven by several key factors. Rising disposable incomes, particularly within the burgeoning middle class across the region, are fueling increased spending on discretionary items like confectionery. A young and growing population, with a significant portion of consumers in the key age demographics for chocolate and confectionery consumption (15-35 years), contributes significantly to demand. Furthermore, the increasing urbanization in MEA is leading to the expansion of modern retail channels like supermarkets and hypermarkets, offering wider access to diverse confectionery products. The prevalence of online retail is also boosting sales, providing convenience and a wider range of choices. However, factors like fluctuating sugar prices and increased health consciousness are presenting challenges to market growth. Competition among major players like Nestlé, Mars, and Mondelez continues to be intense, driving innovation in product offerings and marketing strategies to capture market share. The market is segmented based on product type (chocolate, gums, sugar confectionery, snack bars), distribution channel (supermarkets, convenience stores, online), and country-specific variations in consumer preferences. The projected CAGR of 4.20% suggests a steady and significant expansion of the market through 2033.
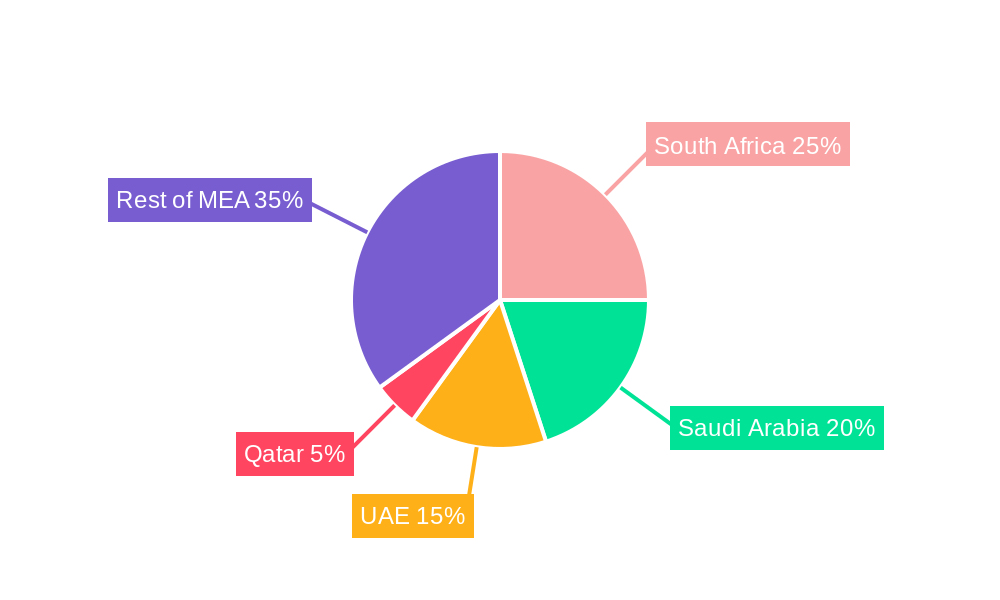
The growth in specific segments like chocolate and snack bars is expected to outpace the overall market growth, reflecting changing consumer preferences toward convenient and indulgent treats. The South Africa, Saudi Arabia, and the UAE markets are expected to remain dominant within the MEA region due to their relatively higher per capita income and developed retail infrastructure. However, countries with rapidly expanding populations and rising middle classes within the "Rest of MEA" segment also present significant growth opportunities. Manufacturers are actively focusing on product diversification, including healthier options like sugar-reduced and organic confectionery, to cater to the evolving demands of a more health-conscious consumer base. This trend, along with strategic partnerships and acquisitions, will define the competitive landscape in the coming years.
MEA Confectionery Market: A Comprehensive Market Report (2019-2033)
This comprehensive report provides an in-depth analysis of the Middle East and Africa (MEA) confectionery market, covering the period from 2019 to 2033. The study offers valuable insights into market dynamics, growth drivers, challenges, and opportunities, equipping stakeholders with actionable intelligence for strategic decision-making. The report leverages a robust methodology combining secondary research with primary inputs from industry experts, ensuring high accuracy and reliability. The base year for this report is 2025, with estimated data for 2025 and a forecast period spanning 2025-2033. The historical period covered is 2019-2024.
MEA Confectionery Market Concentration & Innovation
The MEA confectionery market exhibits a moderately concentrated landscape, with key players like Nestle SA, Nestle SA, Afrikoa, Perfetti Van Melle Group BV, Chocoladefabriken Lindt & Sprungli AG, Mars Incorporated, Pladis Global, The Hershey Company, and Mondelez International holding significant market share. Market share data for 2024 indicates Nestle SA holds approximately xx% market share, followed by Mars Incorporated with xx%, and Mondelez International with xx%. The remaining share is distributed among other regional and international players.
Innovation in the MEA confectionery market is driven by factors such as evolving consumer preferences (e.g., demand for healthier options, unique flavors), technological advancements (e.g., improved packaging, automation in production), and stringent regulatory frameworks focusing on food safety and labeling. M&A activities have been moderate, with several smaller acquisitions focused on expanding product portfolios and market reach. The total value of M&A deals in the MEA confectionery market during the historical period (2019-2024) is estimated to be around xx Million.
MEA Confectionery Market Industry Trends & Insights
The MEA confectionery market is projected to experience a Compound Annual Growth Rate (CAGR) of xx% during the forecast period (2025-2033), driven by factors such as rising disposable incomes, increasing urbanization, and changing lifestyle patterns. Technological disruptions, such as the adoption of advanced manufacturing technologies and e-commerce platforms, are further contributing to market growth. Consumer preferences are shifting towards healthier options, with a growing demand for sugar-free and organic confectionery products. The market penetration of online retail channels is increasing steadily, presenting both opportunities and challenges for established players. Intense competition, especially amongst multinational corporations, is shaping market dynamics, prompting continuous innovation and strategic partnerships. Market penetration of premium chocolate segments is estimated to be xx% in 2025, expected to reach xx% by 2033.
Dominant Markets & Segments in MEA Confectionery Market
By Product Type: Chocolates dominate the MEA confectionery market, accounting for approximately xx% of the total market value in 2025. This segment's dominance is fueled by strong consumer preference, product diversification, and continuous innovation in flavor profiles and product formats.
By Country: Saudi Arabia and the United Arab Emirates represent the largest national markets within the MEA region, driven by high per capita consumption and strong economic growth. South Africa also holds significant market share due to its relatively large population and established confectionery industry. Key drivers in these countries include robust infrastructure, favorable economic policies, and a significant young population.
By Distribution Channel: Supermarkets/Hypermarkets remain the primary distribution channel, though the online retail segment is expanding rapidly, demonstrating a significant CAGR of xx% during the forecast period. Convenience stores play a crucial role in impulse purchases, contributing substantially to overall sales.
By Segment: Within the chocolate segment, premium chocolate commands the highest average selling price, reflecting increasing consumer willingness to spend on high-quality confectionery. The gums and sugar confectionery segments represent sizable markets, with significant potential for growth through product diversification and strategic marketing campaigns.
MEA Confectionery Market Product Developments
Recent product innovations have focused on healthier options, including reduced sugar content, use of natural ingredients, and the introduction of functional confectionery products with added nutritional benefits. The market is seeing an increase in the availability of vegan, organic, and gluten-free confectionery products catering to specific dietary needs. These developments reflect a growing awareness of health and wellness among consumers and represent a significant competitive advantage for companies that are successfully adapting to these changing trends.
Report Scope & Segmentation Analysis
This report segments the MEA confectionery market by product type (Chocolates, Other Chocolates: Gums, Sugar Confectionery, Other Sugar Confectioneries: Snack Bars), distribution channel (Supermarkets/Hypermarkets, Convenience Stores, Online Retail Stores, Other Distribution Channels), and country (South Africa, Saudi Arabia, United Arab Emirates, Qatar, Rest of Middle East & Africa). Each segment's growth projections, market sizes, and competitive dynamics are meticulously analyzed, offering a holistic view of the market landscape. For instance, the chocolate segment is projected to grow at a CAGR of xx% during the forecast period, while the online retail channel is expected to exhibit significantly higher growth than traditional channels.
Key Drivers of MEA Confectionery Market Growth
Several factors are driving the growth of the MEA confectionery market. These include rising disposable incomes, particularly among the burgeoning middle class, leading to increased spending on discretionary items like confectionery. Urbanization is also a major factor, with an increase in population density in urban centers resulting in higher consumer density and increased accessibility to confectionery products. Finally, changing lifestyle patterns, including increased social events and celebrations, further boost demand for confectionery items.
Challenges in the MEA Confectionery Market Sector
The MEA confectionery market faces challenges including fluctuating raw material prices, affecting production costs and profitability. Stringent regulatory frameworks concerning food safety and labeling impose compliance costs on businesses. Furthermore, intense competition among established players and the emergence of new entrants create pressure on pricing and market share. Supply chain disruptions, particularly during periods of geopolitical instability or pandemics, can impact product availability and cause price volatility.
Emerging Opportunities in MEA Confectionery Market
Several emerging opportunities exist within the MEA confectionery market. The growing demand for healthier options presents a significant opportunity for companies to introduce innovative products with reduced sugar and fat content, or with added nutritional benefits. Expansion into new markets within the MEA region, particularly in rapidly growing economies, holds substantial potential for growth. Finally, e-commerce presents a significant opportunity to broaden distribution networks and reach a wider consumer base.
Leading Players in the MEA Confectionery Market Market
- Nestle SA
- Afrikoa
- Perfetti Van Melle Group BV
- Chocoladefabriken Lindt & Sprungli AG
- Mars Incorporated
- Pladis Global
- The Hershey Company
- Mondelez International
Key Developments in MEA Confectionery Market Industry
- 2022 Q4: Mondelez International launched a new line of sugar-free chocolates in the UAE market.
- 2023 Q1: Nestle SA invested in a new confectionery production facility in South Africa.
- 2023 Q2: Mars Incorporated acquired a local confectionery brand in Saudi Arabia.
- 2024 Q3: Perfetti Van Melle Group BV partnered with an online retailer to expand its distribution network in the MEA region.
Strategic Outlook for MEA Confectionery Market Market
The MEA confectionery market is poised for substantial growth over the next decade. Continued economic development, urbanization, and evolving consumer preferences will fuel this growth, providing lucrative opportunities for companies to expand their market share and introduce innovative products. Companies that successfully adapt to changing consumer demands, invest in sustainable sourcing practices, and leverage technology effectively will be best positioned to capitalize on future market potential.
MEA Confectionery Market Segmentation
-
1. Product Type
-
1.1. Chocolates
- 1.1.1. Softlines/Selflines
- 1.1.2. Boxed Assortments
- 1.1.3. Countlines
- 1.1.4. Molded Chocolate
- 1.1.5. Other Chocolates
- 1.2. Gums
-
1.3. Sugar Confectionery
- 1.3.1. Mints
- 1.3.2. Pastilles, Jellies, and Chews
- 1.3.3. Toffees, Caramels, and Nougat
- 1.3.4. Other Sugar Confectioneries
-
1.4. Snack Bars
- 1.4.1. Cereal Bars
- 1.4.2. Energy Bars
-
1.1. Chocolates
-
2. Distribution Channel
- 2.1. Supermarkets/Hypermarkets
- 2.2. Convenience Stores
- 2.3. Online Retail Stores
- 2.4. Other Distribution Channels
MEA Confectionery Market Segmentation By Geography
-
1. North America
- 1.1. United States
- 1.2. Canada
- 1.3. Mexico
-
2. South America
- 2.1. Brazil
- 2.2. Argentina
- 2.3. Rest of South America
-
3. Europe
- 3.1. United Kingdom
- 3.2. Germany
- 3.3. France
- 3.4. Italy
- 3.5. Spain
- 3.6. Russia
- 3.7. Benelux
- 3.8. Nordics
- 3.9. Rest of Europe
-
4. Middle East & Africa
- 4.1. Turkey
- 4.2. Israel
- 4.3. GCC
- 4.4. North Africa
- 4.5. South Africa
- 4.6. Rest of Middle East & Africa
-
5. Asia Pacific
- 5.1. China
- 5.2. India
- 5.3. Japan
- 5.4. South Korea
- 5.5. ASEAN
- 5.6. Oceania
- 5.7. Rest of Asia Pacific
MEA Confectionery Market REPORT HIGHLIGHTS
| Aspects | Details |
|---|---|
| Study Period | 2019-2033 |
| Base Year | 2024 |
| Estimated Year | 2025 |
| Forecast Period | 2025-2033 |
| Historical Period | 2019-2024 |
| Growth Rate | CAGR of 4.20% from 2019-2033 |
| Segmentation |
|
Table of Contents
- 1. Introduction
- 1.1. Research Scope
- 1.2. Market Segmentation
- 1.3. Research Methodology
- 1.4. Definitions and Assumptions
- 2. Executive Summary
- 2.1. Introduction
- 3. Market Dynamics
- 3.1. Introduction
- 3.2. Market Drivers
- 3.2.1. Increasing Sports Participation; Increasing Awareness about Health and Fitness
- 3.3. Market Restrains
- 3.3.1. Adverse Effects of Overconsumption of Products
- 3.4. Market Trends
- 3.4.1. INCREASING DEMAND FOR PREMIUM AND ARTISAN CHOCOLATES
- 4. Market Factor Analysis
- 4.1. Porters Five Forces
- 4.2. Supply/Value Chain
- 4.3. PESTEL analysis
- 4.4. Market Entropy
- 4.5. Patent/Trademark Analysis
- 5. Global MEA Confectionery Market Analysis, Insights and Forecast, 2019-2031
- 5.1. Market Analysis, Insights and Forecast - by Product Type
- 5.1.1. Chocolates
- 5.1.1.1. Softlines/Selflines
- 5.1.1.2. Boxed Assortments
- 5.1.1.3. Countlines
- 5.1.1.4. Molded Chocolate
- 5.1.1.5. Other Chocolates
- 5.1.2. Gums
- 5.1.3. Sugar Confectionery
- 5.1.3.1. Mints
- 5.1.3.2. Pastilles, Jellies, and Chews
- 5.1.3.3. Toffees, Caramels, and Nougat
- 5.1.3.4. Other Sugar Confectioneries
- 5.1.4. Snack Bars
- 5.1.4.1. Cereal Bars
- 5.1.4.2. Energy Bars
- 5.1.1. Chocolates
- 5.2. Market Analysis, Insights and Forecast - by Distribution Channel
- 5.2.1. Supermarkets/Hypermarkets
- 5.2.2. Convenience Stores
- 5.2.3. Online Retail Stores
- 5.2.4. Other Distribution Channels
- 5.3. Market Analysis, Insights and Forecast - by Region
- 5.3.1. North America
- 5.3.2. South America
- 5.3.3. Europe
- 5.3.4. Middle East & Africa
- 5.3.5. Asia Pacific
- 5.1. Market Analysis, Insights and Forecast - by Product Type
- 6. North America MEA Confectionery Market Analysis, Insights and Forecast, 2019-2031
- 6.1. Market Analysis, Insights and Forecast - by Product Type
- 6.1.1. Chocolates
- 6.1.1.1. Softlines/Selflines
- 6.1.1.2. Boxed Assortments
- 6.1.1.3. Countlines
- 6.1.1.4. Molded Chocolate
- 6.1.1.5. Other Chocolates
- 6.1.2. Gums
- 6.1.3. Sugar Confectionery
- 6.1.3.1. Mints
- 6.1.3.2. Pastilles, Jellies, and Chews
- 6.1.3.3. Toffees, Caramels, and Nougat
- 6.1.3.4. Other Sugar Confectioneries
- 6.1.4. Snack Bars
- 6.1.4.1. Cereal Bars
- 6.1.4.2. Energy Bars
- 6.1.1. Chocolates
- 6.2. Market Analysis, Insights and Forecast - by Distribution Channel
- 6.2.1. Supermarkets/Hypermarkets
- 6.2.2. Convenience Stores
- 6.2.3. Online Retail Stores
- 6.2.4. Other Distribution Channels
- 6.1. Market Analysis, Insights and Forecast - by Product Type
- 7. South America MEA Confectionery Market Analysis, Insights and Forecast, 2019-2031
- 7.1. Market Analysis, Insights and Forecast - by Product Type
- 7.1.1. Chocolates
- 7.1.1.1. Softlines/Selflines
- 7.1.1.2. Boxed Assortments
- 7.1.1.3. Countlines
- 7.1.1.4. Molded Chocolate
- 7.1.1.5. Other Chocolates
- 7.1.2. Gums
- 7.1.3. Sugar Confectionery
- 7.1.3.1. Mints
- 7.1.3.2. Pastilles, Jellies, and Chews
- 7.1.3.3. Toffees, Caramels, and Nougat
- 7.1.3.4. Other Sugar Confectioneries
- 7.1.4. Snack Bars
- 7.1.4.1. Cereal Bars
- 7.1.4.2. Energy Bars
- 7.1.1. Chocolates
- 7.2. Market Analysis, Insights and Forecast - by Distribution Channel
- 7.2.1. Supermarkets/Hypermarkets
- 7.2.2. Convenience Stores
- 7.2.3. Online Retail Stores
- 7.2.4. Other Distribution Channels
- 7.1. Market Analysis, Insights and Forecast - by Product Type
- 8. Europe MEA Confectionery Market Analysis, Insights and Forecast, 2019-2031
- 8.1. Market Analysis, Insights and Forecast - by Product Type
- 8.1.1. Chocolates
- 8.1.1.1. Softlines/Selflines
- 8.1.1.2. Boxed Assortments
- 8.1.1.3. Countlines
- 8.1.1.4. Molded Chocolate
- 8.1.1.5. Other Chocolates
- 8.1.2. Gums
- 8.1.3. Sugar Confectionery
- 8.1.3.1. Mints
- 8.1.3.2. Pastilles, Jellies, and Chews
- 8.1.3.3. Toffees, Caramels, and Nougat
- 8.1.3.4. Other Sugar Confectioneries
- 8.1.4. Snack Bars
- 8.1.4.1. Cereal Bars
- 8.1.4.2. Energy Bars
- 8.1.1. Chocolates
- 8.2. Market Analysis, Insights and Forecast - by Distribution Channel
- 8.2.1. Supermarkets/Hypermarkets
- 8.2.2. Convenience Stores
- 8.2.3. Online Retail Stores
- 8.2.4. Other Distribution Channels
- 8.1. Market Analysis, Insights and Forecast - by Product Type
- 9. Middle East & Africa MEA Confectionery Market Analysis, Insights and Forecast, 2019-2031
- 9.1. Market Analysis, Insights and Forecast - by Product Type
- 9.1.1. Chocolates
- 9.1.1.1. Softlines/Selflines
- 9.1.1.2. Boxed Assortments
- 9.1.1.3. Countlines
- 9.1.1.4. Molded Chocolate
- 9.1.1.5. Other Chocolates
- 9.1.2. Gums
- 9.1.3. Sugar Confectionery
- 9.1.3.1. Mints
- 9.1.3.2. Pastilles, Jellies, and Chews
- 9.1.3.3. Toffees, Caramels, and Nougat
- 9.1.3.4. Other Sugar Confectioneries
- 9.1.4. Snack Bars
- 9.1.4.1. Cereal Bars
- 9.1.4.2. Energy Bars
- 9.1.1. Chocolates
- 9.2. Market Analysis, Insights and Forecast - by Distribution Channel
- 9.2.1. Supermarkets/Hypermarkets
- 9.2.2. Convenience Stores
- 9.2.3. Online Retail Stores
- 9.2.4. Other Distribution Channels
- 9.1. Market Analysis, Insights and Forecast - by Product Type
- 10. Asia Pacific MEA Confectionery Market Analysis, Insights and Forecast, 2019-2031
- 10.1. Market Analysis, Insights and Forecast - by Product Type
- 10.1.1. Chocolates
- 10.1.1.1. Softlines/Selflines
- 10.1.1.2. Boxed Assortments
- 10.1.1.3. Countlines
- 10.1.1.4. Molded Chocolate
- 10.1.1.5. Other Chocolates
- 10.1.2. Gums
- 10.1.3. Sugar Confectionery
- 10.1.3.1. Mints
- 10.1.3.2. Pastilles, Jellies, and Chews
- 10.1.3.3. Toffees, Caramels, and Nougat
- 10.1.3.4. Other Sugar Confectioneries
- 10.1.4. Snack Bars
- 10.1.4.1. Cereal Bars
- 10.1.4.2. Energy Bars
- 10.1.1. Chocolates
- 10.2. Market Analysis, Insights and Forecast - by Distribution Channel
- 10.2.1. Supermarkets/Hypermarkets
- 10.2.2. Convenience Stores
- 10.2.3. Online Retail Stores
- 10.2.4. Other Distribution Channels
- 10.1. Market Analysis, Insights and Forecast - by Product Type
- 11. North America MEA Confectionery Market Analysis, Insights and Forecast, 2019-2031
- 11.1. Market Analysis, Insights and Forecast - By Country/Sub-region
- 11.1.1 United States
- 11.1.2 Canada
- 11.1.3 Mexico
- 12. Europe MEA Confectionery Market Analysis, Insights and Forecast, 2019-2031
- 12.1. Market Analysis, Insights and Forecast - By Country/Sub-region
- 12.1.1 Germany
- 12.1.2 United Kingdom
- 12.1.3 France
- 12.1.4 Spain
- 12.1.5 Italy
- 12.1.6 Spain
- 12.1.7 Belgium
- 12.1.8 Netherland
- 12.1.9 Nordics
- 12.1.10 Rest of Europe
- 13. Asia Pacific MEA Confectionery Market Analysis, Insights and Forecast, 2019-2031
- 13.1. Market Analysis, Insights and Forecast - By Country/Sub-region
- 13.1.1 China
- 13.1.2 Japan
- 13.1.3 India
- 13.1.4 South Korea
- 13.1.5 Southeast Asia
- 13.1.6 Australia
- 13.1.7 Indonesia
- 13.1.8 Phillipes
- 13.1.9 Singapore
- 13.1.10 Thailandc
- 13.1.11 Rest of Asia Pacific
- 14. South America MEA Confectionery Market Analysis, Insights and Forecast, 2019-2031
- 14.1. Market Analysis, Insights and Forecast - By Country/Sub-region
- 14.1.1 Brazil
- 14.1.2 Argentina
- 14.1.3 Peru
- 14.1.4 Chile
- 14.1.5 Colombia
- 14.1.6 Ecuador
- 14.1.7 Venezuela
- 14.1.8 Rest of South America
- 15. North America MEA Confectionery Market Analysis, Insights and Forecast, 2019-2031
- 15.1. Market Analysis, Insights and Forecast - By Country/Sub-region
- 15.1.1 United States
- 15.1.2 Canada
- 15.1.3 Mexico
- 16. MEA MEA Confectionery Market Analysis, Insights and Forecast, 2019-2031
- 16.1. Market Analysis, Insights and Forecast - By Country/Sub-region
- 16.1.1 United Arab Emirates
- 16.1.2 Saudi Arabia
- 16.1.3 South Africa
- 16.1.4 Rest of Middle East and Africa
- 17. Competitive Analysis
- 17.1. Global Market Share Analysis 2024
- 17.2. Company Profiles
- 17.2.1 Nestle SA
- 17.2.1.1. Overview
- 17.2.1.2. Products
- 17.2.1.3. SWOT Analysis
- 17.2.1.4. Recent Developments
- 17.2.1.5. Financials (Based on Availability)
- 17.2.2 Afrikoa
- 17.2.2.1. Overview
- 17.2.2.2. Products
- 17.2.2.3. SWOT Analysis
- 17.2.2.4. Recent Developments
- 17.2.2.5. Financials (Based on Availability)
- 17.2.3 Perfetti Van Melle Group BV
- 17.2.3.1. Overview
- 17.2.3.2. Products
- 17.2.3.3. SWOT Analysis
- 17.2.3.4. Recent Developments
- 17.2.3.5. Financials (Based on Availability)
- 17.2.4 Chocoladefabriken Lindt & Sprungli AG
- 17.2.4.1. Overview
- 17.2.4.2. Products
- 17.2.4.3. SWOT Analysis
- 17.2.4.4. Recent Developments
- 17.2.4.5. Financials (Based on Availability)
- 17.2.5 Mars Incorporated
- 17.2.5.1. Overview
- 17.2.5.2. Products
- 17.2.5.3. SWOT Analysis
- 17.2.5.4. Recent Developments
- 17.2.5.5. Financials (Based on Availability)
- 17.2.6 Pladis Global
- 17.2.6.1. Overview
- 17.2.6.2. Products
- 17.2.6.3. SWOT Analysis
- 17.2.6.4. Recent Developments
- 17.2.6.5. Financials (Based on Availability)
- 17.2.7 The Hershey Company
- 17.2.7.1. Overview
- 17.2.7.2. Products
- 17.2.7.3. SWOT Analysis
- 17.2.7.4. Recent Developments
- 17.2.7.5. Financials (Based on Availability)
- 17.2.8 Mondelez International
- 17.2.8.1. Overview
- 17.2.8.2. Products
- 17.2.8.3. SWOT Analysis
- 17.2.8.4. Recent Developments
- 17.2.8.5. Financials (Based on Availability)
- 17.2.1 Nestle SA
List of Figures
- Figure 1: Global MEA Confectionery Market Revenue Breakdown (Million, %) by Region 2024 & 2032
- Figure 2: North America MEA Confectionery Market Revenue (Million), by Country 2024 & 2032
- Figure 3: North America MEA Confectionery Market Revenue Share (%), by Country 2024 & 2032
- Figure 4: Europe MEA Confectionery Market Revenue (Million), by Country 2024 & 2032
- Figure 5: Europe MEA Confectionery Market Revenue Share (%), by Country 2024 & 2032
- Figure 6: Asia Pacific MEA Confectionery Market Revenue (Million), by Country 2024 & 2032
- Figure 7: Asia Pacific MEA Confectionery Market Revenue Share (%), by Country 2024 & 2032
- Figure 8: South America MEA Confectionery Market Revenue (Million), by Country 2024 & 2032
- Figure 9: South America MEA Confectionery Market Revenue Share (%), by Country 2024 & 2032
- Figure 10: North America MEA Confectionery Market Revenue (Million), by Country 2024 & 2032
- Figure 11: North America MEA Confectionery Market Revenue Share (%), by Country 2024 & 2032
- Figure 12: MEA MEA Confectionery Market Revenue (Million), by Country 2024 & 2032
- Figure 13: MEA MEA Confectionery Market Revenue Share (%), by Country 2024 & 2032
- Figure 14: North America MEA Confectionery Market Revenue (Million), by Product Type 2024 & 2032
- Figure 15: North America MEA Confectionery Market Revenue Share (%), by Product Type 2024 & 2032
- Figure 16: North America MEA Confectionery Market Revenue (Million), by Distribution Channel 2024 & 2032
- Figure 17: North America MEA Confectionery Market Revenue Share (%), by Distribution Channel 2024 & 2032
- Figure 18: North America MEA Confectionery Market Revenue (Million), by Country 2024 & 2032
- Figure 19: North America MEA Confectionery Market Revenue Share (%), by Country 2024 & 2032
- Figure 20: South America MEA Confectionery Market Revenue (Million), by Product Type 2024 & 2032
- Figure 21: South America MEA Confectionery Market Revenue Share (%), by Product Type 2024 & 2032
- Figure 22: South America MEA Confectionery Market Revenue (Million), by Distribution Channel 2024 & 2032
- Figure 23: South America MEA Confectionery Market Revenue Share (%), by Distribution Channel 2024 & 2032
- Figure 24: South America MEA Confectionery Market Revenue (Million), by Country 2024 & 2032
- Figure 25: South America MEA Confectionery Market Revenue Share (%), by Country 2024 & 2032
- Figure 26: Europe MEA Confectionery Market Revenue (Million), by Product Type 2024 & 2032
- Figure 27: Europe MEA Confectionery Market Revenue Share (%), by Product Type 2024 & 2032
- Figure 28: Europe MEA Confectionery Market Revenue (Million), by Distribution Channel 2024 & 2032
- Figure 29: Europe MEA Confectionery Market Revenue Share (%), by Distribution Channel 2024 & 2032
- Figure 30: Europe MEA Confectionery Market Revenue (Million), by Country 2024 & 2032
- Figure 31: Europe MEA Confectionery Market Revenue Share (%), by Country 2024 & 2032
- Figure 32: Middle East & Africa MEA Confectionery Market Revenue (Million), by Product Type 2024 & 2032
- Figure 33: Middle East & Africa MEA Confectionery Market Revenue Share (%), by Product Type 2024 & 2032
- Figure 34: Middle East & Africa MEA Confectionery Market Revenue (Million), by Distribution Channel 2024 & 2032
- Figure 35: Middle East & Africa MEA Confectionery Market Revenue Share (%), by Distribution Channel 2024 & 2032
- Figure 36: Middle East & Africa MEA Confectionery Market Revenue (Million), by Country 2024 & 2032
- Figure 37: Middle East & Africa MEA Confectionery Market Revenue Share (%), by Country 2024 & 2032
- Figure 38: Asia Pacific MEA Confectionery Market Revenue (Million), by Product Type 2024 & 2032
- Figure 39: Asia Pacific MEA Confectionery Market Revenue Share (%), by Product Type 2024 & 2032
- Figure 40: Asia Pacific MEA Confectionery Market Revenue (Million), by Distribution Channel 2024 & 2032
- Figure 41: Asia Pacific MEA Confectionery Market Revenue Share (%), by Distribution Channel 2024 & 2032
- Figure 42: Asia Pacific MEA Confectionery Market Revenue (Million), by Country 2024 & 2032
- Figure 43: Asia Pacific MEA Confectionery Market Revenue Share (%), by Country 2024 & 2032
List of Tables
- Table 1: Global MEA Confectionery Market Revenue Million Forecast, by Region 2019 & 2032
- Table 2: Global MEA Confectionery Market Revenue Million Forecast, by Product Type 2019 & 2032
- Table 3: Global MEA Confectionery Market Revenue Million Forecast, by Distribution Channel 2019 & 2032
- Table 4: Global MEA Confectionery Market Revenue Million Forecast, by Region 2019 & 2032
- Table 5: Global MEA Confectionery Market Revenue Million Forecast, by Country 2019 & 2032
- Table 6: United States MEA Confectionery Market Revenue (Million) Forecast, by Application 2019 & 2032
- Table 7: Canada MEA Confectionery Market Revenue (Million) Forecast, by Application 2019 & 2032
- Table 8: Mexico MEA Confectionery Market Revenue (Million) Forecast, by Application 2019 & 2032
- Table 9: Global MEA Confectionery Market Revenue Million Forecast, by Country 2019 & 2032
- Table 10: Germany MEA Confectionery Market Revenue (Million) Forecast, by Application 2019 & 2032
- Table 11: United Kingdom MEA Confectionery Market Revenue (Million) Forecast, by Application 2019 & 2032
- Table 12: France MEA Confectionery Market Revenue (Million) Forecast, by Application 2019 & 2032
- Table 13: Spain MEA Confectionery Market Revenue (Million) Forecast, by Application 2019 & 2032
- Table 14: Italy MEA Confectionery Market Revenue (Million) Forecast, by Application 2019 & 2032
- Table 15: Spain MEA Confectionery Market Revenue (Million) Forecast, by Application 2019 & 2032
- Table 16: Belgium MEA Confectionery Market Revenue (Million) Forecast, by Application 2019 & 2032
- Table 17: Netherland MEA Confectionery Market Revenue (Million) Forecast, by Application 2019 & 2032
- Table 18: Nordics MEA Confectionery Market Revenue (Million) Forecast, by Application 2019 & 2032
- Table 19: Rest of Europe MEA Confectionery Market Revenue (Million) Forecast, by Application 2019 & 2032
- Table 20: Global MEA Confectionery Market Revenue Million Forecast, by Country 2019 & 2032
- Table 21: China MEA Confectionery Market Revenue (Million) Forecast, by Application 2019 & 2032
- Table 22: Japan MEA Confectionery Market Revenue (Million) Forecast, by Application 2019 & 2032
- Table 23: India MEA Confectionery Market Revenue (Million) Forecast, by Application 2019 & 2032
- Table 24: South Korea MEA Confectionery Market Revenue (Million) Forecast, by Application 2019 & 2032
- Table 25: Southeast Asia MEA Confectionery Market Revenue (Million) Forecast, by Application 2019 & 2032
- Table 26: Australia MEA Confectionery Market Revenue (Million) Forecast, by Application 2019 & 2032
- Table 27: Indonesia MEA Confectionery Market Revenue (Million) Forecast, by Application 2019 & 2032
- Table 28: Phillipes MEA Confectionery Market Revenue (Million) Forecast, by Application 2019 & 2032
- Table 29: Singapore MEA Confectionery Market Revenue (Million) Forecast, by Application 2019 & 2032
- Table 30: Thailandc MEA Confectionery Market Revenue (Million) Forecast, by Application 2019 & 2032
- Table 31: Rest of Asia Pacific MEA Confectionery Market Revenue (Million) Forecast, by Application 2019 & 2032
- Table 32: Global MEA Confectionery Market Revenue Million Forecast, by Country 2019 & 2032
- Table 33: Brazil MEA Confectionery Market Revenue (Million) Forecast, by Application 2019 & 2032
- Table 34: Argentina MEA Confectionery Market Revenue (Million) Forecast, by Application 2019 & 2032
- Table 35: Peru MEA Confectionery Market Revenue (Million) Forecast, by Application 2019 & 2032
- Table 36: Chile MEA Confectionery Market Revenue (Million) Forecast, by Application 2019 & 2032
- Table 37: Colombia MEA Confectionery Market Revenue (Million) Forecast, by Application 2019 & 2032
- Table 38: Ecuador MEA Confectionery Market Revenue (Million) Forecast, by Application 2019 & 2032
- Table 39: Venezuela MEA Confectionery Market Revenue (Million) Forecast, by Application 2019 & 2032
- Table 40: Rest of South America MEA Confectionery Market Revenue (Million) Forecast, by Application 2019 & 2032
- Table 41: Global MEA Confectionery Market Revenue Million Forecast, by Country 2019 & 2032
- Table 42: United States MEA Confectionery Market Revenue (Million) Forecast, by Application 2019 & 2032
- Table 43: Canada MEA Confectionery Market Revenue (Million) Forecast, by Application 2019 & 2032
- Table 44: Mexico MEA Confectionery Market Revenue (Million) Forecast, by Application 2019 & 2032
- Table 45: Global MEA Confectionery Market Revenue Million Forecast, by Country 2019 & 2032
- Table 46: United Arab Emirates MEA Confectionery Market Revenue (Million) Forecast, by Application 2019 & 2032
- Table 47: Saudi Arabia MEA Confectionery Market Revenue (Million) Forecast, by Application 2019 & 2032
- Table 48: South Africa MEA Confectionery Market Revenue (Million) Forecast, by Application 2019 & 2032
- Table 49: Rest of Middle East and Africa MEA Confectionery Market Revenue (Million) Forecast, by Application 2019 & 2032
- Table 50: Global MEA Confectionery Market Revenue Million Forecast, by Product Type 2019 & 2032
- Table 51: Global MEA Confectionery Market Revenue Million Forecast, by Distribution Channel 2019 & 2032
- Table 52: Global MEA Confectionery Market Revenue Million Forecast, by Country 2019 & 2032
- Table 53: United States MEA Confectionery Market Revenue (Million) Forecast, by Application 2019 & 2032
- Table 54: Canada MEA Confectionery Market Revenue (Million) Forecast, by Application 2019 & 2032
- Table 55: Mexico MEA Confectionery Market Revenue (Million) Forecast, by Application 2019 & 2032
- Table 56: Global MEA Confectionery Market Revenue Million Forecast, by Product Type 2019 & 2032
- Table 57: Global MEA Confectionery Market Revenue Million Forecast, by Distribution Channel 2019 & 2032
- Table 58: Global MEA Confectionery Market Revenue Million Forecast, by Country 2019 & 2032
- Table 59: Brazil MEA Confectionery Market Revenue (Million) Forecast, by Application 2019 & 2032
- Table 60: Argentina MEA Confectionery Market Revenue (Million) Forecast, by Application 2019 & 2032
- Table 61: Rest of South America MEA Confectionery Market Revenue (Million) Forecast, by Application 2019 & 2032
- Table 62: Global MEA Confectionery Market Revenue Million Forecast, by Product Type 2019 & 2032
- Table 63: Global MEA Confectionery Market Revenue Million Forecast, by Distribution Channel 2019 & 2032
- Table 64: Global MEA Confectionery Market Revenue Million Forecast, by Country 2019 & 2032
- Table 65: United Kingdom MEA Confectionery Market Revenue (Million) Forecast, by Application 2019 & 2032
- Table 66: Germany MEA Confectionery Market Revenue (Million) Forecast, by Application 2019 & 2032
- Table 67: France MEA Confectionery Market Revenue (Million) Forecast, by Application 2019 & 2032
- Table 68: Italy MEA Confectionery Market Revenue (Million) Forecast, by Application 2019 & 2032
- Table 69: Spain MEA Confectionery Market Revenue (Million) Forecast, by Application 2019 & 2032
- Table 70: Russia MEA Confectionery Market Revenue (Million) Forecast, by Application 2019 & 2032
- Table 71: Benelux MEA Confectionery Market Revenue (Million) Forecast, by Application 2019 & 2032
- Table 72: Nordics MEA Confectionery Market Revenue (Million) Forecast, by Application 2019 & 2032
- Table 73: Rest of Europe MEA Confectionery Market Revenue (Million) Forecast, by Application 2019 & 2032
- Table 74: Global MEA Confectionery Market Revenue Million Forecast, by Product Type 2019 & 2032
- Table 75: Global MEA Confectionery Market Revenue Million Forecast, by Distribution Channel 2019 & 2032
- Table 76: Global MEA Confectionery Market Revenue Million Forecast, by Country 2019 & 2032
- Table 77: Turkey MEA Confectionery Market Revenue (Million) Forecast, by Application 2019 & 2032
- Table 78: Israel MEA Confectionery Market Revenue (Million) Forecast, by Application 2019 & 2032
- Table 79: GCC MEA Confectionery Market Revenue (Million) Forecast, by Application 2019 & 2032
- Table 80: North Africa MEA Confectionery Market Revenue (Million) Forecast, by Application 2019 & 2032
- Table 81: South Africa MEA Confectionery Market Revenue (Million) Forecast, by Application 2019 & 2032
- Table 82: Rest of Middle East & Africa MEA Confectionery Market Revenue (Million) Forecast, by Application 2019 & 2032
- Table 83: Global MEA Confectionery Market Revenue Million Forecast, by Product Type 2019 & 2032
- Table 84: Global MEA Confectionery Market Revenue Million Forecast, by Distribution Channel 2019 & 2032
- Table 85: Global MEA Confectionery Market Revenue Million Forecast, by Country 2019 & 2032
- Table 86: China MEA Confectionery Market Revenue (Million) Forecast, by Application 2019 & 2032
- Table 87: India MEA Confectionery Market Revenue (Million) Forecast, by Application 2019 & 2032
- Table 88: Japan MEA Confectionery Market Revenue (Million) Forecast, by Application 2019 & 2032
- Table 89: South Korea MEA Confectionery Market Revenue (Million) Forecast, by Application 2019 & 2032
- Table 90: ASEAN MEA Confectionery Market Revenue (Million) Forecast, by Application 2019 & 2032
- Table 91: Oceania MEA Confectionery Market Revenue (Million) Forecast, by Application 2019 & 2032
- Table 92: Rest of Asia Pacific MEA Confectionery Market Revenue (Million) Forecast, by Application 2019 & 2032
Frequently Asked Questions
1. What is the projected Compound Annual Growth Rate (CAGR) of the MEA Confectionery Market?
The projected CAGR is approximately 4.20%.
2. Which companies are prominent players in the MEA Confectionery Market?
Key companies in the market include Nestle SA, Afrikoa, Perfetti Van Melle Group BV, Chocoladefabriken Lindt & Sprungli AG, Mars Incorporated, Pladis Global, The Hershey Company, Mondelez International.
3. What are the main segments of the MEA Confectionery Market?
The market segments include Product Type, Distribution Channel.
4. Can you provide details about the market size?
The market size is estimated to be USD XX Million as of 2022.
5. What are some drivers contributing to market growth?
Increasing Sports Participation; Increasing Awareness about Health and Fitness.
6. What are the notable trends driving market growth?
INCREASING DEMAND FOR PREMIUM AND ARTISAN CHOCOLATES.
7. Are there any restraints impacting market growth?
Adverse Effects of Overconsumption of Products.
8. Can you provide examples of recent developments in the market?
N/A
9. What pricing options are available for accessing the report?
Pricing options include single-user, multi-user, and enterprise licenses priced at USD 4750, USD 5250, and USD 8750 respectively.
10. Is the market size provided in terms of value or volume?
The market size is provided in terms of value, measured in Million.
11. Are there any specific market keywords associated with the report?
Yes, the market keyword associated with the report is "MEA Confectionery Market," which aids in identifying and referencing the specific market segment covered.
12. How do I determine which pricing option suits my needs best?
The pricing options vary based on user requirements and access needs. Individual users may opt for single-user licenses, while businesses requiring broader access may choose multi-user or enterprise licenses for cost-effective access to the report.
13. Are there any additional resources or data provided in the MEA Confectionery Market report?
While the report offers comprehensive insights, it's advisable to review the specific contents or supplementary materials provided to ascertain if additional resources or data are available.
14. How can I stay updated on further developments or reports in the MEA Confectionery Market?
To stay informed about further developments, trends, and reports in the MEA Confectionery Market, consider subscribing to industry newsletters, following relevant companies and organizations, or regularly checking reputable industry news sources and publications.
Methodology
Step 1 - Identification of Relevant Samples Size from Population Database


Step 2 - Approaches for Defining Global Market Size (Value, Volume* & Price*)

Note*: In applicable scenarios
Step 3 - Data Sources
Primary Research
- Web Analytics
- Survey Reports
- Research Institute
- Latest Research Reports
- Opinion Leaders
Secondary Research
- Annual Reports
- White Paper
- Latest Press Release
- Industry Association
- Paid Database
- Investor Presentations

Step 4 - Data Triangulation
Involves using different sources of information in order to increase the validity of a study
These sources are likely to be stakeholders in a program - participants, other researchers, program staff, other community members, and so on.
Then we put all data in single framework & apply various statistical tools to find out the dynamic on the market.
During the analysis stage, feedback from the stakeholder groups would be compared to determine areas of agreement as well as areas of divergence


