

Key Insights
The Middle East & Africa (MEA) Construction Adhesives market is poised for significant expansion, projected to reach $10.9 billion by 2024, with a compound annual growth rate (CAGR) of 5.1%. This growth is propelled by extensive infrastructure development across the region, particularly in the UAE and Saudi Arabia, driven by substantial government investment in housing, commercial properties, and large-scale projects. The increasing adoption of sustainable construction practices is also a key driver, boosting demand for eco-friendly adhesives, such as water-borne formulations. Challenges include economic volatility in select MEA nations and fluctuating raw material prices. The market is segmented by product type, with acrylics and epoxy resins dominating due to their versatility and cost-effectiveness. While the residential sector currently leads, commercial and infrastructure segments are expected to experience accelerated growth, fueled by rapid urbanization.
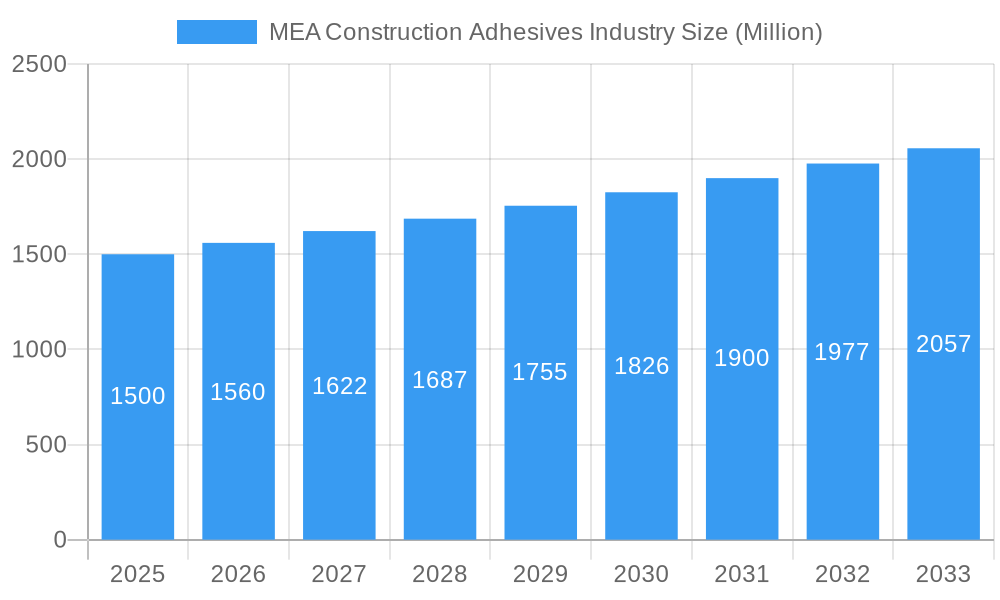
MEA Construction Adhesives Industry Market Size (In Billion)
Key market players, including global leaders and local distributors, are actively engaged in competitive strategies focusing on product innovation, performance enhancement, and cost optimization to cater to the diverse demands of the construction sector. Diversification of regional economies and ongoing infrastructure enhancement initiatives will continue to stimulate demand for construction adhesives. Furthermore, rising populations and increasing urbanization in major MEA cities will contribute significantly to market growth. Technological advancements in adhesive formulations, particularly in water-borne and reactive technologies, are expected to drive adoption. Addressing potential supply chain disruptions and ensuring consistent quality across varied climatic conditions and construction methods within the region are critical considerations. The market is anticipated to witness a rise in specialized adhesives tailored for specific climatic conditions and building materials, thereby improving overall performance and durability. This growth trajectory is likely to intensify competition and attract new market entrants.
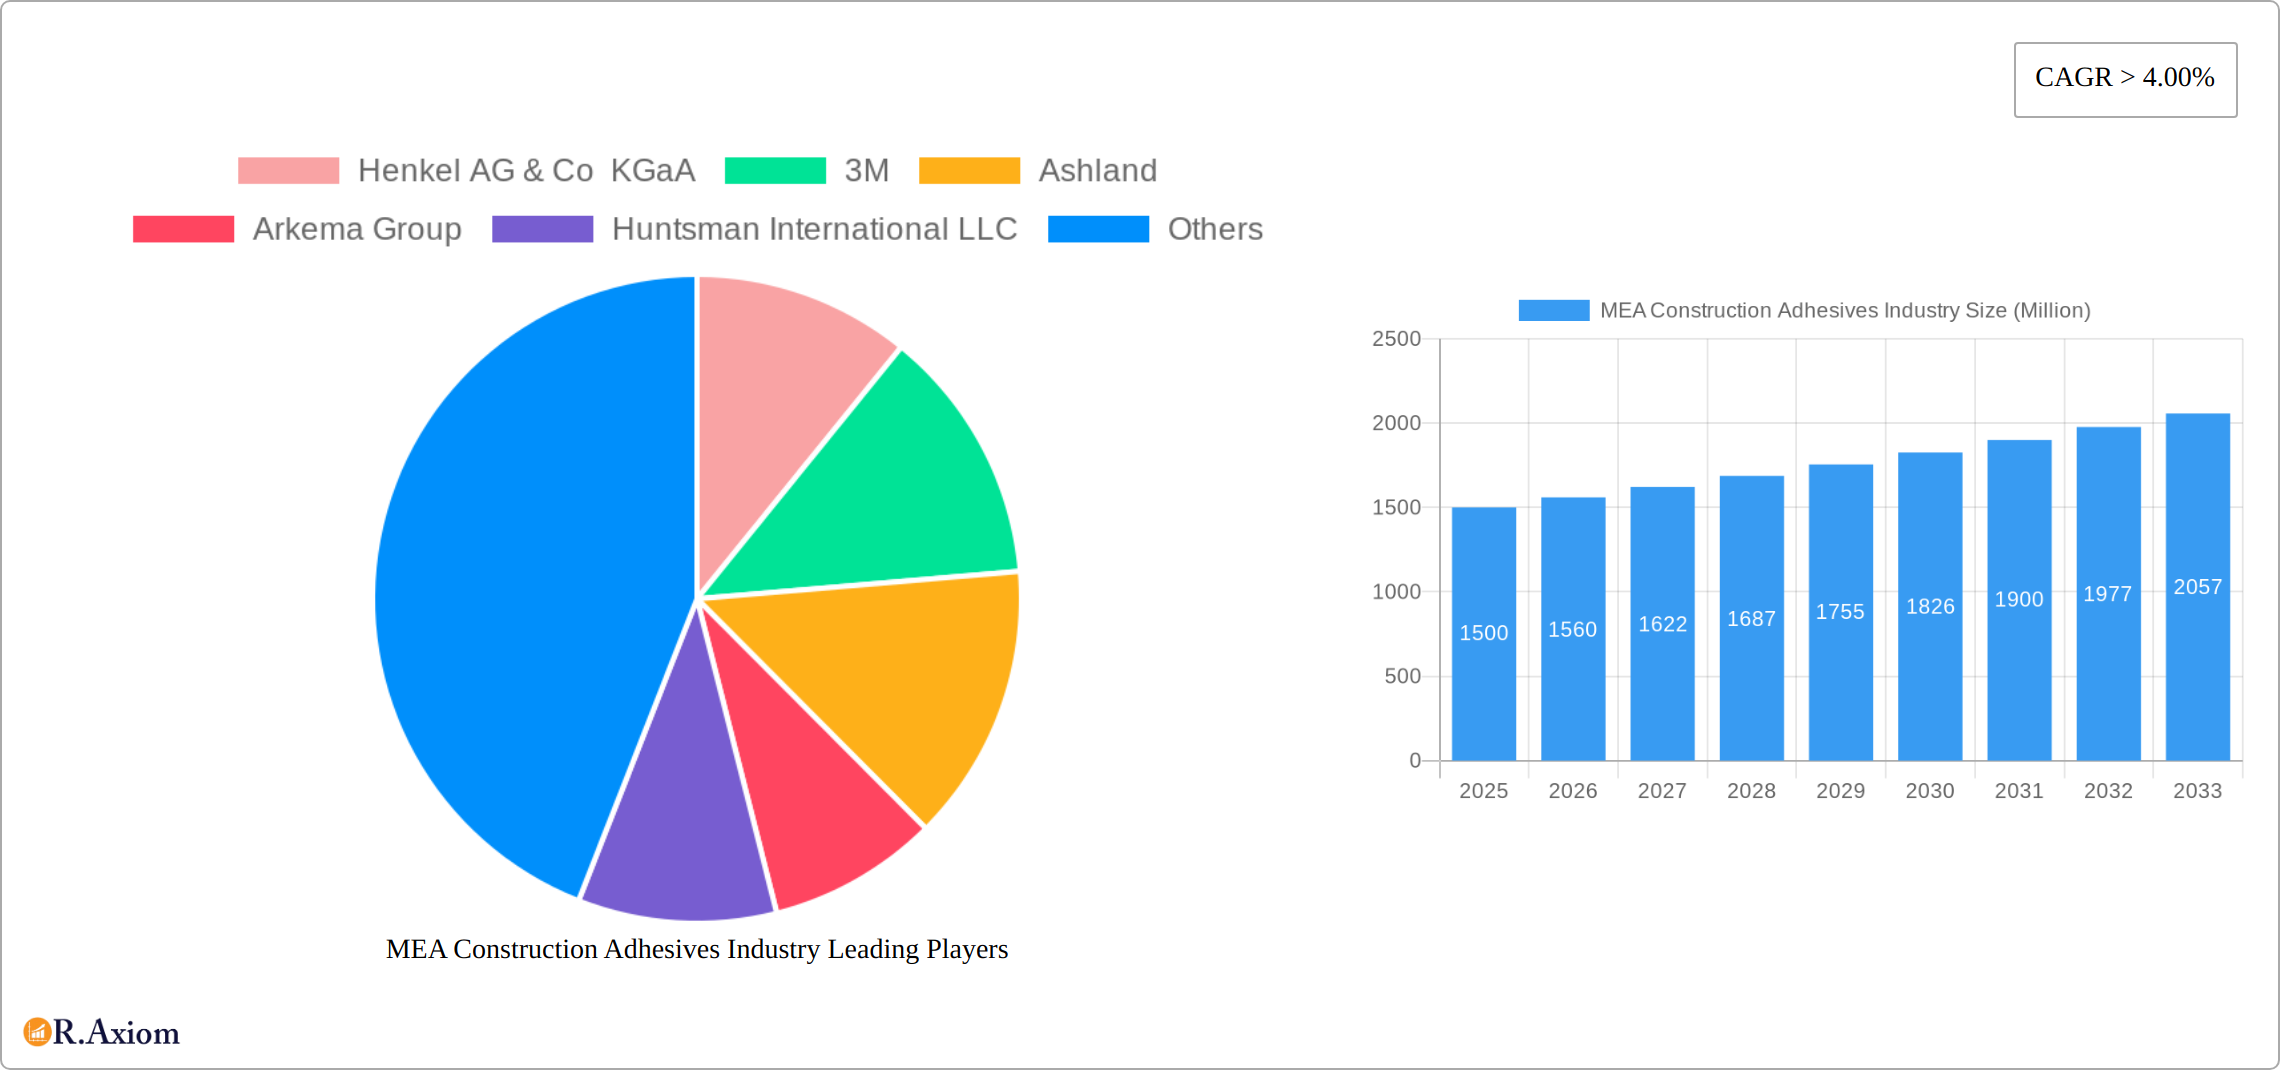
MEA Construction Adhesives Industry Company Market Share
MEA Construction Adhesives Industry: A Comprehensive Market Report (2019-2033)
This in-depth report provides a comprehensive analysis of the MEA Construction Adhesives market, offering valuable insights for industry stakeholders, investors, and strategic decision-makers. The study covers the period 2019-2033, with 2025 as the base year and a forecast period of 2025-2033. The report meticulously examines market dynamics, competitive landscape, and future growth potential, leveraging extensive primary and secondary research. The total market size in 2025 is estimated at xx Million.
MEA Construction Adhesives Industry Market Concentration & Innovation
The MEA construction adhesives market exhibits a moderately concentrated structure, with key players like Henkel AG & Co KGaA, 3M, Ashland, Arkema Group, Huntsman International LLC, Dow, H B Fuller Company, Sika AG, AVERY DENNISON CORPORATION, and Wacker Chemie AG holding significant market share. However, the presence of numerous smaller players also contributes to the competitive dynamics. Market share data for 2025 reveals that the top 5 players collectively account for approximately xx% of the total market. Innovation is a key driver, with companies continuously investing in research and development to improve product performance, sustainability, and application efficiency. Regulatory frameworks, such as those related to VOC emissions and building codes, significantly influence product development and market adoption. Product substitution is a factor, particularly with the increasing availability of eco-friendly alternatives. M&A activity has been moderate, with a few notable deals in the past five years totaling approximately xx Million in value. These activities have primarily focused on expanding product portfolios and geographic reach. End-user trends towards sustainable construction practices are also pushing innovation in the development of bio-based and low-VOC adhesives.
MEA Construction Adhesives Industry Industry Trends & Insights
The MEA construction adhesives market is witnessing robust growth, driven by a surge in construction activities across residential, commercial, and infrastructure sectors. The market is projected to register a CAGR of xx% during the forecast period (2025-2033). Technological disruptions, such as the adoption of advanced dispensing systems and automation in construction, are enhancing efficiency and productivity. Growing consumer preference for high-performance, eco-friendly adhesives is driving innovation in materials and formulations. Intense competition among key players leads to continuous product improvement, price optimization, and strategic partnerships. Market penetration of water-borne adhesives is increasing significantly due to their environmental benefits. The rising adoption of green building practices, particularly in urban development, is further bolstering market demand. Specific trends include a shift towards modular construction, impacting adhesive requirements. The increasing awareness among contractors and building owners about sustainable construction practices further drives the adoption of eco-friendly construction adhesives, leading to an enhanced market penetration rate.
Dominant Markets & Segments in MEA Construction Adhesives Industry
- Leading Region: The Gulf Cooperation Council (GCC) region currently dominates the MEA construction adhesives market, fueled by substantial infrastructure investments and a thriving construction sector. This is particularly evident in the UAE and Saudi Arabia, which are experiencing rapid urbanization and mega-project development.
- Leading Country: Saudi Arabia is a leading country within the MEA region, exhibiting exceptional growth in the construction industry driven by Vision 2030 initiatives, substantial government spending on infrastructure projects, and a robust private sector investment in real estate. The UAE closely follows, with similar drivers contributing to market expansion.
- Dominant Resin Type: Acrylic adhesives maintain the largest market share due to their versatility, cost-effectiveness, and dependable performance across diverse applications. Their suitability for both interior and exterior use further solidifies their dominance in various end-use sectors.
- Dominant Technology: Water-based technologies continue to dominate, primarily driven by their environmental sustainability and user-friendliness. This aligns with increasing regional awareness and adoption of environmentally conscious construction practices and stringent regulations promoting sustainable materials.
- Dominant End-use Sector: The residential sector remains the leading end-use segment, underpinned by burgeoning urbanization, population growth, and the resulting surge in housing demand across the MEA region. The infrastructure sector presents significant growth potential, supported by massive government-led projects and private sector investments in transportation, energy, and other critical infrastructure developments.
Key drivers for the leading segments include government-led initiatives promoting construction, substantial investments in infrastructure projects (encompassing roads, bridges, airports, and large-scale building projects), and a growing middle class with increasing disposable incomes, particularly impacting the residential segment's growth. The consistent expansion of the construction industry remains a crucial factor supporting the overall market dominance of these segments. Furthermore, the increasing adoption of sustainable building practices is driving demand for eco-friendly adhesives, further propelling market growth.
MEA Construction Adhesives Industry Product Developments
Recent product innovations focus on enhancing performance characteristics, such as increased adhesion strength, faster curing times, and improved durability. The development of eco-friendly, low-VOC adhesives is gaining traction, driven by environmental regulations and consumer demand for sustainable building materials. New product applications are emerging in specialized areas like prefabricated construction and green building technologies. Companies are also focusing on developing customized solutions tailored to specific end-user needs and construction applications. The competitive advantage lies in offering superior performance, cost-effectiveness, and sustainable solutions that meet evolving construction demands.
Report Scope & Segmentation Analysis
This report segments the MEA construction adhesives market by resin type (Acrylics, Epoxy, Polyurethanes, Polyvinyl Acetate (PVA), Silicones, Other Resin Types), technology (Water-borne, Reactive, Hot-melt, Other Technologies), and end-use sector (Residential, Commercial, Infrastructure, Industrial). Each segment’s growth projections are detailed, considering market sizes and competitive dynamics. The market size for each segment in 2025 is estimated as follows: Acrylics – xx Million, Epoxy – xx Million, Polyurethanes – xx Million, PVA – xx Million, Silicones – xx Million, and Others – xx Million. Similar estimations are provided for each technology and end-use segment. Competitive dynamics within each segment are analyzed based on the key players' market share, product portfolio, and strategic initiatives.
Key Drivers of MEA Construction Adhesives Industry Growth
Several significant factors are propelling the growth of the MEA construction adhesives market: Firstly, rapid urbanization and population growth are creating an unprecedented demand for housing and commercial spaces. Secondly, substantial government investments in infrastructure development, supported by national visions and economic diversification strategies, are fueling a surge in construction projects. Thirdly, the rise in disposable incomes among the middle class is significantly boosting demand for improved housing and commercial spaces. Finally, a growing awareness of environmentally sustainable construction practices is driving demand for eco-friendly adhesives that align with regional sustainability targets and regulations.
Challenges in the MEA Construction Adhesives Industry Sector
The MEA construction adhesives industry faces several key challenges: Fluctuations in raw material prices represent a significant risk, impacting production costs and potentially reducing profitability. Stringent environmental regulations, while promoting sustainability, can increase compliance costs and limit the use of certain adhesive types. Economic volatility in some MEA countries can impact construction activity and subsequently, market demand. Intense competition from both established multinational corporations and emerging local players creates pressure on pricing and profit margins. Supply chain disruptions, particularly exacerbated by global events, can lead to production delays and negatively affect market stability. These combined factors can significantly influence the market size and growth trajectory.
Emerging Opportunities in MEA Construction Adhesives Industry
The rising demand for sustainable and energy-efficient buildings presents significant opportunities for eco-friendly construction adhesives. The increasing adoption of prefabricated construction methods creates a niche for specialized adhesives. Exploring new markets in less developed regions within MEA presents growth potential. The development of advanced adhesive technologies with enhanced performance and durability opens avenues for premium product offerings. The rising demand for innovative solutions tailored to specific construction projects provides a platform for growth.
Leading Players in the MEA Construction Adhesives Industry Market
Key Developments in MEA Construction Adhesives Industry Industry
- January 2023: Henkel launched a new line of sustainable construction adhesives, emphasizing their commitment to environmentally friendly solutions and catering to the growing demand for green building materials within the MEA region.
- June 2022: Sika's acquisition of a regional adhesive manufacturer strengthened its market presence and provided access to new distribution channels and local expertise, enhancing its competitive position in the MEA market.
- October 2021: 3M introduced a high-performance adhesive specifically designed for prefabricated construction methods, reflecting the increasing adoption of modern construction techniques in the region and addressing the growing demand for efficiency and speed in construction projects.
- Further details on key developments and market projections will be provided in the full report.
Strategic Outlook for MEA Construction Adhesives Industry Market
The MEA construction adhesives market is poised for continued growth, driven by the region's expanding construction sector, increasing urbanization, and rising demand for sustainable building materials. Companies focusing on innovation, sustainability, and customized solutions will be well-positioned to capture market share. Strategic partnerships and collaborations can enhance market reach and accelerate product development. The long-term outlook remains positive, with significant opportunities for growth and expansion in the forecast period. The growing adoption of sustainable construction practices will further drive market growth in the coming years.
MEA Construction Adhesives Industry Segmentation
-
1. Resin Type
- 1.1. Acrylics
- 1.2. Epoxy
- 1.3. Polyurethanes
- 1.4. Polyvinyl Acetate (PVA)
- 1.5. Silicones
- 1.6. Other Resin Types
-
2. Technology
- 2.1. Water-borne
- 2.2. Reactive
- 2.3. Hot-melt
- 2.4. Other Technologies
-
3. End-use Sector
- 3.1. Residential
- 3.2. Commercial
- 3.3. Infrastructure
- 3.4. Industrial
-
4. Geography
- 4.1. Saudi Arabia
- 4.2. South Africa
- 4.3. Rest of Middle-East and Africa
MEA Construction Adhesives Industry Segmentation By Geography
- 1. Saudi Arabia
- 2. South Africa
- 3. Rest of Middle East and Africa
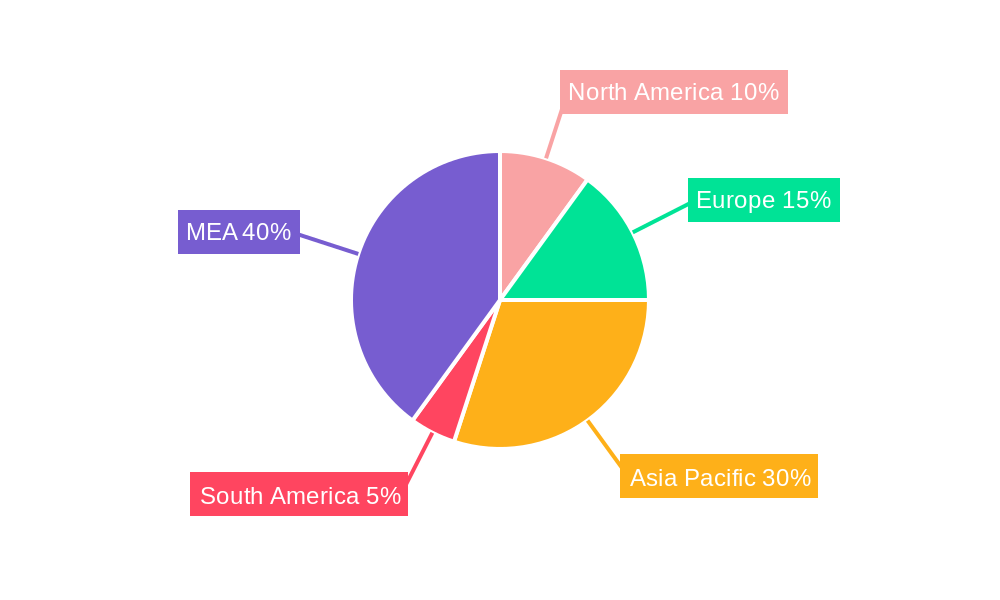
MEA Construction Adhesives Industry Regional Market Share
Geographic Coverage of MEA Construction Adhesives Industry
MEA Construction Adhesives Industry REPORT HIGHLIGHTS
| Aspects | Details |
|---|---|
| Study Period | 2020-2034 |
| Base Year | 2025 |
| Estimated Year | 2026 |
| Forecast Period | 2026-2034 |
| Historical Period | 2020-2025 |
| Growth Rate | CAGR of 5.1% from 2020-2034 |
| Segmentation |
|
Table of Contents
- 1. Introduction
- 1.1. Research Scope
- 1.2. Market Segmentation
- 1.3. Research Objective
- 1.4. Definitions and Assumptions
- 2. Executive Summary
- 2.1. Market Snapshot
- 3. Market Dynamics
- 3.1. Market Drivers
- 3.2. Market Restrains
- 3.3. Market Trends
- 3.4. Market Opportunities
- 4. Market Factor Analysis
- 4.1. Porters Five Forces
- 4.1.1. Bargaining Power of Suppliers
- 4.1.2. Bargaining Power of Buyers
- 4.1.3. Threat of New Entrants
- 4.1.4. Threat of Substitutes
- 4.1.5. Competitive Rivalry
- 4.2. PESTEL analysis
- 4.3. BCG Analysis
- 4.3.1. Stars (High Growth, High Market Share)
- 4.3.2. Cash Cows (Low Growth, High Market Share)
- 4.3.3. Question Mark (High Growth, Low Market Share)
- 4.3.4. Dogs (Low Growth, Low Market Share)
- 4.4. Ansoff Matrix Analysis
- 4.5. Supply Chain Analysis
- 4.6. Regulatory Landscape
- 4.7. Current Market Potential and Opportunity Assessment (TAM–SAM–SOM Framework)
- 4.8. RAX Analyst Note
- 4.1. Porters Five Forces
- 5. Market Analysis, Insights and Forecast 2021-2033
- 5.1. Market Analysis, Insights and Forecast - by Resin Type
- 5.1.1. Acrylics
- 5.1.2. Epoxy
- 5.1.3. Polyurethanes
- 5.1.4. Polyvinyl Acetate (PVA)
- 5.1.5. Silicones
- 5.1.6. Other Resin Types
- 5.2. Market Analysis, Insights and Forecast - by Technology
- 5.2.1. Water-borne
- 5.2.2. Reactive
- 5.2.3. Hot-melt
- 5.2.4. Other Technologies
- 5.3. Market Analysis, Insights and Forecast - by End-use Sector
- 5.3.1. Residential
- 5.3.2. Commercial
- 5.3.3. Infrastructure
- 5.3.4. Industrial
- 5.4. Market Analysis, Insights and Forecast - by Geography
- 5.4.1. Saudi Arabia
- 5.4.2. South Africa
- 5.4.3. Rest of Middle-East and Africa
- 5.5. Market Analysis, Insights and Forecast - by Region
- 5.5.1. Saudi Arabia
- 5.5.2. South Africa
- 5.5.3. Rest of Middle East and Africa
- 5.1. Market Analysis, Insights and Forecast - by Resin Type
- 6. Global MEA Construction Adhesives Industry Analysis, Insights and Forecast, 2021-2033
- 6.1. Market Analysis, Insights and Forecast - by Resin Type
- 6.1.1. Acrylics
- 6.1.2. Epoxy
- 6.1.3. Polyurethanes
- 6.1.4. Polyvinyl Acetate (PVA)
- 6.1.5. Silicones
- 6.1.6. Other Resin Types
- 6.2. Market Analysis, Insights and Forecast - by Technology
- 6.2.1. Water-borne
- 6.2.2. Reactive
- 6.2.3. Hot-melt
- 6.2.4. Other Technologies
- 6.3. Market Analysis, Insights and Forecast - by End-use Sector
- 6.3.1. Residential
- 6.3.2. Commercial
- 6.3.3. Infrastructure
- 6.3.4. Industrial
- 6.4. Market Analysis, Insights and Forecast - by Geography
- 6.4.1. Saudi Arabia
- 6.4.2. South Africa
- 6.4.3. Rest of Middle-East and Africa
- 6.1. Market Analysis, Insights and Forecast - by Resin Type
- 7. Saudi Arabia MEA Construction Adhesives Industry Analysis, Insights and Forecast, 2020-2032
- 7.1. Market Analysis, Insights and Forecast - by Resin Type
- 7.1.1. Acrylics
- 7.1.2. Epoxy
- 7.1.3. Polyurethanes
- 7.1.4. Polyvinyl Acetate (PVA)
- 7.1.5. Silicones
- 7.1.6. Other Resin Types
- 7.2. Market Analysis, Insights and Forecast - by Technology
- 7.2.1. Water-borne
- 7.2.2. Reactive
- 7.2.3. Hot-melt
- 7.2.4. Other Technologies
- 7.3. Market Analysis, Insights and Forecast - by End-use Sector
- 7.3.1. Residential
- 7.3.2. Commercial
- 7.3.3. Infrastructure
- 7.3.4. Industrial
- 7.4. Market Analysis, Insights and Forecast - by Geography
- 7.4.1. Saudi Arabia
- 7.4.2. South Africa
- 7.4.3. Rest of Middle-East and Africa
- 7.1. Market Analysis, Insights and Forecast - by Resin Type
- 8. South Africa MEA Construction Adhesives Industry Analysis, Insights and Forecast, 2020-2032
- 8.1. Market Analysis, Insights and Forecast - by Resin Type
- 8.1.1. Acrylics
- 8.1.2. Epoxy
- 8.1.3. Polyurethanes
- 8.1.4. Polyvinyl Acetate (PVA)
- 8.1.5. Silicones
- 8.1.6. Other Resin Types
- 8.2. Market Analysis, Insights and Forecast - by Technology
- 8.2.1. Water-borne
- 8.2.2. Reactive
- 8.2.3. Hot-melt
- 8.2.4. Other Technologies
- 8.3. Market Analysis, Insights and Forecast - by End-use Sector
- 8.3.1. Residential
- 8.3.2. Commercial
- 8.3.3. Infrastructure
- 8.3.4. Industrial
- 8.4. Market Analysis, Insights and Forecast - by Geography
- 8.4.1. Saudi Arabia
- 8.4.2. South Africa
- 8.4.3. Rest of Middle-East and Africa
- 8.1. Market Analysis, Insights and Forecast - by Resin Type
- 9. Rest of Middle East and Africa MEA Construction Adhesives Industry Analysis, Insights and Forecast, 2020-2032
- 9.1. Market Analysis, Insights and Forecast - by Resin Type
- 9.1.1. Acrylics
- 9.1.2. Epoxy
- 9.1.3. Polyurethanes
- 9.1.4. Polyvinyl Acetate (PVA)
- 9.1.5. Silicones
- 9.1.6. Other Resin Types
- 9.2. Market Analysis, Insights and Forecast - by Technology
- 9.2.1. Water-borne
- 9.2.2. Reactive
- 9.2.3. Hot-melt
- 9.2.4. Other Technologies
- 9.3. Market Analysis, Insights and Forecast - by End-use Sector
- 9.3.1. Residential
- 9.3.2. Commercial
- 9.3.3. Infrastructure
- 9.3.4. Industrial
- 9.4. Market Analysis, Insights and Forecast - by Geography
- 9.4.1. Saudi Arabia
- 9.4.2. South Africa
- 9.4.3. Rest of Middle-East and Africa
- 9.1. Market Analysis, Insights and Forecast - by Resin Type
- 10. Competitive Analysis
- 10.1. Company Profiles
- 10.1.1 Henkel AG & Co KGaA
- 10.1.1.1. Company Overview
- 10.1.1.2. Products
- 10.1.1.3. Company Financials
- 10.1.1.4. SWOT Analysis
- 10.1.2 3M
- 10.1.2.1. Company Overview
- 10.1.2.2. Products
- 10.1.2.3. Company Financials
- 10.1.2.4. SWOT Analysis
- 10.1.3 Ashland
- 10.1.3.1. Company Overview
- 10.1.3.2. Products
- 10.1.3.3. Company Financials
- 10.1.3.4. SWOT Analysis
- 10.1.4 Arkema Group
- 10.1.4.1. Company Overview
- 10.1.4.2. Products
- 10.1.4.3. Company Financials
- 10.1.4.4. SWOT Analysis
- 10.1.5 Huntsman International LLC
- 10.1.5.1. Company Overview
- 10.1.5.2. Products
- 10.1.5.3. Company Financials
- 10.1.5.4. SWOT Analysis
- 10.1.6 Dow
- 10.1.6.1. Company Overview
- 10.1.6.2. Products
- 10.1.6.3. Company Financials
- 10.1.6.4. SWOT Analysis
- 10.1.7 H B Fuller Company
- 10.1.7.1. Company Overview
- 10.1.7.2. Products
- 10.1.7.3. Company Financials
- 10.1.7.4. SWOT Analysis
- 10.1.8 Sika AG
- 10.1.8.1. Company Overview
- 10.1.8.2. Products
- 10.1.8.3. Company Financials
- 10.1.8.4. SWOT Analysis
- 10.1.9 AVERY DENNISON CORPORATION
- 10.1.9.1. Company Overview
- 10.1.9.2. Products
- 10.1.9.3. Company Financials
- 10.1.9.4. SWOT Analysis
- 10.1.10 Wacker Chemie AG*List Not Exhaustive
- 10.1.10.1. Company Overview
- 10.1.10.2. Products
- 10.1.10.3. Company Financials
- 10.1.10.4. SWOT Analysis
- 10.1.1 Henkel AG & Co KGaA
- 10.2. Market Entropy
- 10.2.1 Company's Key Areas Served
- 10.2.2 Recent Developments
- 10.3. Company Market Share Analysis 2025
- 10.3.1 Top 5 Companies Market Share Analysis
- 10.3.2 Top 3 Companies Market Share Analysis
- 10.4. List of Potential Customers
- 11. Research Methodology
List of Figures
- Figure 1: Global MEA Construction Adhesives Industry Revenue Breakdown (billion, %) by Region 2025 & 2033
- Figure 2: Saudi Arabia MEA Construction Adhesives Industry Revenue (billion), by Resin Type 2025 & 2033
- Figure 3: Saudi Arabia MEA Construction Adhesives Industry Revenue Share (%), by Resin Type 2025 & 2033
- Figure 4: Saudi Arabia MEA Construction Adhesives Industry Revenue (billion), by Technology 2025 & 2033
- Figure 5: Saudi Arabia MEA Construction Adhesives Industry Revenue Share (%), by Technology 2025 & 2033
- Figure 6: Saudi Arabia MEA Construction Adhesives Industry Revenue (billion), by End-use Sector 2025 & 2033
- Figure 7: Saudi Arabia MEA Construction Adhesives Industry Revenue Share (%), by End-use Sector 2025 & 2033
- Figure 8: Saudi Arabia MEA Construction Adhesives Industry Revenue (billion), by Geography 2025 & 2033
- Figure 9: Saudi Arabia MEA Construction Adhesives Industry Revenue Share (%), by Geography 2025 & 2033
- Figure 10: Saudi Arabia MEA Construction Adhesives Industry Revenue (billion), by Country 2025 & 2033
- Figure 11: Saudi Arabia MEA Construction Adhesives Industry Revenue Share (%), by Country 2025 & 2033
- Figure 12: South Africa MEA Construction Adhesives Industry Revenue (billion), by Resin Type 2025 & 2033
- Figure 13: South Africa MEA Construction Adhesives Industry Revenue Share (%), by Resin Type 2025 & 2033
- Figure 14: South Africa MEA Construction Adhesives Industry Revenue (billion), by Technology 2025 & 2033
- Figure 15: South Africa MEA Construction Adhesives Industry Revenue Share (%), by Technology 2025 & 2033
- Figure 16: South Africa MEA Construction Adhesives Industry Revenue (billion), by End-use Sector 2025 & 2033
- Figure 17: South Africa MEA Construction Adhesives Industry Revenue Share (%), by End-use Sector 2025 & 2033
- Figure 18: South Africa MEA Construction Adhesives Industry Revenue (billion), by Geography 2025 & 2033
- Figure 19: South Africa MEA Construction Adhesives Industry Revenue Share (%), by Geography 2025 & 2033
- Figure 20: South Africa MEA Construction Adhesives Industry Revenue (billion), by Country 2025 & 2033
- Figure 21: South Africa MEA Construction Adhesives Industry Revenue Share (%), by Country 2025 & 2033
- Figure 22: Rest of Middle East and Africa MEA Construction Adhesives Industry Revenue (billion), by Resin Type 2025 & 2033
- Figure 23: Rest of Middle East and Africa MEA Construction Adhesives Industry Revenue Share (%), by Resin Type 2025 & 2033
- Figure 24: Rest of Middle East and Africa MEA Construction Adhesives Industry Revenue (billion), by Technology 2025 & 2033
- Figure 25: Rest of Middle East and Africa MEA Construction Adhesives Industry Revenue Share (%), by Technology 2025 & 2033
- Figure 26: Rest of Middle East and Africa MEA Construction Adhesives Industry Revenue (billion), by End-use Sector 2025 & 2033
- Figure 27: Rest of Middle East and Africa MEA Construction Adhesives Industry Revenue Share (%), by End-use Sector 2025 & 2033
- Figure 28: Rest of Middle East and Africa MEA Construction Adhesives Industry Revenue (billion), by Geography 2025 & 2033
- Figure 29: Rest of Middle East and Africa MEA Construction Adhesives Industry Revenue Share (%), by Geography 2025 & 2033
- Figure 30: Rest of Middle East and Africa MEA Construction Adhesives Industry Revenue (billion), by Country 2025 & 2033
- Figure 31: Rest of Middle East and Africa MEA Construction Adhesives Industry Revenue Share (%), by Country 2025 & 2033
List of Tables
- Table 1: Global MEA Construction Adhesives Industry Revenue billion Forecast, by Resin Type 2020 & 2033
- Table 2: Global MEA Construction Adhesives Industry Revenue billion Forecast, by Technology 2020 & 2033
- Table 3: Global MEA Construction Adhesives Industry Revenue billion Forecast, by End-use Sector 2020 & 2033
- Table 4: Global MEA Construction Adhesives Industry Revenue billion Forecast, by Geography 2020 & 2033
- Table 5: Global MEA Construction Adhesives Industry Revenue billion Forecast, by Region 2020 & 2033
- Table 6: Global MEA Construction Adhesives Industry Revenue billion Forecast, by Resin Type 2020 & 2033
- Table 7: Global MEA Construction Adhesives Industry Revenue billion Forecast, by Technology 2020 & 2033
- Table 8: Global MEA Construction Adhesives Industry Revenue billion Forecast, by End-use Sector 2020 & 2033
- Table 9: Global MEA Construction Adhesives Industry Revenue billion Forecast, by Geography 2020 & 2033
- Table 10: Global MEA Construction Adhesives Industry Revenue billion Forecast, by Country 2020 & 2033
- Table 11: Global MEA Construction Adhesives Industry Revenue billion Forecast, by Resin Type 2020 & 2033
- Table 12: Global MEA Construction Adhesives Industry Revenue billion Forecast, by Technology 2020 & 2033
- Table 13: Global MEA Construction Adhesives Industry Revenue billion Forecast, by End-use Sector 2020 & 2033
- Table 14: Global MEA Construction Adhesives Industry Revenue billion Forecast, by Geography 2020 & 2033
- Table 15: Global MEA Construction Adhesives Industry Revenue billion Forecast, by Country 2020 & 2033
- Table 16: Global MEA Construction Adhesives Industry Revenue billion Forecast, by Resin Type 2020 & 2033
- Table 17: Global MEA Construction Adhesives Industry Revenue billion Forecast, by Technology 2020 & 2033
- Table 18: Global MEA Construction Adhesives Industry Revenue billion Forecast, by End-use Sector 2020 & 2033
- Table 19: Global MEA Construction Adhesives Industry Revenue billion Forecast, by Geography 2020 & 2033
- Table 20: Global MEA Construction Adhesives Industry Revenue billion Forecast, by Country 2020 & 2033
Frequently Asked Questions
1. What is the projected Compound Annual Growth Rate (CAGR) of the MEA Construction Adhesives Industry?
The projected CAGR is approximately 5.1%.
2. Which companies are prominent players in the MEA Construction Adhesives Industry?
Key companies in the market include Henkel AG & Co KGaA, 3M, Ashland, Arkema Group, Huntsman International LLC, Dow, H B Fuller Company, Sika AG, AVERY DENNISON CORPORATION, Wacker Chemie AG*List Not Exhaustive.
3. What are the main segments of the MEA Construction Adhesives Industry?
The market segments include Resin Type, Technology, End-use Sector, Geography.
4. Can you provide details about the market size?
The market size is estimated to be USD 10.9 billion as of 2022.
5. What are some drivers contributing to market growth?
; Rapidly Growing Construction Industry.
6. What are the notable trends driving market growth?
Waterborne Technology to Dominate the Market.
7. Are there any restraints impacting market growth?
; Limited Usage in High End Applications; Other Restraints.
8. Can you provide examples of recent developments in the market?
N/A
9. What pricing options are available for accessing the report?
Pricing options include single-user, multi-user, and enterprise licenses priced at USD 4750, USD 5250, and USD 8750 respectively.
10. Is the market size provided in terms of value or volume?
The market size is provided in terms of value, measured in billion.
11. Are there any specific market keywords associated with the report?
Yes, the market keyword associated with the report is "MEA Construction Adhesives Industry," which aids in identifying and referencing the specific market segment covered.
12. How do I determine which pricing option suits my needs best?
The pricing options vary based on user requirements and access needs. Individual users may opt for single-user licenses, while businesses requiring broader access may choose multi-user or enterprise licenses for cost-effective access to the report.
13. Are there any additional resources or data provided in the MEA Construction Adhesives Industry report?
While the report offers comprehensive insights, it's advisable to review the specific contents or supplementary materials provided to ascertain if additional resources or data are available.
14. How can I stay updated on further developments or reports in the MEA Construction Adhesives Industry?
To stay informed about further developments, trends, and reports in the MEA Construction Adhesives Industry, consider subscribing to industry newsletters, following relevant companies and organizations, or regularly checking reputable industry news sources and publications.
Methodology
Step 1 - Identification of Relevant Samples Size from Population Database


Step 2 - Approaches for Defining Global Market Size (Value, Volume* & Price*)

Note*: In applicable scenarios
Step 3 - Data Sources
Primary Research
- Web Analytics
- Survey Reports
- Research Institute
- Latest Research Reports
- Opinion Leaders
Secondary Research
- Annual Reports
- White Paper
- Latest Press Release
- Industry Association
- Paid Database
- Investor Presentations

Step 4 - Data Triangulation
Involves using different sources of information in order to increase the validity of a study
These sources are likely to be stakeholders in a program - participants, other researchers, program staff, other community members, and so on.
Then we put all data in single framework & apply various statistical tools to find out the dynamic on the market.
During the analysis stage, feedback from the stakeholder groups would be compared to determine areas of agreement as well as areas of divergence