
Key Insights
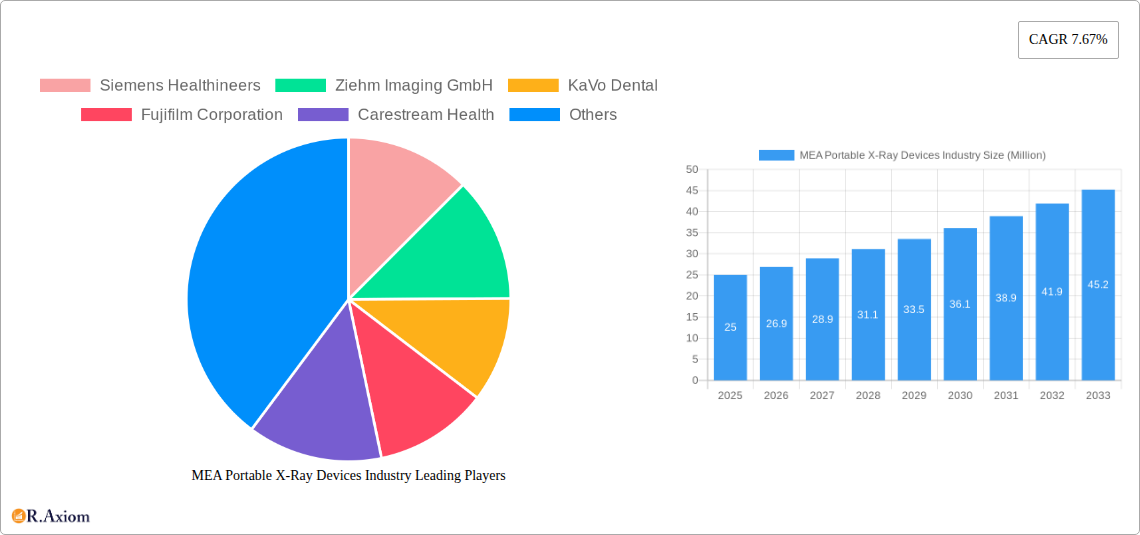
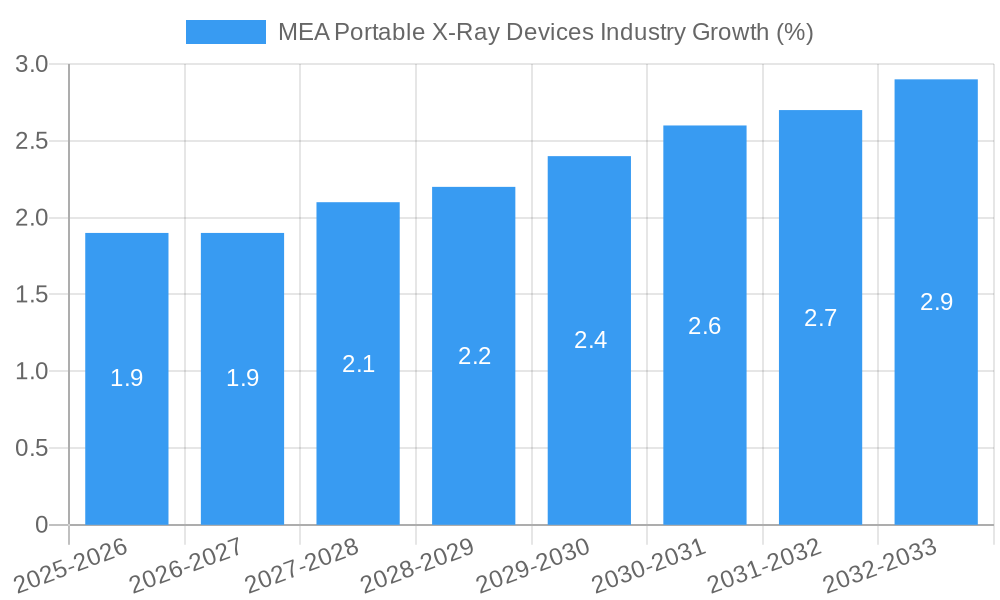
The Middle East and Africa (MEA) portable X-ray devices market is poised for significant growth, driven by increasing healthcare infrastructure development, rising prevalence of chronic diseases requiring frequent imaging, and a growing preference for point-of-care diagnostics. The market's expansion is further fueled by technological advancements in portable X-ray systems, including improved image quality, reduced radiation exposure, and enhanced portability. This allows for quicker diagnosis and treatment, especially in remote or underserved areas lacking access to centralized imaging facilities. While the precise market size for MEA in 2025 is unavailable, extrapolating from the global CAGR of 7.67% and considering the region's developing healthcare sector, a reasonable estimate places the MEA portable X-ray devices market value at approximately $25 million in 2025. This figure reflects a substantial increase from previous years, indicating considerable market potential.
The market segmentation within MEA reveals strong demand across various applications, including dental X-rays, which benefit from increased dental tourism and a growing awareness of oral hygiene. Mobile X-ray devices are witnessing particularly high adoption due to their flexibility and suitability for diverse settings like ambulances and remote clinics. Key players in the global market, such as Siemens Healthineers, GE Healthcare, and Fujifilm, are actively expanding their presence in MEA through strategic partnerships, distribution agreements, and investments in local infrastructure. However, challenges remain, including the high cost of advanced portable X-ray systems, limited reimbursement policies in some countries, and the need for skilled professionals to operate and interpret the images. Despite these restraints, the long-term outlook for the MEA portable X-ray devices market remains highly optimistic, driven by continuous technological innovation and increasing healthcare investments across the region.
MEA Portable X-Ray Devices Industry: A Comprehensive Market Report (2019-2033)
This detailed report provides a comprehensive analysis of the Middle East and Africa (MEA) portable X-ray devices industry, offering actionable insights for stakeholders from 2019 to 2033. The study covers market size, segmentation, key players, technological advancements, and future growth prospects. With a base year of 2025 and an estimated year of 2025, the forecast period extends from 2025 to 2033, encompassing the historical period of 2019-2024. The report uses Million (M) as the unit for all values.
MEA Portable X-Ray Devices Industry Market Concentration & Innovation
The MEA portable X-ray devices market exhibits a moderately concentrated landscape, with a few major players holding significant market share. Siemens Healthineers, Fujifilm Corporation, General Electric Company (GE Healthcare), and Koninklijke Philips NV are among the dominant players, collectively accounting for an estimated xx% of the market in 2025. Market share is influenced by factors such as technological innovation, brand reputation, distribution networks, and service capabilities.
Innovation is a key driver, with companies investing heavily in developing advanced digital X-ray technologies, including portable and handheld devices with improved image quality, reduced radiation exposure, and enhanced diagnostic capabilities. Regulatory frameworks, including those related to medical device approvals and radiation safety, play a significant role in shaping the market. The presence of substitute technologies, such as ultrasound and MRI, impacts market growth, though X-ray remains indispensable for certain applications. End-user trends, such as the increasing preference for minimally invasive procedures and point-of-care diagnostics, are driving demand for portable X-ray systems. Mergers and acquisitions (M&A) activity in the sector has been moderate, with deal values averaging xx Million in recent years, primarily focused on strengthening product portfolios and expanding market reach.
MEA Portable X-Ray Devices Industry Industry Trends & Insights
The MEA portable X-ray devices market is experiencing robust growth, driven by factors such as rising healthcare expenditure, increasing prevalence of chronic diseases requiring frequent imaging, and growing adoption of advanced imaging technologies in both urban and rural areas. The market is projected to exhibit a Compound Annual Growth Rate (CAGR) of xx% during the forecast period (2025-2033). Technological disruptions, particularly the shift towards digital X-ray from analog, are significantly impacting market dynamics, leading to improved image quality, reduced costs, and enhanced workflow efficiency. Consumer preferences are increasingly favoring portable and handheld devices due to their convenience, portability, and ease of use in diverse settings. The competitive landscape is characterized by intense rivalry among established players and emerging entrants, leading to product innovation, price competition, and strategic partnerships. Market penetration of digital X-ray technology is increasing steadily, with an estimated xx% market share in 2025, projected to reach xx% by 2033.
Dominant Markets & Segments in MEA Portable X-Ray Devices Industry
The MEA region shows varied growth across different segments.
Leading Region: The fastest-growing market within MEA is projected to be [Specific Country/Region, e.g., Egypt or South Africa] driven by factors such as increasing government investments in healthcare infrastructure, improving healthcare access, and rising prevalence of certain diseases.
Dominant Country: [Specific Country, e.g., South Africa] is anticipated to hold the largest market share in 2025 due to [Reasons, e.g., well-established healthcare infrastructure and higher healthcare expenditure].
Segment Analysis:
Technology: Digital X-ray is the dominant technology segment, experiencing significant growth due to its superior image quality, ease of use, and cost-effectiveness compared to analog X-ray.
Application: Chest X-ray is the largest application segment, followed by dental X-ray, reflecting the high prevalence of respiratory illnesses and the widespread use of dental X-rays in routine care.
Modality: Mobile X-ray devices are the largest modality segment because of their versatility and applicability in various settings, including hospitals, clinics, and ambulances. Handheld devices are gaining traction due to their portability and ease of use in remote areas.
Key Drivers:
- Economic policies: Government initiatives aimed at improving healthcare infrastructure and access are boosting market growth.
- Infrastructure: Investment in healthcare facilities and improving transportation networks enhances accessibility to portable X-ray services.
- Technological advancements: Continuous innovation in digital X-ray technology is driving adoption.
MEA Portable X-Ray Devices Industry Product Developments
Recent product innovations focus on enhancing portability, image quality, and workflow efficiency. Manufacturers are incorporating features like wireless connectivity, advanced image processing algorithms, and integrated software solutions to improve diagnostic accuracy and reduce the overall cost of care. The market is witnessing the integration of artificial intelligence (AI) and machine learning (ML) for automated image analysis and disease detection. These advancements cater to the growing need for faster, more accurate diagnoses, especially in resource-constrained settings.
Report Scope & Segmentation Analysis
This report segments the MEA portable X-ray devices market based on technology (Analog X-ray, Digital X-ray), application (Dental X-ray, Mammography, Chest X-ray, Abdomen X-ray), and modality (Handheld X-ray Devices, Mobile X-ray Devices). Each segment is analyzed in terms of historical and projected market size, growth drivers, challenges, and competitive dynamics. Growth projections vary significantly across segments, with digital X-ray and mobile X-ray devices showing the highest growth potential. Competitive dynamics are influenced by factors like technological innovation, pricing strategies, and brand recognition.
Key Drivers of MEA Portable X-Ray Devices Industry Growth
The growth of the MEA portable X-ray devices market is driven by several factors. Increased healthcare spending by governments and private entities is fueling demand for improved healthcare infrastructure, including diagnostic imaging equipment. The rising prevalence of chronic diseases necessitates more frequent X-ray examinations, creating a demand for efficient and accessible solutions. Technological advancements, such as the development of portable digital X-ray systems, are improving image quality, reducing radiation exposure, and increasing convenience. Favorable regulatory environments in certain countries are also facilitating market growth.
Challenges in the MEA Portable X-Ray Devices Industry Sector
Several challenges hinder the growth of the MEA portable X-ray devices market. High initial investment costs and maintenance expenses can limit affordability, particularly in low-income countries. The availability of skilled technicians and radiologists is a crucial constraint in many regions. Stringent regulatory requirements for medical device approval can delay product launches and increase costs. Supply chain disruptions and fluctuations in raw material prices can also impact market growth. Furthermore, intense competition among manufacturers can put pressure on profit margins.
Emerging Opportunities in MEA Portable X-Ray Devices Industry
The MEA portable X-ray devices market presents several emerging opportunities. The growing adoption of telemedicine and remote diagnostics creates demand for portable X-ray systems that can facilitate seamless data transfer and remote consultations. The increasing focus on point-of-care diagnostics opens up opportunities for handheld and portable X-ray devices for use in diverse settings. Furthermore, the integration of AI and ML in image analysis offers potential for improved diagnostic accuracy and reduced workload for healthcare professionals. Expansion into underserved rural areas also represents a significant growth opportunity.
Leading Players in the MEA Portable X-Ray Devices Industry Market
- Siemens Healthineers
- Ziehm Imaging GmbH
- KaVo Dental
- Fujifilm Corporation
- Carestream Health
- General Electric Company (GE Healthcare)
- Koninklijke Philips NV
- Canon Medical Systems
- Shimadzu Corporations
Key Developments in MEA Portable X-Ray Devices Industry Industry
- January 2023: LG demonstrated new medical monitors and digital x-ray detectors at Arab Health 2023, showcasing improved diagnostic accuracy. This highlights the ongoing technological advancements improving diagnostic capabilities.
- September 2022: The UNICEF Venture Fund invested in Neural Labs in Kenya, a company developing AI-powered chest X-ray disease detection. This indicates a growing focus on AI-driven solutions for improved healthcare in developing regions.
Strategic Outlook for MEA Portable X-Ray Devices Industry Market
The MEA portable X-ray devices market is poised for significant growth, driven by technological advancements, increasing healthcare expenditure, and the growing prevalence of chronic diseases. The integration of AI and ML offers substantial opportunities to enhance diagnostic accuracy and efficiency. The market will continue to see strong demand for digital X-ray systems and portable devices, particularly in remote and underserved areas. Companies focusing on innovation, affordability, and robust distribution networks will be well-positioned to capture market share.
MEA Portable X-Ray Devices Industry Segmentation
-
1. Technology
- 1.1. Analog X-ray
- 1.2. Digital X-ray
-
2. Application
- 2.1. Dental X-ray
- 2.2. Mammography
- 2.3. Chest X-ray
- 2.4. Abdomen X-ray
-
3. Modality
- 3.1. Handheld X-ray Devices
- 3.2. Mobile X-ray Devices
-
4. Geography
- 4.1. GCC
- 4.2. South Africa
- 4.3. Rest of Middle East and Africa
MEA Portable X-Ray Devices Industry Segmentation By Geography
- 1. GCC
- 2. South Africa
- 3. Rest of Middle East and Africa
MEA Portable X-Ray Devices Industry REPORT HIGHLIGHTS
| Aspects | Details |
|---|---|
| Study Period | 2019-2033 |
| Base Year | 2024 |
| Estimated Year | 2025 |
| Forecast Period | 2025-2033 |
| Historical Period | 2019-2024 |
| Growth Rate | CAGR of 7.67% from 2019-2033 |
| Segmentation |
|
Table of Contents
- 1. Introduction
- 1.1. Research Scope
- 1.2. Market Segmentation
- 1.3. Research Methodology
- 1.4. Definitions and Assumptions
- 2. Executive Summary
- 2.1. Introduction
- 3. Market Dynamics
- 3.1. Introduction
- 3.2. Market Drivers
- 3.2.1. Technological Advancements and Rise in Awareness Regarding Portable Devices; Increase in Geriatric Population with Mobility Issues
- 3.3. Market Restrains
- 3.3.1. High Risk of Radiation Exposure
- 3.4. Market Trends
- 3.4.1. Digital X-ray is Expected to Hold a Significant Share of the Market During the Forecasted Period
- 4. Market Factor Analysis
- 4.1. Porters Five Forces
- 4.2. Supply/Value Chain
- 4.3. PESTEL analysis
- 4.4. Market Entropy
- 4.5. Patent/Trademark Analysis
- 5. Global MEA Portable X-Ray Devices Industry Analysis, Insights and Forecast, 2019-2031
- 5.1. Market Analysis, Insights and Forecast - by Technology
- 5.1.1. Analog X-ray
- 5.1.2. Digital X-ray
- 5.2. Market Analysis, Insights and Forecast - by Application
- 5.2.1. Dental X-ray
- 5.2.2. Mammography
- 5.2.3. Chest X-ray
- 5.2.4. Abdomen X-ray
- 5.3. Market Analysis, Insights and Forecast - by Modality
- 5.3.1. Handheld X-ray Devices
- 5.3.2. Mobile X-ray Devices
- 5.4. Market Analysis, Insights and Forecast - by Geography
- 5.4.1. GCC
- 5.4.2. South Africa
- 5.4.3. Rest of Middle East and Africa
- 5.5. Market Analysis, Insights and Forecast - by Region
- 5.5.1. GCC
- 5.5.2. South Africa
- 5.5.3. Rest of Middle East and Africa
- 5.1. Market Analysis, Insights and Forecast - by Technology
- 6. GCC MEA Portable X-Ray Devices Industry Analysis, Insights and Forecast, 2019-2031
- 6.1. Market Analysis, Insights and Forecast - by Technology
- 6.1.1. Analog X-ray
- 6.1.2. Digital X-ray
- 6.2. Market Analysis, Insights and Forecast - by Application
- 6.2.1. Dental X-ray
- 6.2.2. Mammography
- 6.2.3. Chest X-ray
- 6.2.4. Abdomen X-ray
- 6.3. Market Analysis, Insights and Forecast - by Modality
- 6.3.1. Handheld X-ray Devices
- 6.3.2. Mobile X-ray Devices
- 6.4. Market Analysis, Insights and Forecast - by Geography
- 6.4.1. GCC
- 6.4.2. South Africa
- 6.4.3. Rest of Middle East and Africa
- 6.1. Market Analysis, Insights and Forecast - by Technology
- 7. South Africa MEA Portable X-Ray Devices Industry Analysis, Insights and Forecast, 2019-2031
- 7.1. Market Analysis, Insights and Forecast - by Technology
- 7.1.1. Analog X-ray
- 7.1.2. Digital X-ray
- 7.2. Market Analysis, Insights and Forecast - by Application
- 7.2.1. Dental X-ray
- 7.2.2. Mammography
- 7.2.3. Chest X-ray
- 7.2.4. Abdomen X-ray
- 7.3. Market Analysis, Insights and Forecast - by Modality
- 7.3.1. Handheld X-ray Devices
- 7.3.2. Mobile X-ray Devices
- 7.4. Market Analysis, Insights and Forecast - by Geography
- 7.4.1. GCC
- 7.4.2. South Africa
- 7.4.3. Rest of Middle East and Africa
- 7.1. Market Analysis, Insights and Forecast - by Technology
- 8. Rest of Middle East and Africa MEA Portable X-Ray Devices Industry Analysis, Insights and Forecast, 2019-2031
- 8.1. Market Analysis, Insights and Forecast - by Technology
- 8.1.1. Analog X-ray
- 8.1.2. Digital X-ray
- 8.2. Market Analysis, Insights and Forecast - by Application
- 8.2.1. Dental X-ray
- 8.2.2. Mammography
- 8.2.3. Chest X-ray
- 8.2.4. Abdomen X-ray
- 8.3. Market Analysis, Insights and Forecast - by Modality
- 8.3.1. Handheld X-ray Devices
- 8.3.2. Mobile X-ray Devices
- 8.4. Market Analysis, Insights and Forecast - by Geography
- 8.4.1. GCC
- 8.4.2. South Africa
- 8.4.3. Rest of Middle East and Africa
- 8.1. Market Analysis, Insights and Forecast - by Technology
- 9. North America MEA Portable X-Ray Devices Industry Analysis, Insights and Forecast, 2019-2031
- 9.1. Market Analysis, Insights and Forecast - By Country/Sub-region
- 9.1.1 United States
- 9.1.2 Canada
- 9.1.3 Mexico
- 10. Europe MEA Portable X-Ray Devices Industry Analysis, Insights and Forecast, 2019-2031
- 10.1. Market Analysis, Insights and Forecast - By Country/Sub-region
- 10.1.1 Germany
- 10.1.2 United Kingdom
- 10.1.3 France
- 10.1.4 Spain
- 10.1.5 Italy
- 10.1.6 Spain
- 10.1.7 Belgium
- 10.1.8 Netherland
- 10.1.9 Nordics
- 10.1.10 Rest of Europe
- 11. Asia Pacific MEA Portable X-Ray Devices Industry Analysis, Insights and Forecast, 2019-2031
- 11.1. Market Analysis, Insights and Forecast - By Country/Sub-region
- 11.1.1 China
- 11.1.2 Japan
- 11.1.3 India
- 11.1.4 South Korea
- 11.1.5 Southeast Asia
- 11.1.6 Australia
- 11.1.7 Indonesia
- 11.1.8 Phillipes
- 11.1.9 Singapore
- 11.1.10 Thailandc
- 11.1.11 Rest of Asia Pacific
- 12. South America MEA Portable X-Ray Devices Industry Analysis, Insights and Forecast, 2019-2031
- 12.1. Market Analysis, Insights and Forecast - By Country/Sub-region
- 12.1.1 Brazil
- 12.1.2 Argentina
- 12.1.3 Peru
- 12.1.4 Chile
- 12.1.5 Colombia
- 12.1.6 Ecuador
- 12.1.7 Venezuela
- 12.1.8 Rest of South America
- 13. MEA MEA Portable X-Ray Devices Industry Analysis, Insights and Forecast, 2019-2031
- 13.1. Market Analysis, Insights and Forecast - By Country/Sub-region
- 13.1.1 United Arab Emirates
- 13.1.2 Saudi Arabia
- 13.1.3 South Africa
- 13.1.4 Rest of Middle East and Africa
- 14. Competitive Analysis
- 14.1. Global Market Share Analysis 2024
- 14.2. Company Profiles
- 14.2.1 Siemens Healthineers
- 14.2.1.1. Overview
- 14.2.1.2. Products
- 14.2.1.3. SWOT Analysis
- 14.2.1.4. Recent Developments
- 14.2.1.5. Financials (Based on Availability)
- 14.2.2 Ziehm Imaging GmbH
- 14.2.2.1. Overview
- 14.2.2.2. Products
- 14.2.2.3. SWOT Analysis
- 14.2.2.4. Recent Developments
- 14.2.2.5. Financials (Based on Availability)
- 14.2.3 KaVo Dental
- 14.2.3.1. Overview
- 14.2.3.2. Products
- 14.2.3.3. SWOT Analysis
- 14.2.3.4. Recent Developments
- 14.2.3.5. Financials (Based on Availability)
- 14.2.4 Fujifilm Corporation
- 14.2.4.1. Overview
- 14.2.4.2. Products
- 14.2.4.3. SWOT Analysis
- 14.2.4.4. Recent Developments
- 14.2.4.5. Financials (Based on Availability)
- 14.2.5 Carestream Health
- 14.2.5.1. Overview
- 14.2.5.2. Products
- 14.2.5.3. SWOT Analysis
- 14.2.5.4. Recent Developments
- 14.2.5.5. Financials (Based on Availability)
- 14.2.6 General Electric Company (GE Healthcare)
- 14.2.6.1. Overview
- 14.2.6.2. Products
- 14.2.6.3. SWOT Analysis
- 14.2.6.4. Recent Developments
- 14.2.6.5. Financials (Based on Availability)
- 14.2.7 Koninklijke Philips NV
- 14.2.7.1. Overview
- 14.2.7.2. Products
- 14.2.7.3. SWOT Analysis
- 14.2.7.4. Recent Developments
- 14.2.7.5. Financials (Based on Availability)
- 14.2.8 Canon Medical Systems
- 14.2.8.1. Overview
- 14.2.8.2. Products
- 14.2.8.3. SWOT Analysis
- 14.2.8.4. Recent Developments
- 14.2.8.5. Financials (Based on Availability)
- 14.2.9 Shimadzu Corporations
- 14.2.9.1. Overview
- 14.2.9.2. Products
- 14.2.9.3. SWOT Analysis
- 14.2.9.4. Recent Developments
- 14.2.9.5. Financials (Based on Availability)
- 14.2.1 Siemens Healthineers
List of Figures
- Figure 1: Global MEA Portable X-Ray Devices Industry Revenue Breakdown (Million, %) by Region 2024 & 2032
- Figure 2: Global MEA Portable X-Ray Devices Industry Volume Breakdown (K Unit, %) by Region 2024 & 2032
- Figure 3: North America MEA Portable X-Ray Devices Industry Revenue (Million), by Country 2024 & 2032
- Figure 4: North America MEA Portable X-Ray Devices Industry Volume (K Unit), by Country 2024 & 2032
- Figure 5: North America MEA Portable X-Ray Devices Industry Revenue Share (%), by Country 2024 & 2032
- Figure 6: North America MEA Portable X-Ray Devices Industry Volume Share (%), by Country 2024 & 2032
- Figure 7: Europe MEA Portable X-Ray Devices Industry Revenue (Million), by Country 2024 & 2032
- Figure 8: Europe MEA Portable X-Ray Devices Industry Volume (K Unit), by Country 2024 & 2032
- Figure 9: Europe MEA Portable X-Ray Devices Industry Revenue Share (%), by Country 2024 & 2032
- Figure 10: Europe MEA Portable X-Ray Devices Industry Volume Share (%), by Country 2024 & 2032
- Figure 11: Asia Pacific MEA Portable X-Ray Devices Industry Revenue (Million), by Country 2024 & 2032
- Figure 12: Asia Pacific MEA Portable X-Ray Devices Industry Volume (K Unit), by Country 2024 & 2032
- Figure 13: Asia Pacific MEA Portable X-Ray Devices Industry Revenue Share (%), by Country 2024 & 2032
- Figure 14: Asia Pacific MEA Portable X-Ray Devices Industry Volume Share (%), by Country 2024 & 2032
- Figure 15: South America MEA Portable X-Ray Devices Industry Revenue (Million), by Country 2024 & 2032
- Figure 16: South America MEA Portable X-Ray Devices Industry Volume (K Unit), by Country 2024 & 2032
- Figure 17: South America MEA Portable X-Ray Devices Industry Revenue Share (%), by Country 2024 & 2032
- Figure 18: South America MEA Portable X-Ray Devices Industry Volume Share (%), by Country 2024 & 2032
- Figure 19: MEA MEA Portable X-Ray Devices Industry Revenue (Million), by Country 2024 & 2032
- Figure 20: MEA MEA Portable X-Ray Devices Industry Volume (K Unit), by Country 2024 & 2032
- Figure 21: MEA MEA Portable X-Ray Devices Industry Revenue Share (%), by Country 2024 & 2032
- Figure 22: MEA MEA Portable X-Ray Devices Industry Volume Share (%), by Country 2024 & 2032
- Figure 23: GCC MEA Portable X-Ray Devices Industry Revenue (Million), by Technology 2024 & 2032
- Figure 24: GCC MEA Portable X-Ray Devices Industry Volume (K Unit), by Technology 2024 & 2032
- Figure 25: GCC MEA Portable X-Ray Devices Industry Revenue Share (%), by Technology 2024 & 2032
- Figure 26: GCC MEA Portable X-Ray Devices Industry Volume Share (%), by Technology 2024 & 2032
- Figure 27: GCC MEA Portable X-Ray Devices Industry Revenue (Million), by Application 2024 & 2032
- Figure 28: GCC MEA Portable X-Ray Devices Industry Volume (K Unit), by Application 2024 & 2032
- Figure 29: GCC MEA Portable X-Ray Devices Industry Revenue Share (%), by Application 2024 & 2032
- Figure 30: GCC MEA Portable X-Ray Devices Industry Volume Share (%), by Application 2024 & 2032
- Figure 31: GCC MEA Portable X-Ray Devices Industry Revenue (Million), by Modality 2024 & 2032
- Figure 32: GCC MEA Portable X-Ray Devices Industry Volume (K Unit), by Modality 2024 & 2032
- Figure 33: GCC MEA Portable X-Ray Devices Industry Revenue Share (%), by Modality 2024 & 2032
- Figure 34: GCC MEA Portable X-Ray Devices Industry Volume Share (%), by Modality 2024 & 2032
- Figure 35: GCC MEA Portable X-Ray Devices Industry Revenue (Million), by Geography 2024 & 2032
- Figure 36: GCC MEA Portable X-Ray Devices Industry Volume (K Unit), by Geography 2024 & 2032
- Figure 37: GCC MEA Portable X-Ray Devices Industry Revenue Share (%), by Geography 2024 & 2032
- Figure 38: GCC MEA Portable X-Ray Devices Industry Volume Share (%), by Geography 2024 & 2032
- Figure 39: GCC MEA Portable X-Ray Devices Industry Revenue (Million), by Country 2024 & 2032
- Figure 40: GCC MEA Portable X-Ray Devices Industry Volume (K Unit), by Country 2024 & 2032
- Figure 41: GCC MEA Portable X-Ray Devices Industry Revenue Share (%), by Country 2024 & 2032
- Figure 42: GCC MEA Portable X-Ray Devices Industry Volume Share (%), by Country 2024 & 2032
- Figure 43: South Africa MEA Portable X-Ray Devices Industry Revenue (Million), by Technology 2024 & 2032
- Figure 44: South Africa MEA Portable X-Ray Devices Industry Volume (K Unit), by Technology 2024 & 2032
- Figure 45: South Africa MEA Portable X-Ray Devices Industry Revenue Share (%), by Technology 2024 & 2032
- Figure 46: South Africa MEA Portable X-Ray Devices Industry Volume Share (%), by Technology 2024 & 2032
- Figure 47: South Africa MEA Portable X-Ray Devices Industry Revenue (Million), by Application 2024 & 2032
- Figure 48: South Africa MEA Portable X-Ray Devices Industry Volume (K Unit), by Application 2024 & 2032
- Figure 49: South Africa MEA Portable X-Ray Devices Industry Revenue Share (%), by Application 2024 & 2032
- Figure 50: South Africa MEA Portable X-Ray Devices Industry Volume Share (%), by Application 2024 & 2032
- Figure 51: South Africa MEA Portable X-Ray Devices Industry Revenue (Million), by Modality 2024 & 2032
- Figure 52: South Africa MEA Portable X-Ray Devices Industry Volume (K Unit), by Modality 2024 & 2032
- Figure 53: South Africa MEA Portable X-Ray Devices Industry Revenue Share (%), by Modality 2024 & 2032
- Figure 54: South Africa MEA Portable X-Ray Devices Industry Volume Share (%), by Modality 2024 & 2032
- Figure 55: South Africa MEA Portable X-Ray Devices Industry Revenue (Million), by Geography 2024 & 2032
- Figure 56: South Africa MEA Portable X-Ray Devices Industry Volume (K Unit), by Geography 2024 & 2032
- Figure 57: South Africa MEA Portable X-Ray Devices Industry Revenue Share (%), by Geography 2024 & 2032
- Figure 58: South Africa MEA Portable X-Ray Devices Industry Volume Share (%), by Geography 2024 & 2032
- Figure 59: South Africa MEA Portable X-Ray Devices Industry Revenue (Million), by Country 2024 & 2032
- Figure 60: South Africa MEA Portable X-Ray Devices Industry Volume (K Unit), by Country 2024 & 2032
- Figure 61: South Africa MEA Portable X-Ray Devices Industry Revenue Share (%), by Country 2024 & 2032
- Figure 62: South Africa MEA Portable X-Ray Devices Industry Volume Share (%), by Country 2024 & 2032
- Figure 63: Rest of Middle East and Africa MEA Portable X-Ray Devices Industry Revenue (Million), by Technology 2024 & 2032
- Figure 64: Rest of Middle East and Africa MEA Portable X-Ray Devices Industry Volume (K Unit), by Technology 2024 & 2032
- Figure 65: Rest of Middle East and Africa MEA Portable X-Ray Devices Industry Revenue Share (%), by Technology 2024 & 2032
- Figure 66: Rest of Middle East and Africa MEA Portable X-Ray Devices Industry Volume Share (%), by Technology 2024 & 2032
- Figure 67: Rest of Middle East and Africa MEA Portable X-Ray Devices Industry Revenue (Million), by Application 2024 & 2032
- Figure 68: Rest of Middle East and Africa MEA Portable X-Ray Devices Industry Volume (K Unit), by Application 2024 & 2032
- Figure 69: Rest of Middle East and Africa MEA Portable X-Ray Devices Industry Revenue Share (%), by Application 2024 & 2032
- Figure 70: Rest of Middle East and Africa MEA Portable X-Ray Devices Industry Volume Share (%), by Application 2024 & 2032
- Figure 71: Rest of Middle East and Africa MEA Portable X-Ray Devices Industry Revenue (Million), by Modality 2024 & 2032
- Figure 72: Rest of Middle East and Africa MEA Portable X-Ray Devices Industry Volume (K Unit), by Modality 2024 & 2032
- Figure 73: Rest of Middle East and Africa MEA Portable X-Ray Devices Industry Revenue Share (%), by Modality 2024 & 2032
- Figure 74: Rest of Middle East and Africa MEA Portable X-Ray Devices Industry Volume Share (%), by Modality 2024 & 2032
- Figure 75: Rest of Middle East and Africa MEA Portable X-Ray Devices Industry Revenue (Million), by Geography 2024 & 2032
- Figure 76: Rest of Middle East and Africa MEA Portable X-Ray Devices Industry Volume (K Unit), by Geography 2024 & 2032
- Figure 77: Rest of Middle East and Africa MEA Portable X-Ray Devices Industry Revenue Share (%), by Geography 2024 & 2032
- Figure 78: Rest of Middle East and Africa MEA Portable X-Ray Devices Industry Volume Share (%), by Geography 2024 & 2032
- Figure 79: Rest of Middle East and Africa MEA Portable X-Ray Devices Industry Revenue (Million), by Country 2024 & 2032
- Figure 80: Rest of Middle East and Africa MEA Portable X-Ray Devices Industry Volume (K Unit), by Country 2024 & 2032
- Figure 81: Rest of Middle East and Africa MEA Portable X-Ray Devices Industry Revenue Share (%), by Country 2024 & 2032
- Figure 82: Rest of Middle East and Africa MEA Portable X-Ray Devices Industry Volume Share (%), by Country 2024 & 2032
List of Tables
- Table 1: Global MEA Portable X-Ray Devices Industry Revenue Million Forecast, by Region 2019 & 2032
- Table 2: Global MEA Portable X-Ray Devices Industry Volume K Unit Forecast, by Region 2019 & 2032
- Table 3: Global MEA Portable X-Ray Devices Industry Revenue Million Forecast, by Technology 2019 & 2032
- Table 4: Global MEA Portable X-Ray Devices Industry Volume K Unit Forecast, by Technology 2019 & 2032
- Table 5: Global MEA Portable X-Ray Devices Industry Revenue Million Forecast, by Application 2019 & 2032
- Table 6: Global MEA Portable X-Ray Devices Industry Volume K Unit Forecast, by Application 2019 & 2032
- Table 7: Global MEA Portable X-Ray Devices Industry Revenue Million Forecast, by Modality 2019 & 2032
- Table 8: Global MEA Portable X-Ray Devices Industry Volume K Unit Forecast, by Modality 2019 & 2032
- Table 9: Global MEA Portable X-Ray Devices Industry Revenue Million Forecast, by Geography 2019 & 2032
- Table 10: Global MEA Portable X-Ray Devices Industry Volume K Unit Forecast, by Geography 2019 & 2032
- Table 11: Global MEA Portable X-Ray Devices Industry Revenue Million Forecast, by Region 2019 & 2032
- Table 12: Global MEA Portable X-Ray Devices Industry Volume K Unit Forecast, by Region 2019 & 2032
- Table 13: Global MEA Portable X-Ray Devices Industry Revenue Million Forecast, by Country 2019 & 2032
- Table 14: Global MEA Portable X-Ray Devices Industry Volume K Unit Forecast, by Country 2019 & 2032
- Table 15: United States MEA Portable X-Ray Devices Industry Revenue (Million) Forecast, by Application 2019 & 2032
- Table 16: United States MEA Portable X-Ray Devices Industry Volume (K Unit) Forecast, by Application 2019 & 2032
- Table 17: Canada MEA Portable X-Ray Devices Industry Revenue (Million) Forecast, by Application 2019 & 2032
- Table 18: Canada MEA Portable X-Ray Devices Industry Volume (K Unit) Forecast, by Application 2019 & 2032
- Table 19: Mexico MEA Portable X-Ray Devices Industry Revenue (Million) Forecast, by Application 2019 & 2032
- Table 20: Mexico MEA Portable X-Ray Devices Industry Volume (K Unit) Forecast, by Application 2019 & 2032
- Table 21: Global MEA Portable X-Ray Devices Industry Revenue Million Forecast, by Country 2019 & 2032
- Table 22: Global MEA Portable X-Ray Devices Industry Volume K Unit Forecast, by Country 2019 & 2032
- Table 23: Germany MEA Portable X-Ray Devices Industry Revenue (Million) Forecast, by Application 2019 & 2032
- Table 24: Germany MEA Portable X-Ray Devices Industry Volume (K Unit) Forecast, by Application 2019 & 2032
- Table 25: United Kingdom MEA Portable X-Ray Devices Industry Revenue (Million) Forecast, by Application 2019 & 2032
- Table 26: United Kingdom MEA Portable X-Ray Devices Industry Volume (K Unit) Forecast, by Application 2019 & 2032
- Table 27: France MEA Portable X-Ray Devices Industry Revenue (Million) Forecast, by Application 2019 & 2032
- Table 28: France MEA Portable X-Ray Devices Industry Volume (K Unit) Forecast, by Application 2019 & 2032
- Table 29: Spain MEA Portable X-Ray Devices Industry Revenue (Million) Forecast, by Application 2019 & 2032
- Table 30: Spain MEA Portable X-Ray Devices Industry Volume (K Unit) Forecast, by Application 2019 & 2032
- Table 31: Italy MEA Portable X-Ray Devices Industry Revenue (Million) Forecast, by Application 2019 & 2032
- Table 32: Italy MEA Portable X-Ray Devices Industry Volume (K Unit) Forecast, by Application 2019 & 2032
- Table 33: Spain MEA Portable X-Ray Devices Industry Revenue (Million) Forecast, by Application 2019 & 2032
- Table 34: Spain MEA Portable X-Ray Devices Industry Volume (K Unit) Forecast, by Application 2019 & 2032
- Table 35: Belgium MEA Portable X-Ray Devices Industry Revenue (Million) Forecast, by Application 2019 & 2032
- Table 36: Belgium MEA Portable X-Ray Devices Industry Volume (K Unit) Forecast, by Application 2019 & 2032
- Table 37: Netherland MEA Portable X-Ray Devices Industry Revenue (Million) Forecast, by Application 2019 & 2032
- Table 38: Netherland MEA Portable X-Ray Devices Industry Volume (K Unit) Forecast, by Application 2019 & 2032
- Table 39: Nordics MEA Portable X-Ray Devices Industry Revenue (Million) Forecast, by Application 2019 & 2032
- Table 40: Nordics MEA Portable X-Ray Devices Industry Volume (K Unit) Forecast, by Application 2019 & 2032
- Table 41: Rest of Europe MEA Portable X-Ray Devices Industry Revenue (Million) Forecast, by Application 2019 & 2032
- Table 42: Rest of Europe MEA Portable X-Ray Devices Industry Volume (K Unit) Forecast, by Application 2019 & 2032
- Table 43: Global MEA Portable X-Ray Devices Industry Revenue Million Forecast, by Country 2019 & 2032
- Table 44: Global MEA Portable X-Ray Devices Industry Volume K Unit Forecast, by Country 2019 & 2032
- Table 45: China MEA Portable X-Ray Devices Industry Revenue (Million) Forecast, by Application 2019 & 2032
- Table 46: China MEA Portable X-Ray Devices Industry Volume (K Unit) Forecast, by Application 2019 & 2032
- Table 47: Japan MEA Portable X-Ray Devices Industry Revenue (Million) Forecast, by Application 2019 & 2032
- Table 48: Japan MEA Portable X-Ray Devices Industry Volume (K Unit) Forecast, by Application 2019 & 2032
- Table 49: India MEA Portable X-Ray Devices Industry Revenue (Million) Forecast, by Application 2019 & 2032
- Table 50: India MEA Portable X-Ray Devices Industry Volume (K Unit) Forecast, by Application 2019 & 2032
- Table 51: South Korea MEA Portable X-Ray Devices Industry Revenue (Million) Forecast, by Application 2019 & 2032
- Table 52: South Korea MEA Portable X-Ray Devices Industry Volume (K Unit) Forecast, by Application 2019 & 2032
- Table 53: Southeast Asia MEA Portable X-Ray Devices Industry Revenue (Million) Forecast, by Application 2019 & 2032
- Table 54: Southeast Asia MEA Portable X-Ray Devices Industry Volume (K Unit) Forecast, by Application 2019 & 2032
- Table 55: Australia MEA Portable X-Ray Devices Industry Revenue (Million) Forecast, by Application 2019 & 2032
- Table 56: Australia MEA Portable X-Ray Devices Industry Volume (K Unit) Forecast, by Application 2019 & 2032
- Table 57: Indonesia MEA Portable X-Ray Devices Industry Revenue (Million) Forecast, by Application 2019 & 2032
- Table 58: Indonesia MEA Portable X-Ray Devices Industry Volume (K Unit) Forecast, by Application 2019 & 2032
- Table 59: Phillipes MEA Portable X-Ray Devices Industry Revenue (Million) Forecast, by Application 2019 & 2032
- Table 60: Phillipes MEA Portable X-Ray Devices Industry Volume (K Unit) Forecast, by Application 2019 & 2032
- Table 61: Singapore MEA Portable X-Ray Devices Industry Revenue (Million) Forecast, by Application 2019 & 2032
- Table 62: Singapore MEA Portable X-Ray Devices Industry Volume (K Unit) Forecast, by Application 2019 & 2032
- Table 63: Thailandc MEA Portable X-Ray Devices Industry Revenue (Million) Forecast, by Application 2019 & 2032
- Table 64: Thailandc MEA Portable X-Ray Devices Industry Volume (K Unit) Forecast, by Application 2019 & 2032
- Table 65: Rest of Asia Pacific MEA Portable X-Ray Devices Industry Revenue (Million) Forecast, by Application 2019 & 2032
- Table 66: Rest of Asia Pacific MEA Portable X-Ray Devices Industry Volume (K Unit) Forecast, by Application 2019 & 2032
- Table 67: Global MEA Portable X-Ray Devices Industry Revenue Million Forecast, by Country 2019 & 2032
- Table 68: Global MEA Portable X-Ray Devices Industry Volume K Unit Forecast, by Country 2019 & 2032
- Table 69: Brazil MEA Portable X-Ray Devices Industry Revenue (Million) Forecast, by Application 2019 & 2032
- Table 70: Brazil MEA Portable X-Ray Devices Industry Volume (K Unit) Forecast, by Application 2019 & 2032
- Table 71: Argentina MEA Portable X-Ray Devices Industry Revenue (Million) Forecast, by Application 2019 & 2032
- Table 72: Argentina MEA Portable X-Ray Devices Industry Volume (K Unit) Forecast, by Application 2019 & 2032
- Table 73: Peru MEA Portable X-Ray Devices Industry Revenue (Million) Forecast, by Application 2019 & 2032
- Table 74: Peru MEA Portable X-Ray Devices Industry Volume (K Unit) Forecast, by Application 2019 & 2032
- Table 75: Chile MEA Portable X-Ray Devices Industry Revenue (Million) Forecast, by Application 2019 & 2032
- Table 76: Chile MEA Portable X-Ray Devices Industry Volume (K Unit) Forecast, by Application 2019 & 2032
- Table 77: Colombia MEA Portable X-Ray Devices Industry Revenue (Million) Forecast, by Application 2019 & 2032
- Table 78: Colombia MEA Portable X-Ray Devices Industry Volume (K Unit) Forecast, by Application 2019 & 2032
- Table 79: Ecuador MEA Portable X-Ray Devices Industry Revenue (Million) Forecast, by Application 2019 & 2032
- Table 80: Ecuador MEA Portable X-Ray Devices Industry Volume (K Unit) Forecast, by Application 2019 & 2032
- Table 81: Venezuela MEA Portable X-Ray Devices Industry Revenue (Million) Forecast, by Application 2019 & 2032
- Table 82: Venezuela MEA Portable X-Ray Devices Industry Volume (K Unit) Forecast, by Application 2019 & 2032
- Table 83: Rest of South America MEA Portable X-Ray Devices Industry Revenue (Million) Forecast, by Application 2019 & 2032
- Table 84: Rest of South America MEA Portable X-Ray Devices Industry Volume (K Unit) Forecast, by Application 2019 & 2032
- Table 85: Global MEA Portable X-Ray Devices Industry Revenue Million Forecast, by Country 2019 & 2032
- Table 86: Global MEA Portable X-Ray Devices Industry Volume K Unit Forecast, by Country 2019 & 2032
- Table 87: United Arab Emirates MEA Portable X-Ray Devices Industry Revenue (Million) Forecast, by Application 2019 & 2032
- Table 88: United Arab Emirates MEA Portable X-Ray Devices Industry Volume (K Unit) Forecast, by Application 2019 & 2032
- Table 89: Saudi Arabia MEA Portable X-Ray Devices Industry Revenue (Million) Forecast, by Application 2019 & 2032
- Table 90: Saudi Arabia MEA Portable X-Ray Devices Industry Volume (K Unit) Forecast, by Application 2019 & 2032
- Table 91: South Africa MEA Portable X-Ray Devices Industry Revenue (Million) Forecast, by Application 2019 & 2032
- Table 92: South Africa MEA Portable X-Ray Devices Industry Volume (K Unit) Forecast, by Application 2019 & 2032
- Table 93: Rest of Middle East and Africa MEA Portable X-Ray Devices Industry Revenue (Million) Forecast, by Application 2019 & 2032
- Table 94: Rest of Middle East and Africa MEA Portable X-Ray Devices Industry Volume (K Unit) Forecast, by Application 2019 & 2032
- Table 95: Global MEA Portable X-Ray Devices Industry Revenue Million Forecast, by Technology 2019 & 2032
- Table 96: Global MEA Portable X-Ray Devices Industry Volume K Unit Forecast, by Technology 2019 & 2032
- Table 97: Global MEA Portable X-Ray Devices Industry Revenue Million Forecast, by Application 2019 & 2032
- Table 98: Global MEA Portable X-Ray Devices Industry Volume K Unit Forecast, by Application 2019 & 2032
- Table 99: Global MEA Portable X-Ray Devices Industry Revenue Million Forecast, by Modality 2019 & 2032
- Table 100: Global MEA Portable X-Ray Devices Industry Volume K Unit Forecast, by Modality 2019 & 2032
- Table 101: Global MEA Portable X-Ray Devices Industry Revenue Million Forecast, by Geography 2019 & 2032
- Table 102: Global MEA Portable X-Ray Devices Industry Volume K Unit Forecast, by Geography 2019 & 2032
- Table 103: Global MEA Portable X-Ray Devices Industry Revenue Million Forecast, by Country 2019 & 2032
- Table 104: Global MEA Portable X-Ray Devices Industry Volume K Unit Forecast, by Country 2019 & 2032
- Table 105: Global MEA Portable X-Ray Devices Industry Revenue Million Forecast, by Technology 2019 & 2032
- Table 106: Global MEA Portable X-Ray Devices Industry Volume K Unit Forecast, by Technology 2019 & 2032
- Table 107: Global MEA Portable X-Ray Devices Industry Revenue Million Forecast, by Application 2019 & 2032
- Table 108: Global MEA Portable X-Ray Devices Industry Volume K Unit Forecast, by Application 2019 & 2032
- Table 109: Global MEA Portable X-Ray Devices Industry Revenue Million Forecast, by Modality 2019 & 2032
- Table 110: Global MEA Portable X-Ray Devices Industry Volume K Unit Forecast, by Modality 2019 & 2032
- Table 111: Global MEA Portable X-Ray Devices Industry Revenue Million Forecast, by Geography 2019 & 2032
- Table 112: Global MEA Portable X-Ray Devices Industry Volume K Unit Forecast, by Geography 2019 & 2032
- Table 113: Global MEA Portable X-Ray Devices Industry Revenue Million Forecast, by Country 2019 & 2032
- Table 114: Global MEA Portable X-Ray Devices Industry Volume K Unit Forecast, by Country 2019 & 2032
- Table 115: Global MEA Portable X-Ray Devices Industry Revenue Million Forecast, by Technology 2019 & 2032
- Table 116: Global MEA Portable X-Ray Devices Industry Volume K Unit Forecast, by Technology 2019 & 2032
- Table 117: Global MEA Portable X-Ray Devices Industry Revenue Million Forecast, by Application 2019 & 2032
- Table 118: Global MEA Portable X-Ray Devices Industry Volume K Unit Forecast, by Application 2019 & 2032
- Table 119: Global MEA Portable X-Ray Devices Industry Revenue Million Forecast, by Modality 2019 & 2032
- Table 120: Global MEA Portable X-Ray Devices Industry Volume K Unit Forecast, by Modality 2019 & 2032
- Table 121: Global MEA Portable X-Ray Devices Industry Revenue Million Forecast, by Geography 2019 & 2032
- Table 122: Global MEA Portable X-Ray Devices Industry Volume K Unit Forecast, by Geography 2019 & 2032
- Table 123: Global MEA Portable X-Ray Devices Industry Revenue Million Forecast, by Country 2019 & 2032
- Table 124: Global MEA Portable X-Ray Devices Industry Volume K Unit Forecast, by Country 2019 & 2032
Frequently Asked Questions
1. What is the projected Compound Annual Growth Rate (CAGR) of the MEA Portable X-Ray Devices Industry?
The projected CAGR is approximately 7.67%.
2. Which companies are prominent players in the MEA Portable X-Ray Devices Industry?
Key companies in the market include Siemens Healthineers, Ziehm Imaging GmbH, KaVo Dental, Fujifilm Corporation, Carestream Health, General Electric Company (GE Healthcare), Koninklijke Philips NV, Canon Medical Systems, Shimadzu Corporations.
3. What are the main segments of the MEA Portable X-Ray Devices Industry?
The market segments include Technology, Application, Modality, Geography.
4. Can you provide details about the market size?
The market size is estimated to be USD 321.39 Million as of 2022.
5. What are some drivers contributing to market growth?
Technological Advancements and Rise in Awareness Regarding Portable Devices; Increase in Geriatric Population with Mobility Issues.
6. What are the notable trends driving market growth?
Digital X-ray is Expected to Hold a Significant Share of the Market During the Forecasted Period.
7. Are there any restraints impacting market growth?
High Risk of Radiation Exposure.
8. Can you provide examples of recent developments in the market?
In January 2023, LG demonstrated its new medical monitors and digital x-ray detectors, offering improved diagnostic accuracy and transforming patient care at Arab Health 2023.
9. What pricing options are available for accessing the report?
Pricing options include single-user, multi-user, and enterprise licenses priced at USD 4750, USD 5250, and USD 8750 respectively.
10. Is the market size provided in terms of value or volume?
The market size is provided in terms of value, measured in Million and volume, measured in K Unit.
11. Are there any specific market keywords associated with the report?
Yes, the market keyword associated with the report is "MEA Portable X-Ray Devices Industry," which aids in identifying and referencing the specific market segment covered.
12. How do I determine which pricing option suits my needs best?
The pricing options vary based on user requirements and access needs. Individual users may opt for single-user licenses, while businesses requiring broader access may choose multi-user or enterprise licenses for cost-effective access to the report.
13. Are there any additional resources or data provided in the MEA Portable X-Ray Devices Industry report?
While the report offers comprehensive insights, it's advisable to review the specific contents or supplementary materials provided to ascertain if additional resources or data are available.
14. How can I stay updated on further developments or reports in the MEA Portable X-Ray Devices Industry?
To stay informed about further developments, trends, and reports in the MEA Portable X-Ray Devices Industry, consider subscribing to industry newsletters, following relevant companies and organizations, or regularly checking reputable industry news sources and publications.
Methodology
Step 1 - Identification of Relevant Samples Size from Population Database


Step 2 - Approaches for Defining Global Market Size (Value, Volume* & Price*)

Note*: In applicable scenarios
Step 3 - Data Sources
Primary Research
- Web Analytics
- Survey Reports
- Research Institute
- Latest Research Reports
- Opinion Leaders
Secondary Research
- Annual Reports
- White Paper
- Latest Press Release
- Industry Association
- Paid Database
- Investor Presentations

Step 4 - Data Triangulation
Involves using different sources of information in order to increase the validity of a study
These sources are likely to be stakeholders in a program - participants, other researchers, program staff, other community members, and so on.
Then we put all data in single framework & apply various statistical tools to find out the dynamic on the market.
During the analysis stage, feedback from the stakeholder groups would be compared to determine areas of agreement as well as areas of divergence


