
Key Insights
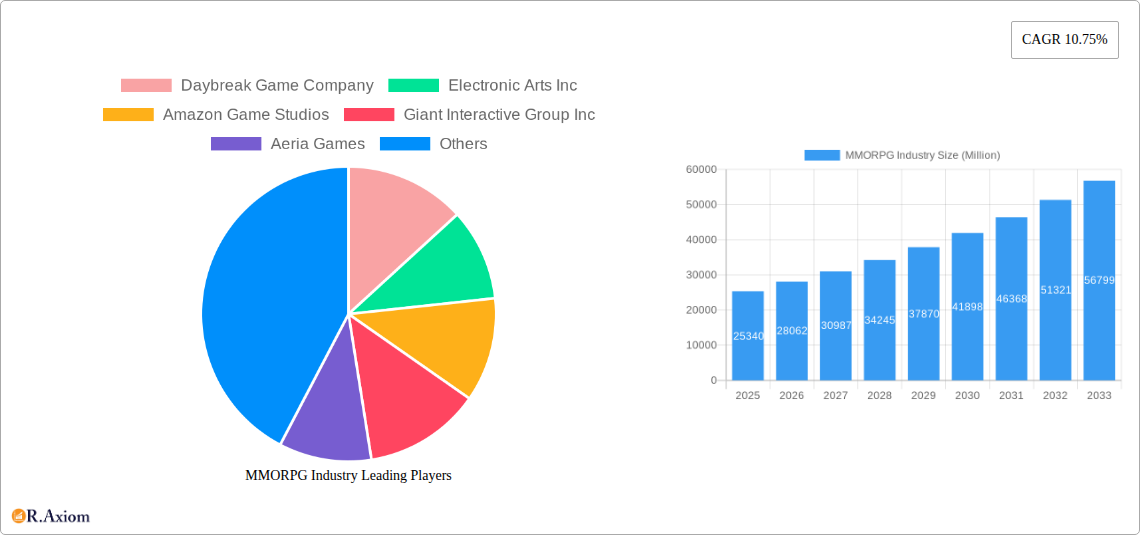
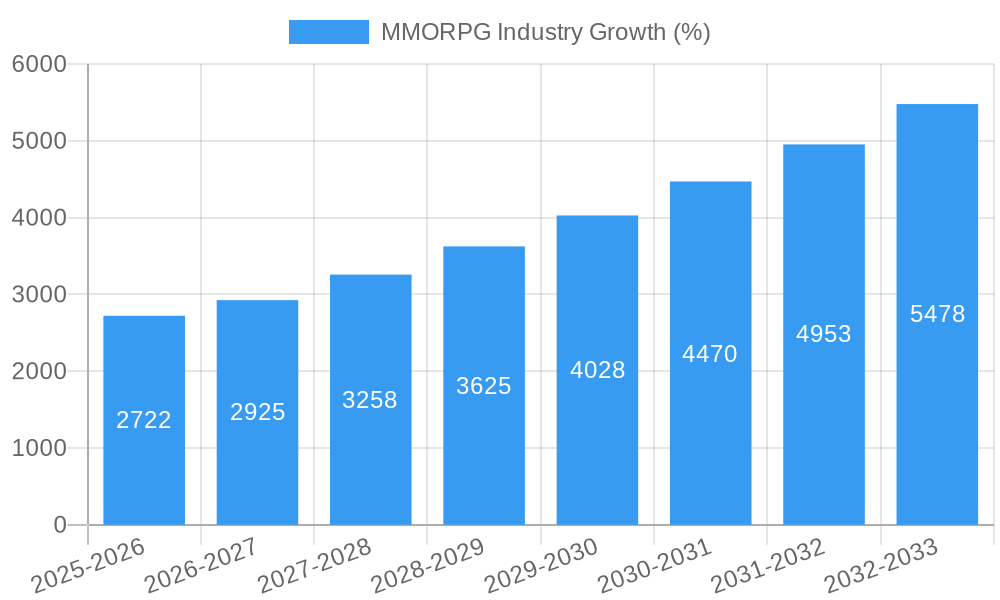
The MMORPG (Massively Multiplayer Online Role-Playing Game) industry, valued at $25.34 billion in 2025, is experiencing robust growth, projected to expand at a Compound Annual Growth Rate (CAGR) of 10.75% from 2025 to 2033. This expansion is driven by several key factors. Firstly, the increasing affordability and accessibility of high-speed internet globally are fueling broader participation. Secondly, continuous technological advancements, including improved graphics, virtual reality (VR) integration, and enhanced game mechanics, are significantly enhancing the player experience and attracting new audiences. Furthermore, the rise of mobile gaming and the development of cross-platform compatibility are expanding the market reach, making MMORPGs accessible on a wider range of devices. Finally, the ongoing evolution of game monetization strategies, such as in-game purchases and subscription models, contribute to the industry's overall revenue growth. Competition among established giants like Tencent, Activision Blizzard, and NetEase, alongside innovative independent developers, ensures a dynamic and evolving market landscape.
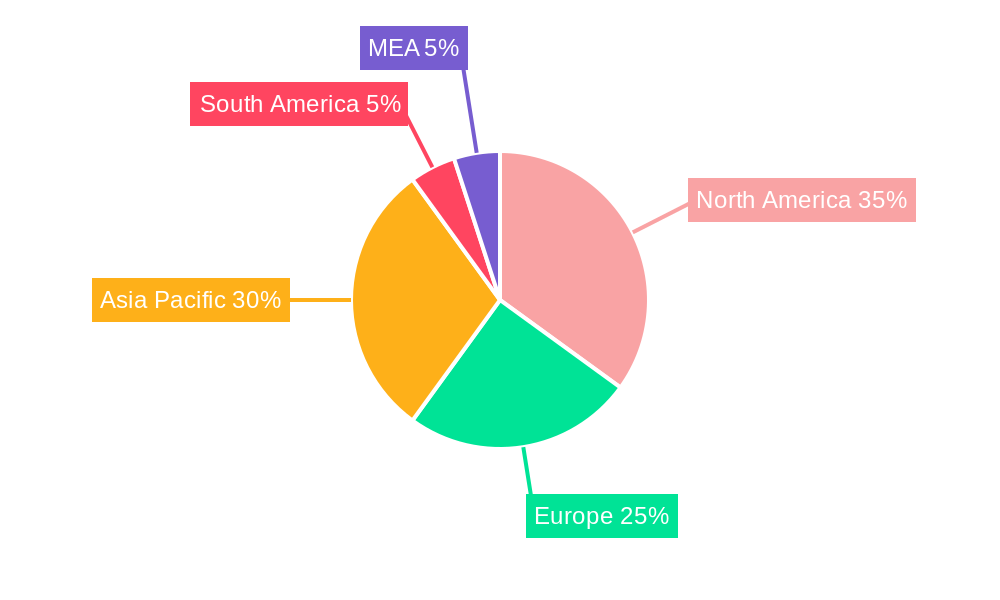
However, the industry also faces certain challenges. Maintaining player engagement over extended periods requires constant content updates and community management. The increasing saturation of the market necessitates consistent innovation to differentiate products and attract players. Furthermore, concerns regarding game addiction and the potential for negative social impacts require careful consideration and responsible game design practices. Despite these challenges, the long-term growth prospects for the MMORPG market remain positive, driven by continued technological progress, evolving gameplay experiences, and the enduring appeal of this immersive game genre. The diverse regional markets, with strong performances anticipated in Asia-Pacific and North America, further contribute to the industry's overall expansion potential. Geographical expansion into emerging markets presents significant opportunities for continued growth.
MMORPG Industry: A Comprehensive Market Analysis (2019-2033)
This in-depth report provides a comprehensive analysis of the Massively Multiplayer Online Role-Playing Game (MMORPG) industry, encompassing market size, growth projections, key players, technological advancements, and future opportunities. The study period covers 2019-2033, with 2025 as the base and estimated year. The forecast period is 2025-2033, and the historical period is 2019-2024. Expect detailed insights into market concentration, innovation, dominant segments, and key industry developments, all supported by robust data and analysis. This report is invaluable for industry stakeholders, investors, and anyone seeking a comprehensive understanding of the MMORPG market landscape. Projected market values are presented in Millions.
MMORPG Industry Market Concentration & Innovation
The MMORPG market exhibits a high degree of concentration, with a handful of major players commanding significant market share. However, a dynamic competitive landscape fosters continuous innovation. The market is characterized by a few dominant players like Tencent Holdings Limited and NetEase Games Inc, holding significant market share (estimated at xx% and xx%, respectively, in 2025). Several mergers and acquisitions (M&A) activities further shape the industry landscape, contributing to market consolidation and the emergence of new players. For instance, the xx Million M&A deal between (example hypothetical deal) resulted in a significant shift in market dynamics.
- Market Share: Tencent Holdings Limited (xx%), NetEase Games Inc (xx%), Activision Blizzard Inc (xx%), NCSOFT Corporation (xx%), Others (xx%).
- Innovation Drivers: Technological advancements (e.g., improved graphics, virtual reality integration, Web3 technologies), evolving consumer preferences (e.g., demand for engaging storylines, social features), and regulatory frameworks are major innovation drivers.
- Regulatory Frameworks: Varying regulatory environments across different countries impact market access and operational costs, influencing industry strategies and growth trajectory.
- Product Substitutes: Other gaming genres (e.g., battle royale, MOBA) pose competitive pressure, demanding continuous innovation to maintain market relevance.
- End-User Trends: Increasing demand for mobile MMORPGs, the rise of esports, and the growing popularity of metaverse-related experiences are shaping consumer preferences.
- M&A Activities: Large-scale acquisitions and strategic partnerships are common, resulting in market consolidation and the emergence of new competitive forces (Total M&A value in 2024 estimated at xx Million).
MMORPG Industry Industry Trends & Insights
The MMORPG industry is witnessing robust growth, driven by several factors. The Compound Annual Growth Rate (CAGR) is projected to be xx% during the forecast period (2025-2033), with the market size estimated at xx Million in 2025. Mobile MMORPGs are experiencing particularly rapid growth, owing to increased smartphone penetration and wider accessibility. The market penetration of mobile MMORPGs in key regions like Asia is substantial, exceeding xx% in 2024. Technological disruptions, such as the integration of blockchain technology and the metaverse concept, are also contributing to market expansion. Consumer preferences for immersive experiences, engaging narratives, and social interactions within the game drive ongoing demand. Increased competition is forcing continuous product innovation and improved game features.
Dominant Markets & Segments in MMORPG Industry
The Asia-Pacific region remains the dominant market for MMORPGs. China and South Korea are particularly strong markets due to high internet and mobile penetration, a strong gaming culture, and supportive government policies.
- Key Drivers for Asia-Pacific Dominance:
- High Smartphone Penetration: Extensive mobile infrastructure facilitates easy access to mobile MMORPGs.
- Strong Gaming Culture: A deep-rooted appreciation for gaming fosters a large and active player base.
- Government Support: Favorable regulations and policies encourage the growth of the gaming industry.
- Established Ecosystem: Robust infrastructure and a supportive industry ecosystem facilitate game development and distribution.
The Mobile segment holds the largest market share, surpassing the PC and console segments in terms of revenue and user base. Tablet gaming also contributes significantly to the overall market size. The rapid expansion of mobile gaming stems from increased smartphone adoption, convenient accessibility, and innovative mobile-optimized game designs.
MMORPG Industry Product Developments
Recent years have witnessed significant advancements in MMORPG game design, incorporating innovative features such as improved graphics, virtual reality (VR) and augmented reality (AR) integration, and cross-platform compatibility. These technological trends cater to evolving consumer preferences and competition. The integration of Web3 technologies, such as NFTs and blockchain, is emerging as a transformative force, although its long-term impact is still developing. The integration of blockchain has the potential to disrupt the gaming industry, opening new avenues for monetization and player engagement.
Report Scope & Segmentation Analysis
This report segments the MMORPG market based on gaming platform:
- Mobile: The mobile segment shows the highest growth potential, with a projected CAGR of xx% during the forecast period, driven by increasing smartphone penetration and convenient accessibility. Market size in 2025 is estimated at xx Million. Competition is intense, requiring continuous innovation to attract and retain players.
- Tablet: The tablet segment is a smaller but significant contributor to the overall market, characterized by a moderate growth rate (xx% CAGR) and a market size of xx Million in 2025. Its user base is slightly overlapping with that of mobile gamers.
- Gaming Console: This segment exhibits a stable growth rate (xx% CAGR) with a market size of xx Million in 2025. Strong brand loyalty and console-specific features maintain its place in the market.
- PC: The PC segment remains a substantial part of the market, maintaining a steady growth trajectory (xx% CAGR). The market size is estimated at xx Million in 2025. The segment remains popular due to superior graphics and gameplay experience.
Key Drivers of MMORPG Industry Growth
Several factors contribute to the sustained growth of the MMORPG industry. Technological advancements such as improved graphics engines and virtual reality integration enhance the gaming experience. The increasing affordability of gaming hardware and widespread internet access expands the player base. Favorable regulatory environments in some regions stimulate market expansion. Lastly, the evolution of gaming models, such as free-to-play and subscription models, caters to a broader range of players.
Challenges in the MMORPG Industry Sector
The MMORPG industry faces various challenges. Intense competition necessitates continuous innovation to maintain market relevance. Regulatory hurdles in some regions can hinder market entry and growth. The high cost of game development presents a considerable barrier to entry for smaller studios. Supply chain issues, such as component shortages, may affect game production and release timelines.
Emerging Opportunities in MMORPG Industry
The integration of Web3 technologies like blockchain and NFTs presents significant opportunities for enhanced user engagement and revenue generation. Expanding into new markets in developing economies with high growth potential offers lucrative prospects. Innovative game designs incorporating virtual reality and augmented reality technologies can further transform the player experience. The metaverse concept presents a new frontier for immersive MMORPG experiences.
Leading Players in the MMORPG Industry Market
- Daybreak Game Company
- Electronic Arts Inc
- Amazon Game Studios
- Giant Interactive Group Inc
- Aeria Games
- CCP games UK Ltd
- NCSOFT Corporation
- Activision Blizzard Inc
- Neteasegames Inc
- Tencent Holdings Limited
- Bright Star Studios
- Ubisoft Entertainment SA
- Jagex Limited
- Gravity Corporatio
- Nexon Co Ltd
Key Developments in MMORPG Industry Industry
- May 2022: Gravity Co Ltd launched 'Ragnarok V: Returns,' a 3D MMORPG with cross-play functionality on iOS, Android, and PC, expanding its multi-platform reach. This signifies a strategic move towards broader accessibility and market penetration.
- June 2022: Clockwork Labs secured USD 22 Million in funding for BitCraft, highlighting investor confidence in community-focused sandbox MMORPGs and their potential for future growth. This signifies a significant investment in innovative gameplay models.
- September 2022: The global release of Dekaron G, a mobile MMORPG, by ThumbAge expands the reach of a successful PC MMORPG franchise into the mobile market, highlighting the growing importance of mobile platforms. This demonstrates the successful adaptation of classic MMORPGs for new platforms.
- January 2023: The launch of Search for Animera on ImmutableX leverages Web3 technologies, introducing new possibilities for in-game transactions, asset ownership, and player engagement. This signifies an early adoption of blockchain technology in the MMORPG space.
Strategic Outlook for MMORPG Industry Market
The MMORPG market is poised for continued growth, driven by technological innovation, expanding player bases in emerging markets, and the integration of novel gameplay features. The metaverse concept and Web3 technologies are emerging as key drivers of future market expansion, creating new avenues for immersive experiences and user-generated content. Companies strategically focusing on mobile platforms and integrating advanced technologies are well-positioned to capitalize on future growth opportunities.
MMORPG Industry Segmentation
-
1. Gaming Platform
- 1.1. Mobile
- 1.2. Tablet
- 1.3. Gaming Console
- 1.4. PC
MMORPG Industry Segmentation By Geography
-
1. North America
- 1.1. United States
- 1.2. Canada
-
2. Europe
- 2.1. United Kingdom
- 2.2. Germany
- 2.3. France
- 2.4. Italy
- 2.5. Russia
-
3. Asia
- 3.1. China
- 3.2. India
- 3.3. Japan
- 3.4. South Korea
- 4. Australia and New Zealand
-
5. Latin America
- 5.1. Brazil
- 5.2. Mexico
- 5.3. Argentina
-
6. Middle East and Africa
- 6.1. United Arab Emirates
- 6.2. Saudi Arabia
- 6.3. South Africa
MMORPG Industry REPORT HIGHLIGHTS
| Aspects | Details |
|---|---|
| Study Period | 2019-2033 |
| Base Year | 2024 |
| Estimated Year | 2025 |
| Forecast Period | 2025-2033 |
| Historical Period | 2019-2024 |
| Growth Rate | CAGR of 10.75% from 2019-2033 |
| Segmentation |
|
Table of Contents
- 1. Introduction
- 1.1. Research Scope
- 1.2. Market Segmentation
- 1.3. Research Methodology
- 1.4. Definitions and Assumptions
- 2. Executive Summary
- 2.1. Introduction
- 3. Market Dynamics
- 3.1. Introduction
- 3.2. Market Drivers
- 3.2.1 Rising Smartphone Penetration and Increasing Penetration of Internet among Developing Economies; Technological Advancement such as IoT
- 3.2.2 AR
- 3.2.3 and VR; Emergence of Gamification
- 3.3. Market Restrains
- 3.3.1 Costs
- 3.3.2 Interoperability
- 3.3.3 and Security Concerns
- 3.4. Market Trends
- 3.4.1. Rising Smartphone Penetration and Increasing Penetration of Internet among Developing Economies may Drive the Market Growth
- 4. Market Factor Analysis
- 4.1. Porters Five Forces
- 4.2. Supply/Value Chain
- 4.3. PESTEL analysis
- 4.4. Market Entropy
- 4.5. Patent/Trademark Analysis
- 5. Global MMORPG Industry Analysis, Insights and Forecast, 2019-2031
- 5.1. Market Analysis, Insights and Forecast - by Gaming Platform
- 5.1.1. Mobile
- 5.1.2. Tablet
- 5.1.3. Gaming Console
- 5.1.4. PC
- 5.2. Market Analysis, Insights and Forecast - by Region
- 5.2.1. North America
- 5.2.2. Europe
- 5.2.3. Asia
- 5.2.4. Australia and New Zealand
- 5.2.5. Latin America
- 5.2.6. Middle East and Africa
- 5.1. Market Analysis, Insights and Forecast - by Gaming Platform
- 6. North America MMORPG Industry Analysis, Insights and Forecast, 2019-2031
- 6.1. Market Analysis, Insights and Forecast - by Gaming Platform
- 6.1.1. Mobile
- 6.1.2. Tablet
- 6.1.3. Gaming Console
- 6.1.4. PC
- 6.1. Market Analysis, Insights and Forecast - by Gaming Platform
- 7. Europe MMORPG Industry Analysis, Insights and Forecast, 2019-2031
- 7.1. Market Analysis, Insights and Forecast - by Gaming Platform
- 7.1.1. Mobile
- 7.1.2. Tablet
- 7.1.3. Gaming Console
- 7.1.4. PC
- 7.1. Market Analysis, Insights and Forecast - by Gaming Platform
- 8. Asia MMORPG Industry Analysis, Insights and Forecast, 2019-2031
- 8.1. Market Analysis, Insights and Forecast - by Gaming Platform
- 8.1.1. Mobile
- 8.1.2. Tablet
- 8.1.3. Gaming Console
- 8.1.4. PC
- 8.1. Market Analysis, Insights and Forecast - by Gaming Platform
- 9. Australia and New Zealand MMORPG Industry Analysis, Insights and Forecast, 2019-2031
- 9.1. Market Analysis, Insights and Forecast - by Gaming Platform
- 9.1.1. Mobile
- 9.1.2. Tablet
- 9.1.3. Gaming Console
- 9.1.4. PC
- 9.1. Market Analysis, Insights and Forecast - by Gaming Platform
- 10. Latin America MMORPG Industry Analysis, Insights and Forecast, 2019-2031
- 10.1. Market Analysis, Insights and Forecast - by Gaming Platform
- 10.1.1. Mobile
- 10.1.2. Tablet
- 10.1.3. Gaming Console
- 10.1.4. PC
- 10.1. Market Analysis, Insights and Forecast - by Gaming Platform
- 11. Middle East and Africa MMORPG Industry Analysis, Insights and Forecast, 2019-2031
- 11.1. Market Analysis, Insights and Forecast - by Gaming Platform
- 11.1.1. Mobile
- 11.1.2. Tablet
- 11.1.3. Gaming Console
- 11.1.4. PC
- 11.1. Market Analysis, Insights and Forecast - by Gaming Platform
- 12. North America MMORPG Industry Analysis, Insights and Forecast, 2019-2031
- 12.1. Market Analysis, Insights and Forecast - By Country/Sub-region
- 12.1.1 United States
- 12.1.2 Canada
- 12.1.3 Mexico
- 13. Europe MMORPG Industry Analysis, Insights and Forecast, 2019-2031
- 13.1. Market Analysis, Insights and Forecast - By Country/Sub-region
- 13.1.1 Germany
- 13.1.2 United Kingdom
- 13.1.3 France
- 13.1.4 Spain
- 13.1.5 Italy
- 13.1.6 Spain
- 13.1.7 Belgium
- 13.1.8 Netherland
- 13.1.9 Nordics
- 13.1.10 Rest of Europe
- 14. Asia Pacific MMORPG Industry Analysis, Insights and Forecast, 2019-2031
- 14.1. Market Analysis, Insights and Forecast - By Country/Sub-region
- 14.1.1 China
- 14.1.2 Japan
- 14.1.3 India
- 14.1.4 South Korea
- 14.1.5 Southeast Asia
- 14.1.6 Australia
- 14.1.7 Indonesia
- 14.1.8 Phillipes
- 14.1.9 Singapore
- 14.1.10 Thailandc
- 14.1.11 Rest of Asia Pacific
- 15. South America MMORPG Industry Analysis, Insights and Forecast, 2019-2031
- 15.1. Market Analysis, Insights and Forecast - By Country/Sub-region
- 15.1.1 Brazil
- 15.1.2 Argentina
- 15.1.3 Peru
- 15.1.4 Chile
- 15.1.5 Colombia
- 15.1.6 Ecuador
- 15.1.7 Venezuela
- 15.1.8 Rest of South America
- 16. MEA MMORPG Industry Analysis, Insights and Forecast, 2019-2031
- 16.1. Market Analysis, Insights and Forecast - By Country/Sub-region
- 16.1.1 United Arab Emirates
- 16.1.2 Saudi Arabia
- 16.1.3 South Africa
- 16.1.4 Rest of Middle East and Africa
- 17. Competitive Analysis
- 17.1. Global Market Share Analysis 2024
- 17.2. Company Profiles
- 17.2.1 Daybreak Game Company
- 17.2.1.1. Overview
- 17.2.1.2. Products
- 17.2.1.3. SWOT Analysis
- 17.2.1.4. Recent Developments
- 17.2.1.5. Financials (Based on Availability)
- 17.2.2 Electronic Arts Inc
- 17.2.2.1. Overview
- 17.2.2.2. Products
- 17.2.2.3. SWOT Analysis
- 17.2.2.4. Recent Developments
- 17.2.2.5. Financials (Based on Availability)
- 17.2.3 Amazon Game Studios
- 17.2.3.1. Overview
- 17.2.3.2. Products
- 17.2.3.3. SWOT Analysis
- 17.2.3.4. Recent Developments
- 17.2.3.5. Financials (Based on Availability)
- 17.2.4 Giant Interactive Group Inc
- 17.2.4.1. Overview
- 17.2.4.2. Products
- 17.2.4.3. SWOT Analysis
- 17.2.4.4. Recent Developments
- 17.2.4.5. Financials (Based on Availability)
- 17.2.5 Aeria Games
- 17.2.5.1. Overview
- 17.2.5.2. Products
- 17.2.5.3. SWOT Analysis
- 17.2.5.4. Recent Developments
- 17.2.5.5. Financials (Based on Availability)
- 17.2.6 CCP games UK Ltd
- 17.2.6.1. Overview
- 17.2.6.2. Products
- 17.2.6.3. SWOT Analysis
- 17.2.6.4. Recent Developments
- 17.2.6.5. Financials (Based on Availability)
- 17.2.7 NCSOFT Corporation
- 17.2.7.1. Overview
- 17.2.7.2. Products
- 17.2.7.3. SWOT Analysis
- 17.2.7.4. Recent Developments
- 17.2.7.5. Financials (Based on Availability)
- 17.2.8 Activision Blizzard Inc
- 17.2.8.1. Overview
- 17.2.8.2. Products
- 17.2.8.3. SWOT Analysis
- 17.2.8.4. Recent Developments
- 17.2.8.5. Financials (Based on Availability)
- 17.2.9 Neteasegames Inc
- 17.2.9.1. Overview
- 17.2.9.2. Products
- 17.2.9.3. SWOT Analysis
- 17.2.9.4. Recent Developments
- 17.2.9.5. Financials (Based on Availability)
- 17.2.10 Tencent Holdings Limited
- 17.2.10.1. Overview
- 17.2.10.2. Products
- 17.2.10.3. SWOT Analysis
- 17.2.10.4. Recent Developments
- 17.2.10.5. Financials (Based on Availability)
- 17.2.11 Bright Star Studios
- 17.2.11.1. Overview
- 17.2.11.2. Products
- 17.2.11.3. SWOT Analysis
- 17.2.11.4. Recent Developments
- 17.2.11.5. Financials (Based on Availability)
- 17.2.12 Ubisoft Entertainment SA
- 17.2.12.1. Overview
- 17.2.12.2. Products
- 17.2.12.3. SWOT Analysis
- 17.2.12.4. Recent Developments
- 17.2.12.5. Financials (Based on Availability)
- 17.2.13 Jagex Limited
- 17.2.13.1. Overview
- 17.2.13.2. Products
- 17.2.13.3. SWOT Analysis
- 17.2.13.4. Recent Developments
- 17.2.13.5. Financials (Based on Availability)
- 17.2.14 Gravity Corporatio
- 17.2.14.1. Overview
- 17.2.14.2. Products
- 17.2.14.3. SWOT Analysis
- 17.2.14.4. Recent Developments
- 17.2.14.5. Financials (Based on Availability)
- 17.2.15 Nexon Co Ltd
- 17.2.15.1. Overview
- 17.2.15.2. Products
- 17.2.15.3. SWOT Analysis
- 17.2.15.4. Recent Developments
- 17.2.15.5. Financials (Based on Availability)
- 17.2.1 Daybreak Game Company
List of Figures
- Figure 1: Global MMORPG Industry Revenue Breakdown (Million, %) by Region 2024 & 2032
- Figure 2: North America MMORPG Industry Revenue (Million), by Country 2024 & 2032
- Figure 3: North America MMORPG Industry Revenue Share (%), by Country 2024 & 2032
- Figure 4: Europe MMORPG Industry Revenue (Million), by Country 2024 & 2032
- Figure 5: Europe MMORPG Industry Revenue Share (%), by Country 2024 & 2032
- Figure 6: Asia Pacific MMORPG Industry Revenue (Million), by Country 2024 & 2032
- Figure 7: Asia Pacific MMORPG Industry Revenue Share (%), by Country 2024 & 2032
- Figure 8: South America MMORPG Industry Revenue (Million), by Country 2024 & 2032
- Figure 9: South America MMORPG Industry Revenue Share (%), by Country 2024 & 2032
- Figure 10: MEA MMORPG Industry Revenue (Million), by Country 2024 & 2032
- Figure 11: MEA MMORPG Industry Revenue Share (%), by Country 2024 & 2032
- Figure 12: North America MMORPG Industry Revenue (Million), by Gaming Platform 2024 & 2032
- Figure 13: North America MMORPG Industry Revenue Share (%), by Gaming Platform 2024 & 2032
- Figure 14: North America MMORPG Industry Revenue (Million), by Country 2024 & 2032
- Figure 15: North America MMORPG Industry Revenue Share (%), by Country 2024 & 2032
- Figure 16: Europe MMORPG Industry Revenue (Million), by Gaming Platform 2024 & 2032
- Figure 17: Europe MMORPG Industry Revenue Share (%), by Gaming Platform 2024 & 2032
- Figure 18: Europe MMORPG Industry Revenue (Million), by Country 2024 & 2032
- Figure 19: Europe MMORPG Industry Revenue Share (%), by Country 2024 & 2032
- Figure 20: Asia MMORPG Industry Revenue (Million), by Gaming Platform 2024 & 2032
- Figure 21: Asia MMORPG Industry Revenue Share (%), by Gaming Platform 2024 & 2032
- Figure 22: Asia MMORPG Industry Revenue (Million), by Country 2024 & 2032
- Figure 23: Asia MMORPG Industry Revenue Share (%), by Country 2024 & 2032
- Figure 24: Australia and New Zealand MMORPG Industry Revenue (Million), by Gaming Platform 2024 & 2032
- Figure 25: Australia and New Zealand MMORPG Industry Revenue Share (%), by Gaming Platform 2024 & 2032
- Figure 26: Australia and New Zealand MMORPG Industry Revenue (Million), by Country 2024 & 2032
- Figure 27: Australia and New Zealand MMORPG Industry Revenue Share (%), by Country 2024 & 2032
- Figure 28: Latin America MMORPG Industry Revenue (Million), by Gaming Platform 2024 & 2032
- Figure 29: Latin America MMORPG Industry Revenue Share (%), by Gaming Platform 2024 & 2032
- Figure 30: Latin America MMORPG Industry Revenue (Million), by Country 2024 & 2032
- Figure 31: Latin America MMORPG Industry Revenue Share (%), by Country 2024 & 2032
- Figure 32: Middle East and Africa MMORPG Industry Revenue (Million), by Gaming Platform 2024 & 2032
- Figure 33: Middle East and Africa MMORPG Industry Revenue Share (%), by Gaming Platform 2024 & 2032
- Figure 34: Middle East and Africa MMORPG Industry Revenue (Million), by Country 2024 & 2032
- Figure 35: Middle East and Africa MMORPG Industry Revenue Share (%), by Country 2024 & 2032
List of Tables
- Table 1: Global MMORPG Industry Revenue Million Forecast, by Region 2019 & 2032
- Table 2: Global MMORPG Industry Revenue Million Forecast, by Gaming Platform 2019 & 2032
- Table 3: Global MMORPG Industry Revenue Million Forecast, by Region 2019 & 2032
- Table 4: Global MMORPG Industry Revenue Million Forecast, by Country 2019 & 2032
- Table 5: United States MMORPG Industry Revenue (Million) Forecast, by Application 2019 & 2032
- Table 6: Canada MMORPG Industry Revenue (Million) Forecast, by Application 2019 & 2032
- Table 7: Mexico MMORPG Industry Revenue (Million) Forecast, by Application 2019 & 2032
- Table 8: Global MMORPG Industry Revenue Million Forecast, by Country 2019 & 2032
- Table 9: Germany MMORPG Industry Revenue (Million) Forecast, by Application 2019 & 2032
- Table 10: United Kingdom MMORPG Industry Revenue (Million) Forecast, by Application 2019 & 2032
- Table 11: France MMORPG Industry Revenue (Million) Forecast, by Application 2019 & 2032
- Table 12: Spain MMORPG Industry Revenue (Million) Forecast, by Application 2019 & 2032
- Table 13: Italy MMORPG Industry Revenue (Million) Forecast, by Application 2019 & 2032
- Table 14: Spain MMORPG Industry Revenue (Million) Forecast, by Application 2019 & 2032
- Table 15: Belgium MMORPG Industry Revenue (Million) Forecast, by Application 2019 & 2032
- Table 16: Netherland MMORPG Industry Revenue (Million) Forecast, by Application 2019 & 2032
- Table 17: Nordics MMORPG Industry Revenue (Million) Forecast, by Application 2019 & 2032
- Table 18: Rest of Europe MMORPG Industry Revenue (Million) Forecast, by Application 2019 & 2032
- Table 19: Global MMORPG Industry Revenue Million Forecast, by Country 2019 & 2032
- Table 20: China MMORPG Industry Revenue (Million) Forecast, by Application 2019 & 2032
- Table 21: Japan MMORPG Industry Revenue (Million) Forecast, by Application 2019 & 2032
- Table 22: India MMORPG Industry Revenue (Million) Forecast, by Application 2019 & 2032
- Table 23: South Korea MMORPG Industry Revenue (Million) Forecast, by Application 2019 & 2032
- Table 24: Southeast Asia MMORPG Industry Revenue (Million) Forecast, by Application 2019 & 2032
- Table 25: Australia MMORPG Industry Revenue (Million) Forecast, by Application 2019 & 2032
- Table 26: Indonesia MMORPG Industry Revenue (Million) Forecast, by Application 2019 & 2032
- Table 27: Phillipes MMORPG Industry Revenue (Million) Forecast, by Application 2019 & 2032
- Table 28: Singapore MMORPG Industry Revenue (Million) Forecast, by Application 2019 & 2032
- Table 29: Thailandc MMORPG Industry Revenue (Million) Forecast, by Application 2019 & 2032
- Table 30: Rest of Asia Pacific MMORPG Industry Revenue (Million) Forecast, by Application 2019 & 2032
- Table 31: Global MMORPG Industry Revenue Million Forecast, by Country 2019 & 2032
- Table 32: Brazil MMORPG Industry Revenue (Million) Forecast, by Application 2019 & 2032
- Table 33: Argentina MMORPG Industry Revenue (Million) Forecast, by Application 2019 & 2032
- Table 34: Peru MMORPG Industry Revenue (Million) Forecast, by Application 2019 & 2032
- Table 35: Chile MMORPG Industry Revenue (Million) Forecast, by Application 2019 & 2032
- Table 36: Colombia MMORPG Industry Revenue (Million) Forecast, by Application 2019 & 2032
- Table 37: Ecuador MMORPG Industry Revenue (Million) Forecast, by Application 2019 & 2032
- Table 38: Venezuela MMORPG Industry Revenue (Million) Forecast, by Application 2019 & 2032
- Table 39: Rest of South America MMORPG Industry Revenue (Million) Forecast, by Application 2019 & 2032
- Table 40: Global MMORPG Industry Revenue Million Forecast, by Country 2019 & 2032
- Table 41: United Arab Emirates MMORPG Industry Revenue (Million) Forecast, by Application 2019 & 2032
- Table 42: Saudi Arabia MMORPG Industry Revenue (Million) Forecast, by Application 2019 & 2032
- Table 43: South Africa MMORPG Industry Revenue (Million) Forecast, by Application 2019 & 2032
- Table 44: Rest of Middle East and Africa MMORPG Industry Revenue (Million) Forecast, by Application 2019 & 2032
- Table 45: Global MMORPG Industry Revenue Million Forecast, by Gaming Platform 2019 & 2032
- Table 46: Global MMORPG Industry Revenue Million Forecast, by Country 2019 & 2032
- Table 47: United States MMORPG Industry Revenue (Million) Forecast, by Application 2019 & 2032
- Table 48: Canada MMORPG Industry Revenue (Million) Forecast, by Application 2019 & 2032
- Table 49: Global MMORPG Industry Revenue Million Forecast, by Gaming Platform 2019 & 2032
- Table 50: Global MMORPG Industry Revenue Million Forecast, by Country 2019 & 2032
- Table 51: United Kingdom MMORPG Industry Revenue (Million) Forecast, by Application 2019 & 2032
- Table 52: Germany MMORPG Industry Revenue (Million) Forecast, by Application 2019 & 2032
- Table 53: France MMORPG Industry Revenue (Million) Forecast, by Application 2019 & 2032
- Table 54: Italy MMORPG Industry Revenue (Million) Forecast, by Application 2019 & 2032
- Table 55: Russia MMORPG Industry Revenue (Million) Forecast, by Application 2019 & 2032
- Table 56: Global MMORPG Industry Revenue Million Forecast, by Gaming Platform 2019 & 2032
- Table 57: Global MMORPG Industry Revenue Million Forecast, by Country 2019 & 2032
- Table 58: China MMORPG Industry Revenue (Million) Forecast, by Application 2019 & 2032
- Table 59: India MMORPG Industry Revenue (Million) Forecast, by Application 2019 & 2032
- Table 60: Japan MMORPG Industry Revenue (Million) Forecast, by Application 2019 & 2032
- Table 61: South Korea MMORPG Industry Revenue (Million) Forecast, by Application 2019 & 2032
- Table 62: Global MMORPG Industry Revenue Million Forecast, by Gaming Platform 2019 & 2032
- Table 63: Global MMORPG Industry Revenue Million Forecast, by Country 2019 & 2032
- Table 64: Global MMORPG Industry Revenue Million Forecast, by Gaming Platform 2019 & 2032
- Table 65: Global MMORPG Industry Revenue Million Forecast, by Country 2019 & 2032
- Table 66: Brazil MMORPG Industry Revenue (Million) Forecast, by Application 2019 & 2032
- Table 67: Mexico MMORPG Industry Revenue (Million) Forecast, by Application 2019 & 2032
- Table 68: Argentina MMORPG Industry Revenue (Million) Forecast, by Application 2019 & 2032
- Table 69: Global MMORPG Industry Revenue Million Forecast, by Gaming Platform 2019 & 2032
- Table 70: Global MMORPG Industry Revenue Million Forecast, by Country 2019 & 2032
- Table 71: United Arab Emirates MMORPG Industry Revenue (Million) Forecast, by Application 2019 & 2032
- Table 72: Saudi Arabia MMORPG Industry Revenue (Million) Forecast, by Application 2019 & 2032
- Table 73: South Africa MMORPG Industry Revenue (Million) Forecast, by Application 2019 & 2032
Frequently Asked Questions
1. What is the projected Compound Annual Growth Rate (CAGR) of the MMORPG Industry?
The projected CAGR is approximately 10.75%.
2. Which companies are prominent players in the MMORPG Industry?
Key companies in the market include Daybreak Game Company, Electronic Arts Inc, Amazon Game Studios, Giant Interactive Group Inc, Aeria Games, CCP games UK Ltd, NCSOFT Corporation, Activision Blizzard Inc, Neteasegames Inc, Tencent Holdings Limited, Bright Star Studios, Ubisoft Entertainment SA, Jagex Limited, Gravity Corporatio, Nexon Co Ltd.
3. What are the main segments of the MMORPG Industry?
The market segments include Gaming Platform.
4. Can you provide details about the market size?
The market size is estimated to be USD 25.34 Million as of 2022.
5. What are some drivers contributing to market growth?
Rising Smartphone Penetration and Increasing Penetration of Internet among Developing Economies; Technological Advancement such as IoT. AR. and VR; Emergence of Gamification.
6. What are the notable trends driving market growth?
Rising Smartphone Penetration and Increasing Penetration of Internet among Developing Economies may Drive the Market Growth.
7. Are there any restraints impacting market growth?
Costs. Interoperability. and Security Concerns.
8. Can you provide examples of recent developments in the market?
January 2023: The development team behind Search for Animera, a web3-native massively multiplayer online role-playing game (MMORPG), announced the game's launch on ImmutableX, the go-to Ethereum platform for creating and scaling web3 games. By partnering with ImmutableX and utilizing its platform for the project's infrastructure, the developers of Animera can make sure that users may benefit from the simplicity of quick transactions, free mining, and trade, as well as the strength of Ethereum's built-in security.
9. What pricing options are available for accessing the report?
Pricing options include single-user, multi-user, and enterprise licenses priced at USD 4750, USD 5250, and USD 8750 respectively.
10. Is the market size provided in terms of value or volume?
The market size is provided in terms of value, measured in Million.
11. Are there any specific market keywords associated with the report?
Yes, the market keyword associated with the report is "MMORPG Industry," which aids in identifying and referencing the specific market segment covered.
12. How do I determine which pricing option suits my needs best?
The pricing options vary based on user requirements and access needs. Individual users may opt for single-user licenses, while businesses requiring broader access may choose multi-user or enterprise licenses for cost-effective access to the report.
13. Are there any additional resources or data provided in the MMORPG Industry report?
While the report offers comprehensive insights, it's advisable to review the specific contents or supplementary materials provided to ascertain if additional resources or data are available.
14. How can I stay updated on further developments or reports in the MMORPG Industry?
To stay informed about further developments, trends, and reports in the MMORPG Industry, consider subscribing to industry newsletters, following relevant companies and organizations, or regularly checking reputable industry news sources and publications.
Methodology
Step 1 - Identification of Relevant Samples Size from Population Database


Step 2 - Approaches for Defining Global Market Size (Value, Volume* & Price*)

Note*: In applicable scenarios
Step 3 - Data Sources
Primary Research
- Web Analytics
- Survey Reports
- Research Institute
- Latest Research Reports
- Opinion Leaders
Secondary Research
- Annual Reports
- White Paper
- Latest Press Release
- Industry Association
- Paid Database
- Investor Presentations

Step 4 - Data Triangulation
Involves using different sources of information in order to increase the validity of a study
These sources are likely to be stakeholders in a program - participants, other researchers, program staff, other community members, and so on.
Then we put all data in single framework & apply various statistical tools to find out the dynamic on the market.
During the analysis stage, feedback from the stakeholder groups would be compared to determine areas of agreement as well as areas of divergence


