
Key Insights
The North American smart office market is experiencing robust growth, driven by increasing demand for enhanced operational efficiency, improved security, and optimized energy consumption within commercial buildings. The market's expansion is fueled by several key factors: the rising adoption of cloud-based solutions for seamless integration and data management, the increasing prevalence of IoT devices enabling real-time monitoring and control, and a growing emphasis on sustainable building practices. Furthermore, government initiatives promoting energy efficiency and smart city development are further bolstering market growth. While the initial investment costs for smart office technologies can be substantial, the long-term benefits, including reduced operational expenses and improved employee productivity, are proving to be significant motivators for adoption. Retrofitting existing buildings presents a considerable opportunity for market expansion, surpassing new construction projects in terms of market share due to the large number of aging office spaces requiring modernization.
The competitive landscape is characterized by a mix of established technology giants like Honeywell, Johnson Controls, and Siemens, and innovative startups focusing on niche solutions. These companies are engaging in strategic partnerships and mergers & acquisitions to expand their product portfolios and market reach. While challenges remain, such as cybersecurity concerns related to interconnected systems and the need for skilled professionals to manage complex smart building infrastructure, the North American smart office market is projected to maintain a healthy CAGR, exceeding the global average, demonstrating strong potential for sustained growth over the forecast period of 2025-2033. The market segmentation by product type (smart lighting, security systems, energy management, etc.) and building type (retrofits, new builds) allows for a targeted approach to product development and market penetration. Focusing on the unique needs of specific building types and offering integrated solutions will be crucial for continued success in this dynamic and competitive landscape.
North America Smart Office Market: A Comprehensive Report (2019-2033)
This detailed report provides a comprehensive analysis of the North America (NA) smart office market, offering invaluable insights for industry stakeholders, investors, and strategic decision-makers. Covering the period from 2019 to 2033, with a focus on 2025, this report dissects market dynamics, growth drivers, challenges, and emerging opportunities within this rapidly evolving sector. The report leverages extensive market research, incorporating data and analysis from credible sources.
NA Smart Office Market Market Concentration & Innovation
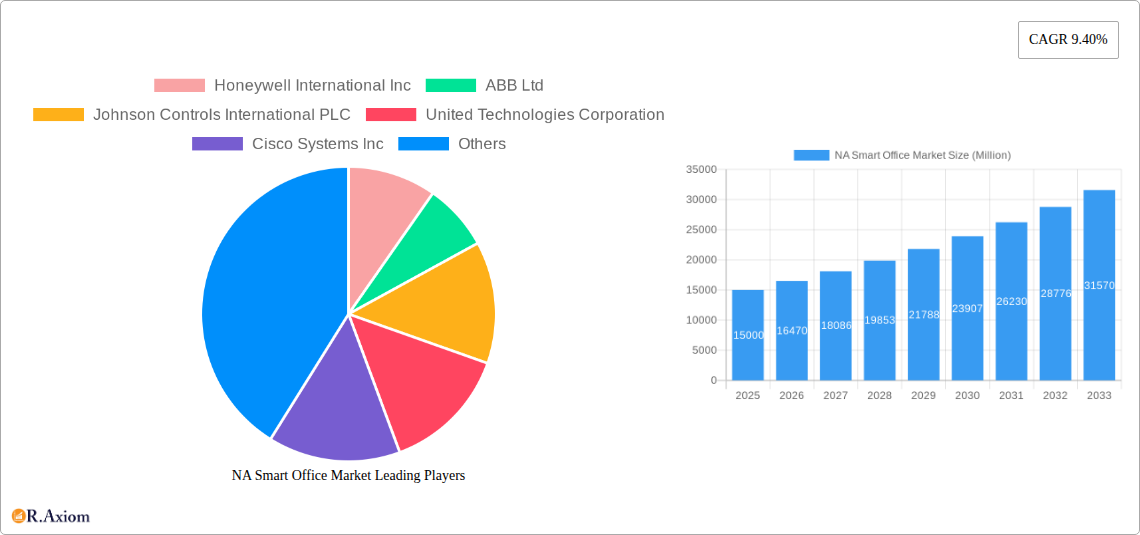
The NA smart office market exhibits a moderately concentrated landscape, with several multinational corporations holding significant market share. Key players, including Honeywell International Inc, ABB Ltd, Johnson Controls International PLC, United Technologies Corporation, Cisco Systems Inc, Lutron Electronics Co Inc, Siemens AG, Schneider Electric SE, Koninklijke Philips NV, Enlighted Inc, Crestron Electronics Inc, and FogHorn Systems Inc, compete fiercely, driving innovation. Market share estimates for 2025 suggest that the top five players account for approximately xx% of the total market revenue, exceeding $xx Million.
Innovation is a key driver, fueled by advancements in IoT, AI, cloud computing, and big data analytics. These technologies are enabling the development of more sophisticated and integrated smart office solutions. However, market concentration is also influenced by stringent regulatory frameworks concerning data privacy and security, demanding robust cybersecurity measures. The market witnesses significant M&A activity. For instance, the acquisition of Cylon Controls by ABB in March 2020 for an undisclosed amount highlighted the strategic importance of expanding market presence and expertise in energy optimization within the smart building segment. Furthermore, increasing preference for flexible workspaces and sustainability concerns are shaping end-user trends, demanding adaptable and energy-efficient smart office solutions.
- Market Share (2025 Estimate): Top 5 players: xx% ($xx Million)
- M&A Activity (2019-2024): xx deals totaling an estimated $xx Million in value.
- Key Innovation Drivers: IoT, AI, Cloud Computing, Big Data Analytics
- Regulatory Impacts: Data privacy regulations, cybersecurity standards.
NA Smart Office Market Industry Trends & Insights
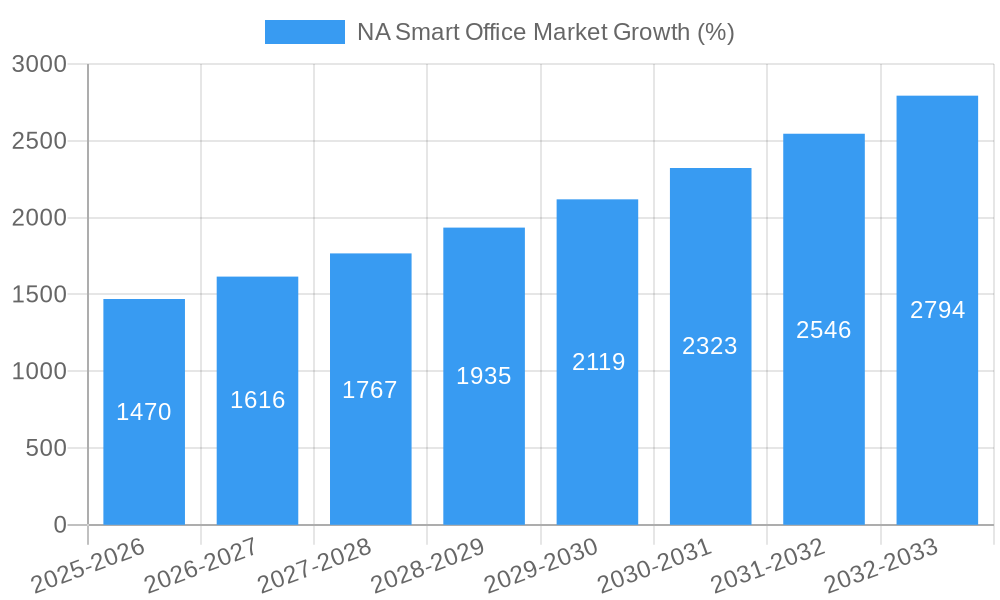
The NA smart office market is experiencing robust growth, driven by several key factors. The increasing adoption of smart technologies across various sectors, coupled with the rising demand for improved workplace efficiency and productivity, is significantly boosting market expansion. The COVID-19 pandemic accelerated the shift towards remote work and hybrid work models, stimulating investment in smart office solutions that enhance collaboration and communication. This has led to a surge in demand for video conferencing systems, cloud-based platforms, and enhanced security systems. Technological disruptions, particularly in areas such as 5G connectivity, edge computing, and improved sensor technology, are continuously enhancing smart office functionalities and capabilities.
Consumer preferences are shifting toward personalized and intuitive smart office experiences, emphasizing user-friendly interfaces and seamless integration of various systems. The market is also witnessing increasing competition among vendors, leading to price reductions and innovative product offerings. The market is expected to witness a Compound Annual Growth Rate (CAGR) of xx% during the forecast period (2025-2033), reaching a market size of $xx Million by 2033. Market penetration of smart office solutions is increasing rapidly, particularly in larger enterprises and corporations, with a penetration rate of xx% in 2025, projected to reach xx% by 2033.
Dominant Markets & Segments in NA Smart Office Market
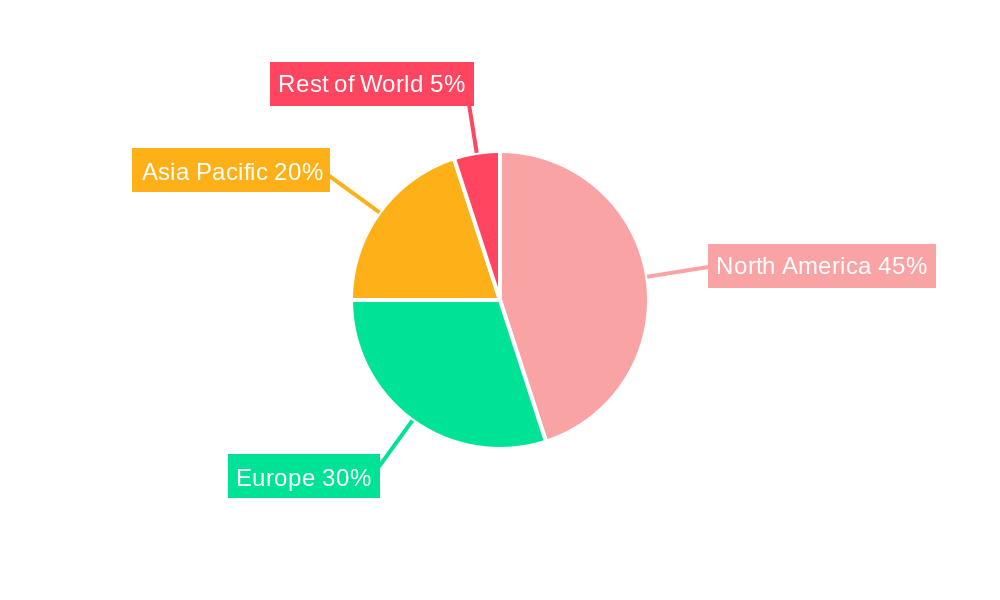
The United States dominates the NA smart office market, driven by a strong economy, advanced technological infrastructure, and high adoption rates of smart technologies among businesses. Canada presents a significant growth opportunity, propelled by increasing investments in smart city initiatives and government support for sustainable building practices.
Within the product segment, the Energy Management System holds the largest market share in 2025 at $xx Million due to growing environmental concerns and increasing energy costs. The Security and Access Control System segment is also exhibiting strong growth, driven by rising security threats and the need for enhanced safety protocols.
Regarding building type, the retrofit market is currently larger than the new building segment, as existing office buildings are increasingly being upgraded with smart technologies.
- Key Drivers (United States): Strong economy, advanced technological infrastructure, high adoption rates
- Key Drivers (Canada): Smart city initiatives, government support for sustainable buildings
- Dominant Product Segment (2025): Energy Management System ($xx Million)
- Dominant Building Type (2025): Retrofits
NA Smart Office Market Product Developments
Recent product innovations focus on enhancing energy efficiency, improving security features, and integrating various systems for seamless operation. Advancements in AI-powered analytics are allowing for more proactive system management and predictive maintenance. The market is also seeing the emergence of modular and scalable solutions that can be adapted to the changing needs of office environments. These innovations are improving market fit by addressing key concerns regarding cost efficiency, ease of implementation, and user experience.
Report Scope & Segmentation Analysis
This report segments the NA smart office market by product type (Smart Office Lighting, Security and Access Control System, Energy Management System, Smart HVAC Control System, Audio-video Conferencing System, Fire and Safety Control System), building type (Retrofits, New Buildings), and country (United States, Canada). Each segment’s growth projections, market size (in Millions), and competitive dynamics are analyzed. The market exhibits varying growth rates across segments, influenced by factors like technological maturity, cost considerations, and regulatory landscape. For example, the Smart Office Lighting segment is predicted to grow at a CAGR of xx% due to advancements in LED lighting and the rising popularity of smart lighting control systems. Conversely, the Fire and Safety Control System segment is expected to show steady growth, driven by the increasing emphasis on occupant safety and compliance standards.
Key Drivers of NA Smart Office Market Growth
Several factors propel the growth of the NA smart office market. Technological advancements, specifically IoT and AI, are revolutionizing office functionalities, improving operational efficiency, and enhancing sustainability. Economic factors, including the increasing focus on productivity and cost optimization within organizations, are driving the adoption of smart office solutions. Government regulations that promote energy efficiency and smart building initiatives also contribute to market expansion.
Challenges in the NA Smart Office Market Sector
The NA smart office market faces challenges, including high initial investment costs for implementation, cybersecurity concerns related to data breaches and system vulnerabilities, the complexity of integrating diverse systems, and the need for skilled workforce to manage and maintain these complex technologies. These factors can impact market growth and widespread adoption. The lack of interoperability between different systems from various vendors represents a significant hurdle.
Emerging Opportunities in NA Smart Office Market
The market presents significant opportunities in areas like the integration of smart office technologies with other smart building systems, the development of more user-friendly and intuitive interfaces, the expansion of smart office solutions into smaller and medium-sized businesses, and the growth of cloud-based smart office platforms that offer greater flexibility and scalability. The increasing adoption of 5G networks is expected to significantly impact the expansion of IoT-based smart office solutions.
Leading Players in the NA Smart Office Market Market
- Honeywell International Inc
- ABB Ltd
- Johnson Controls International PLC
- United Technologies Corporation
- Cisco Systems Inc
- Lutron Electronics Co Inc
- Siemens AG
- Schneider Electric SE
- Koninklijke Philips NV
- Enlighted Inc
- Crestron Electronics Inc
- FogHorn Systems Inc
Key Developments in NA Smart Office Market Industry
- March 2020: ABB acquired Cylon Controls, expanding its smart building portfolio and capabilities in energy optimization.
Strategic Outlook for NA Smart Office Market Market
The NA smart office market holds immense potential for future growth, driven by sustained technological advancements, increasing business demand for enhanced efficiency and productivity, and the growing emphasis on sustainability. The market will witness continued innovation, focusing on seamless system integration, improved user experiences, and enhanced security measures. Strategic partnerships and collaborations among technology providers and building owners will play a crucial role in shaping the market's future landscape.
NA Smart Office Market Segmentation
-
1. Product Type
- 1.1. Smart Office Lighting
- 1.2. Security and Access Control System
- 1.3. Energy Management System
- 1.4. Smart HVAC Control System
- 1.5. Audio-video Conferencing System
- 1.6. Fire and Safety Control System
-
2. Building Type
- 2.1. Retrofits
- 2.2. New Buildings
NA Smart Office Market Segmentation By Geography
-
1. North America
- 1.1. United States
- 1.2. Canada
- 1.3. Mexico
-
2. South America
- 2.1. Brazil
- 2.2. Argentina
- 2.3. Rest of South America
-
3. Europe
- 3.1. United Kingdom
- 3.2. Germany
- 3.3. France
- 3.4. Italy
- 3.5. Spain
- 3.6. Russia
- 3.7. Benelux
- 3.8. Nordics
- 3.9. Rest of Europe
-
4. Middle East & Africa
- 4.1. Turkey
- 4.2. Israel
- 4.3. GCC
- 4.4. North Africa
- 4.5. South Africa
- 4.6. Rest of Middle East & Africa
-
5. Asia Pacific
- 5.1. China
- 5.2. India
- 5.3. Japan
- 5.4. South Korea
- 5.5. ASEAN
- 5.6. Oceania
- 5.7. Rest of Asia Pacific
NA Smart Office Market REPORT HIGHLIGHTS
| Aspects | Details |
|---|---|
| Study Period | 2019-2033 |
| Base Year | 2024 |
| Estimated Year | 2025 |
| Forecast Period | 2025-2033 |
| Historical Period | 2019-2024 |
| Growth Rate | CAGR of 9.40% from 2019-2033 |
| Segmentation |
|
Table of Contents
- 1. Introduction
- 1.1. Research Scope
- 1.2. Market Segmentation
- 1.3. Research Methodology
- 1.4. Definitions and Assumptions
- 2. Executive Summary
- 2.1. Introduction
- 3. Market Dynamics
- 3.1. Introduction
- 3.2. Market Drivers
- 3.2.1. Increasing Demand for Energy Efficient Solutions; Growing Need for Automation of Security Systems
- 3.3. Market Restrains
- 3.3.1. High Cost of Connected Systems
- 3.4. Market Trends
- 3.4.1. Security and Access Control to Witness Significant Growth
- 4. Market Factor Analysis
- 4.1. Porters Five Forces
- 4.2. Supply/Value Chain
- 4.3. PESTEL analysis
- 4.4. Market Entropy
- 4.5. Patent/Trademark Analysis
- 5. Global NA Smart Office Market Analysis, Insights and Forecast, 2019-2031
- 5.1. Market Analysis, Insights and Forecast - by Product Type
- 5.1.1. Smart Office Lighting
- 5.1.2. Security and Access Control System
- 5.1.3. Energy Management System
- 5.1.4. Smart HVAC Control System
- 5.1.5. Audio-video Conferencing System
- 5.1.6. Fire and Safety Control System
- 5.2. Market Analysis, Insights and Forecast - by Building Type
- 5.2.1. Retrofits
- 5.2.2. New Buildings
- 5.3. Market Analysis, Insights and Forecast - by Region
- 5.3.1. North America
- 5.3.2. South America
- 5.3.3. Europe
- 5.3.4. Middle East & Africa
- 5.3.5. Asia Pacific
- 5.1. Market Analysis, Insights and Forecast - by Product Type
- 6. North America NA Smart Office Market Analysis, Insights and Forecast, 2019-2031
- 6.1. Market Analysis, Insights and Forecast - by Product Type
- 6.1.1. Smart Office Lighting
- 6.1.2. Security and Access Control System
- 6.1.3. Energy Management System
- 6.1.4. Smart HVAC Control System
- 6.1.5. Audio-video Conferencing System
- 6.1.6. Fire and Safety Control System
- 6.2. Market Analysis, Insights and Forecast - by Building Type
- 6.2.1. Retrofits
- 6.2.2. New Buildings
- 6.1. Market Analysis, Insights and Forecast - by Product Type
- 7. South America NA Smart Office Market Analysis, Insights and Forecast, 2019-2031
- 7.1. Market Analysis, Insights and Forecast - by Product Type
- 7.1.1. Smart Office Lighting
- 7.1.2. Security and Access Control System
- 7.1.3. Energy Management System
- 7.1.4. Smart HVAC Control System
- 7.1.5. Audio-video Conferencing System
- 7.1.6. Fire and Safety Control System
- 7.2. Market Analysis, Insights and Forecast - by Building Type
- 7.2.1. Retrofits
- 7.2.2. New Buildings
- 7.1. Market Analysis, Insights and Forecast - by Product Type
- 8. Europe NA Smart Office Market Analysis, Insights and Forecast, 2019-2031
- 8.1. Market Analysis, Insights and Forecast - by Product Type
- 8.1.1. Smart Office Lighting
- 8.1.2. Security and Access Control System
- 8.1.3. Energy Management System
- 8.1.4. Smart HVAC Control System
- 8.1.5. Audio-video Conferencing System
- 8.1.6. Fire and Safety Control System
- 8.2. Market Analysis, Insights and Forecast - by Building Type
- 8.2.1. Retrofits
- 8.2.2. New Buildings
- 8.1. Market Analysis, Insights and Forecast - by Product Type
- 9. Middle East & Africa NA Smart Office Market Analysis, Insights and Forecast, 2019-2031
- 9.1. Market Analysis, Insights and Forecast - by Product Type
- 9.1.1. Smart Office Lighting
- 9.1.2. Security and Access Control System
- 9.1.3. Energy Management System
- 9.1.4. Smart HVAC Control System
- 9.1.5. Audio-video Conferencing System
- 9.1.6. Fire and Safety Control System
- 9.2. Market Analysis, Insights and Forecast - by Building Type
- 9.2.1. Retrofits
- 9.2.2. New Buildings
- 9.1. Market Analysis, Insights and Forecast - by Product Type
- 10. Asia Pacific NA Smart Office Market Analysis, Insights and Forecast, 2019-2031
- 10.1. Market Analysis, Insights and Forecast - by Product Type
- 10.1.1. Smart Office Lighting
- 10.1.2. Security and Access Control System
- 10.1.3. Energy Management System
- 10.1.4. Smart HVAC Control System
- 10.1.5. Audio-video Conferencing System
- 10.1.6. Fire and Safety Control System
- 10.2. Market Analysis, Insights and Forecast - by Building Type
- 10.2.1. Retrofits
- 10.2.2. New Buildings
- 10.1. Market Analysis, Insights and Forecast - by Product Type
- 11. North America NA Smart Office Market Analysis, Insights and Forecast, 2019-2031
- 11.1. Market Analysis, Insights and Forecast - By Country/Sub-region
- 11.1.1.
- 12. Europe NA Smart Office Market Analysis, Insights and Forecast, 2019-2031
- 12.1. Market Analysis, Insights and Forecast - By Country/Sub-region
- 12.1.1.
- 13. Asia Pacific NA Smart Office Market Analysis, Insights and Forecast, 2019-2031
- 13.1. Market Analysis, Insights and Forecast - By Country/Sub-region
- 13.1.1.
- 14. Rest of the World NA Smart Office Market Analysis, Insights and Forecast, 2019-2031
- 14.1. Market Analysis, Insights and Forecast - By Country/Sub-region
- 14.1.1.
- 15. Competitive Analysis
- 15.1. Global Market Share Analysis 2024
- 15.2. Company Profiles
- 15.2.1 Honeywell International Inc
- 15.2.1.1. Overview
- 15.2.1.2. Products
- 15.2.1.3. SWOT Analysis
- 15.2.1.4. Recent Developments
- 15.2.1.5. Financials (Based on Availability)
- 15.2.2 ABB Ltd
- 15.2.2.1. Overview
- 15.2.2.2. Products
- 15.2.2.3. SWOT Analysis
- 15.2.2.4. Recent Developments
- 15.2.2.5. Financials (Based on Availability)
- 15.2.3 Johnson Controls International PLC
- 15.2.3.1. Overview
- 15.2.3.2. Products
- 15.2.3.3. SWOT Analysis
- 15.2.3.4. Recent Developments
- 15.2.3.5. Financials (Based on Availability)
- 15.2.4 United Technologies Corporation
- 15.2.4.1. Overview
- 15.2.4.2. Products
- 15.2.4.3. SWOT Analysis
- 15.2.4.4. Recent Developments
- 15.2.4.5. Financials (Based on Availability)
- 15.2.5 Cisco Systems Inc
- 15.2.5.1. Overview
- 15.2.5.2. Products
- 15.2.5.3. SWOT Analysis
- 15.2.5.4. Recent Developments
- 15.2.5.5. Financials (Based on Availability)
- 15.2.6 Lutron Electronics Co Inc
- 15.2.6.1. Overview
- 15.2.6.2. Products
- 15.2.6.3. SWOT Analysis
- 15.2.6.4. Recent Developments
- 15.2.6.5. Financials (Based on Availability)
- 15.2.7 Siemens AG
- 15.2.7.1. Overview
- 15.2.7.2. Products
- 15.2.7.3. SWOT Analysis
- 15.2.7.4. Recent Developments
- 15.2.7.5. Financials (Based on Availability)
- 15.2.8 Schneider Electric SE
- 15.2.8.1. Overview
- 15.2.8.2. Products
- 15.2.8.3. SWOT Analysis
- 15.2.8.4. Recent Developments
- 15.2.8.5. Financials (Based on Availability)
- 15.2.9 Koninklijke Philips NV
- 15.2.9.1. Overview
- 15.2.9.2. Products
- 15.2.9.3. SWOT Analysis
- 15.2.9.4. Recent Developments
- 15.2.9.5. Financials (Based on Availability)
- 15.2.10 Enlighted Inc *List Not Exhaustive
- 15.2.10.1. Overview
- 15.2.10.2. Products
- 15.2.10.3. SWOT Analysis
- 15.2.10.4. Recent Developments
- 15.2.10.5. Financials (Based on Availability)
- 15.2.11 Crestron Electronics Inc
- 15.2.11.1. Overview
- 15.2.11.2. Products
- 15.2.11.3. SWOT Analysis
- 15.2.11.4. Recent Developments
- 15.2.11.5. Financials (Based on Availability)
- 15.2.12 FogHorn Systems Inc
- 15.2.12.1. Overview
- 15.2.12.2. Products
- 15.2.12.3. SWOT Analysis
- 15.2.12.4. Recent Developments
- 15.2.12.5. Financials (Based on Availability)
- 15.2.1 Honeywell International Inc
List of Figures
- Figure 1: Global NA Smart Office Market Revenue Breakdown (Million, %) by Region 2024 & 2032
- Figure 2: North America NA Smart Office Market Revenue (Million), by Country 2024 & 2032
- Figure 3: North America NA Smart Office Market Revenue Share (%), by Country 2024 & 2032
- Figure 4: Europe NA Smart Office Market Revenue (Million), by Country 2024 & 2032
- Figure 5: Europe NA Smart Office Market Revenue Share (%), by Country 2024 & 2032
- Figure 6: Asia Pacific NA Smart Office Market Revenue (Million), by Country 2024 & 2032
- Figure 7: Asia Pacific NA Smart Office Market Revenue Share (%), by Country 2024 & 2032
- Figure 8: Rest of the World NA Smart Office Market Revenue (Million), by Country 2024 & 2032
- Figure 9: Rest of the World NA Smart Office Market Revenue Share (%), by Country 2024 & 2032
- Figure 10: North America NA Smart Office Market Revenue (Million), by Product Type 2024 & 2032
- Figure 11: North America NA Smart Office Market Revenue Share (%), by Product Type 2024 & 2032
- Figure 12: North America NA Smart Office Market Revenue (Million), by Building Type 2024 & 2032
- Figure 13: North America NA Smart Office Market Revenue Share (%), by Building Type 2024 & 2032
- Figure 14: North America NA Smart Office Market Revenue (Million), by Country 2024 & 2032
- Figure 15: North America NA Smart Office Market Revenue Share (%), by Country 2024 & 2032
- Figure 16: South America NA Smart Office Market Revenue (Million), by Product Type 2024 & 2032
- Figure 17: South America NA Smart Office Market Revenue Share (%), by Product Type 2024 & 2032
- Figure 18: South America NA Smart Office Market Revenue (Million), by Building Type 2024 & 2032
- Figure 19: South America NA Smart Office Market Revenue Share (%), by Building Type 2024 & 2032
- Figure 20: South America NA Smart Office Market Revenue (Million), by Country 2024 & 2032
- Figure 21: South America NA Smart Office Market Revenue Share (%), by Country 2024 & 2032
- Figure 22: Europe NA Smart Office Market Revenue (Million), by Product Type 2024 & 2032
- Figure 23: Europe NA Smart Office Market Revenue Share (%), by Product Type 2024 & 2032
- Figure 24: Europe NA Smart Office Market Revenue (Million), by Building Type 2024 & 2032
- Figure 25: Europe NA Smart Office Market Revenue Share (%), by Building Type 2024 & 2032
- Figure 26: Europe NA Smart Office Market Revenue (Million), by Country 2024 & 2032
- Figure 27: Europe NA Smart Office Market Revenue Share (%), by Country 2024 & 2032
- Figure 28: Middle East & Africa NA Smart Office Market Revenue (Million), by Product Type 2024 & 2032
- Figure 29: Middle East & Africa NA Smart Office Market Revenue Share (%), by Product Type 2024 & 2032
- Figure 30: Middle East & Africa NA Smart Office Market Revenue (Million), by Building Type 2024 & 2032
- Figure 31: Middle East & Africa NA Smart Office Market Revenue Share (%), by Building Type 2024 & 2032
- Figure 32: Middle East & Africa NA Smart Office Market Revenue (Million), by Country 2024 & 2032
- Figure 33: Middle East & Africa NA Smart Office Market Revenue Share (%), by Country 2024 & 2032
- Figure 34: Asia Pacific NA Smart Office Market Revenue (Million), by Product Type 2024 & 2032
- Figure 35: Asia Pacific NA Smart Office Market Revenue Share (%), by Product Type 2024 & 2032
- Figure 36: Asia Pacific NA Smart Office Market Revenue (Million), by Building Type 2024 & 2032
- Figure 37: Asia Pacific NA Smart Office Market Revenue Share (%), by Building Type 2024 & 2032
- Figure 38: Asia Pacific NA Smart Office Market Revenue (Million), by Country 2024 & 2032
- Figure 39: Asia Pacific NA Smart Office Market Revenue Share (%), by Country 2024 & 2032
List of Tables
- Table 1: Global NA Smart Office Market Revenue Million Forecast, by Region 2019 & 2032
- Table 2: Global NA Smart Office Market Revenue Million Forecast, by Product Type 2019 & 2032
- Table 3: Global NA Smart Office Market Revenue Million Forecast, by Building Type 2019 & 2032
- Table 4: Global NA Smart Office Market Revenue Million Forecast, by Region 2019 & 2032
- Table 5: Global NA Smart Office Market Revenue Million Forecast, by Country 2019 & 2032
- Table 6: NA Smart Office Market Revenue (Million) Forecast, by Application 2019 & 2032
- Table 7: Global NA Smart Office Market Revenue Million Forecast, by Country 2019 & 2032
- Table 8: NA Smart Office Market Revenue (Million) Forecast, by Application 2019 & 2032
- Table 9: Global NA Smart Office Market Revenue Million Forecast, by Country 2019 & 2032
- Table 10: NA Smart Office Market Revenue (Million) Forecast, by Application 2019 & 2032
- Table 11: Global NA Smart Office Market Revenue Million Forecast, by Country 2019 & 2032
- Table 12: NA Smart Office Market Revenue (Million) Forecast, by Application 2019 & 2032
- Table 13: Global NA Smart Office Market Revenue Million Forecast, by Product Type 2019 & 2032
- Table 14: Global NA Smart Office Market Revenue Million Forecast, by Building Type 2019 & 2032
- Table 15: Global NA Smart Office Market Revenue Million Forecast, by Country 2019 & 2032
- Table 16: United States NA Smart Office Market Revenue (Million) Forecast, by Application 2019 & 2032
- Table 17: Canada NA Smart Office Market Revenue (Million) Forecast, by Application 2019 & 2032
- Table 18: Mexico NA Smart Office Market Revenue (Million) Forecast, by Application 2019 & 2032
- Table 19: Global NA Smart Office Market Revenue Million Forecast, by Product Type 2019 & 2032
- Table 20: Global NA Smart Office Market Revenue Million Forecast, by Building Type 2019 & 2032
- Table 21: Global NA Smart Office Market Revenue Million Forecast, by Country 2019 & 2032
- Table 22: Brazil NA Smart Office Market Revenue (Million) Forecast, by Application 2019 & 2032
- Table 23: Argentina NA Smart Office Market Revenue (Million) Forecast, by Application 2019 & 2032
- Table 24: Rest of South America NA Smart Office Market Revenue (Million) Forecast, by Application 2019 & 2032
- Table 25: Global NA Smart Office Market Revenue Million Forecast, by Product Type 2019 & 2032
- Table 26: Global NA Smart Office Market Revenue Million Forecast, by Building Type 2019 & 2032
- Table 27: Global NA Smart Office Market Revenue Million Forecast, by Country 2019 & 2032
- Table 28: United Kingdom NA Smart Office Market Revenue (Million) Forecast, by Application 2019 & 2032
- Table 29: Germany NA Smart Office Market Revenue (Million) Forecast, by Application 2019 & 2032
- Table 30: France NA Smart Office Market Revenue (Million) Forecast, by Application 2019 & 2032
- Table 31: Italy NA Smart Office Market Revenue (Million) Forecast, by Application 2019 & 2032
- Table 32: Spain NA Smart Office Market Revenue (Million) Forecast, by Application 2019 & 2032
- Table 33: Russia NA Smart Office Market Revenue (Million) Forecast, by Application 2019 & 2032
- Table 34: Benelux NA Smart Office Market Revenue (Million) Forecast, by Application 2019 & 2032
- Table 35: Nordics NA Smart Office Market Revenue (Million) Forecast, by Application 2019 & 2032
- Table 36: Rest of Europe NA Smart Office Market Revenue (Million) Forecast, by Application 2019 & 2032
- Table 37: Global NA Smart Office Market Revenue Million Forecast, by Product Type 2019 & 2032
- Table 38: Global NA Smart Office Market Revenue Million Forecast, by Building Type 2019 & 2032
- Table 39: Global NA Smart Office Market Revenue Million Forecast, by Country 2019 & 2032
- Table 40: Turkey NA Smart Office Market Revenue (Million) Forecast, by Application 2019 & 2032
- Table 41: Israel NA Smart Office Market Revenue (Million) Forecast, by Application 2019 & 2032
- Table 42: GCC NA Smart Office Market Revenue (Million) Forecast, by Application 2019 & 2032
- Table 43: North Africa NA Smart Office Market Revenue (Million) Forecast, by Application 2019 & 2032
- Table 44: South Africa NA Smart Office Market Revenue (Million) Forecast, by Application 2019 & 2032
- Table 45: Rest of Middle East & Africa NA Smart Office Market Revenue (Million) Forecast, by Application 2019 & 2032
- Table 46: Global NA Smart Office Market Revenue Million Forecast, by Product Type 2019 & 2032
- Table 47: Global NA Smart Office Market Revenue Million Forecast, by Building Type 2019 & 2032
- Table 48: Global NA Smart Office Market Revenue Million Forecast, by Country 2019 & 2032
- Table 49: China NA Smart Office Market Revenue (Million) Forecast, by Application 2019 & 2032
- Table 50: India NA Smart Office Market Revenue (Million) Forecast, by Application 2019 & 2032
- Table 51: Japan NA Smart Office Market Revenue (Million) Forecast, by Application 2019 & 2032
- Table 52: South Korea NA Smart Office Market Revenue (Million) Forecast, by Application 2019 & 2032
- Table 53: ASEAN NA Smart Office Market Revenue (Million) Forecast, by Application 2019 & 2032
- Table 54: Oceania NA Smart Office Market Revenue (Million) Forecast, by Application 2019 & 2032
- Table 55: Rest of Asia Pacific NA Smart Office Market Revenue (Million) Forecast, by Application 2019 & 2032
Frequently Asked Questions
1. What is the projected Compound Annual Growth Rate (CAGR) of the NA Smart Office Market?
The projected CAGR is approximately 9.40%.
2. Which companies are prominent players in the NA Smart Office Market?
Key companies in the market include Honeywell International Inc, ABB Ltd, Johnson Controls International PLC, United Technologies Corporation, Cisco Systems Inc, Lutron Electronics Co Inc, Siemens AG, Schneider Electric SE, Koninklijke Philips NV, Enlighted Inc *List Not Exhaustive, Crestron Electronics Inc, FogHorn Systems Inc.
3. What are the main segments of the NA Smart Office Market?
The market segments include Product Type, Building Type.
4. Can you provide details about the market size?
The market size is estimated to be USD XX Million as of 2022.
5. What are some drivers contributing to market growth?
Increasing Demand for Energy Efficient Solutions; Growing Need for Automation of Security Systems.
6. What are the notable trends driving market growth?
Security and Access Control to Witness Significant Growth.
7. Are there any restraints impacting market growth?
High Cost of Connected Systems.
8. Can you provide examples of recent developments in the market?
March 2020 - ABB acquired the Irish company Cylon Controls to expand its presence in the smart building segment. The acquisition will expand the portfolio of commercial building solutions, emphasizing delivering innovations in energy optimization and comfort.
9. What pricing options are available for accessing the report?
Pricing options include single-user, multi-user, and enterprise licenses priced at USD 4750, USD 4950, and USD 6800 respectively.
10. Is the market size provided in terms of value or volume?
The market size is provided in terms of value, measured in Million.
11. Are there any specific market keywords associated with the report?
Yes, the market keyword associated with the report is "NA Smart Office Market," which aids in identifying and referencing the specific market segment covered.
12. How do I determine which pricing option suits my needs best?
The pricing options vary based on user requirements and access needs. Individual users may opt for single-user licenses, while businesses requiring broader access may choose multi-user or enterprise licenses for cost-effective access to the report.
13. Are there any additional resources or data provided in the NA Smart Office Market report?
While the report offers comprehensive insights, it's advisable to review the specific contents or supplementary materials provided to ascertain if additional resources or data are available.
14. How can I stay updated on further developments or reports in the NA Smart Office Market?
To stay informed about further developments, trends, and reports in the NA Smart Office Market, consider subscribing to industry newsletters, following relevant companies and organizations, or regularly checking reputable industry news sources and publications.
Methodology
Step 1 - Identification of Relevant Samples Size from Population Database


Step 2 - Approaches for Defining Global Market Size (Value, Volume* & Price*)

Note*: In applicable scenarios
Step 3 - Data Sources
Primary Research
- Web Analytics
- Survey Reports
- Research Institute
- Latest Research Reports
- Opinion Leaders
Secondary Research
- Annual Reports
- White Paper
- Latest Press Release
- Industry Association
- Paid Database
- Investor Presentations

Step 4 - Data Triangulation
Involves using different sources of information in order to increase the validity of a study
These sources are likely to be stakeholders in a program - participants, other researchers, program staff, other community members, and so on.
Then we put all data in single framework & apply various statistical tools to find out the dynamic on the market.
During the analysis stage, feedback from the stakeholder groups would be compared to determine areas of agreement as well as areas of divergence


