
Key Insights
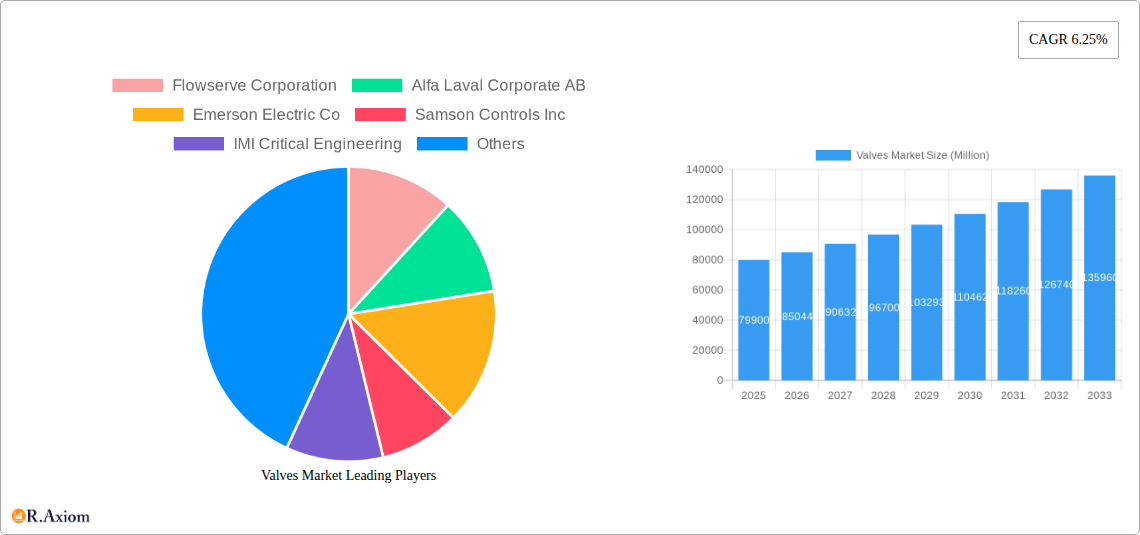
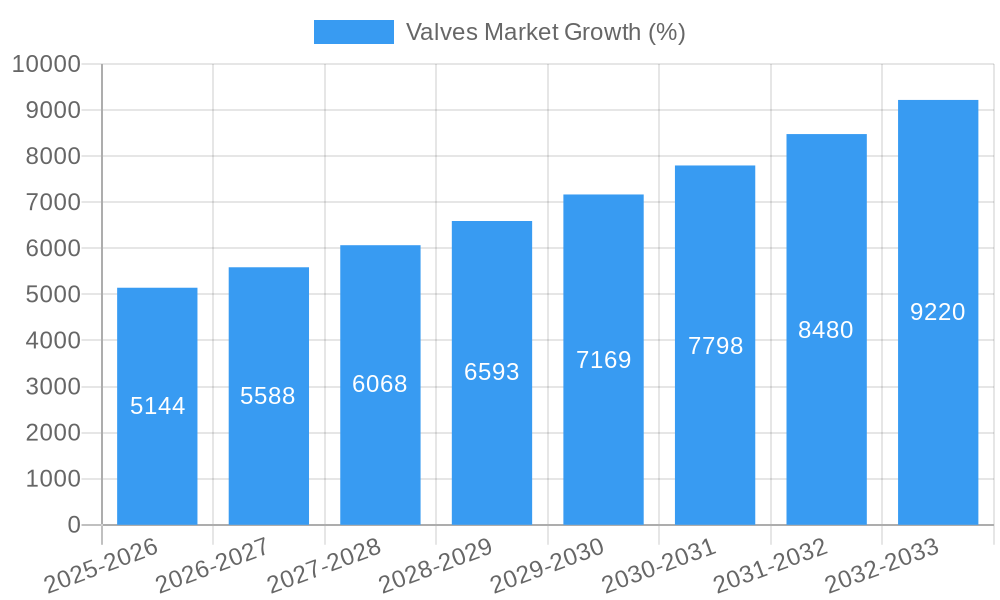
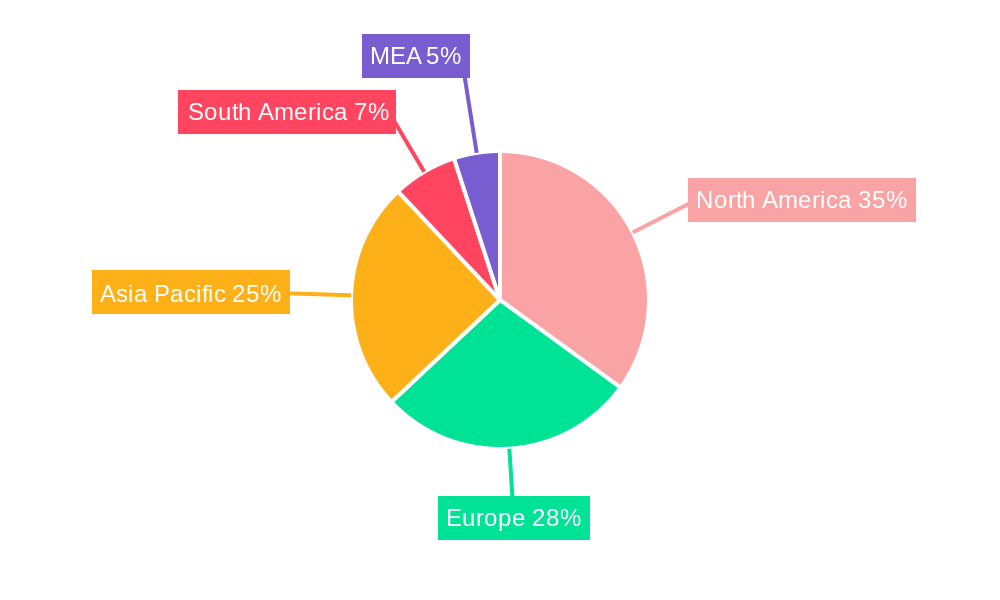
The global valves market, valued at $79.90 billion in 2025, is projected to experience robust growth, driven by a Compound Annual Growth Rate (CAGR) of 6.25% from 2025 to 2033. This expansion is fueled by several key factors. The burgeoning oil and gas industry, coupled with increasing investments in power generation and infrastructure development, significantly contributes to the market's demand. Furthermore, the growing need for efficient water and wastewater management systems, particularly in developing economies, presents substantial opportunities for valve manufacturers. Technological advancements, such as the adoption of smart valves with enhanced monitoring and control capabilities, are further bolstering market growth. The market is segmented by type (ball, butterfly, gate/globe/check, plug, control, and others) and end-user vertical (oil and gas, power generation, chemical, water and wastewater, mining, and others). North America and Europe currently hold significant market shares, but the Asia-Pacific region is anticipated to witness the fastest growth, driven by rapid industrialization and urbanization in countries like China and India. However, factors such as fluctuating raw material prices and stringent environmental regulations could potentially restrain market growth to some extent. Leading players like Flowserve Corporation, Alfa Laval, Emerson Electric, and others are actively investing in research and development, focusing on innovation and strategic partnerships to maintain their market position amidst increasing competition.
The competitive landscape is marked by the presence of both established multinational corporations and specialized regional players. These companies are employing various strategies, including mergers and acquisitions, product diversification, and geographical expansion, to enhance their market share and profitability. Future growth will depend on factors such as technological innovation in valve design and manufacturing, the adoption of sustainable practices within the industry, and the overall economic performance of key end-user sectors. A continued focus on developing energy-efficient and environmentally friendly valve solutions will be crucial for manufacturers seeking to thrive in this dynamic market. The market's overall trajectory suggests a positive outlook for the next decade, with continued expansion driven by ongoing global infrastructure development and the increasing demand for efficient and reliable fluid control solutions across a wide range of industrial applications.
Valves Market: Comprehensive Report - 2019-2033
This in-depth report provides a comprehensive analysis of the global Valves Market, offering invaluable insights for stakeholders across the industry. Covering the period from 2019 to 2033, with 2025 as the base year, this report meticulously examines market trends, segment performance, competitive dynamics, and future growth prospects. The report's detailed segmentation, encompassing both Type (Ball, Butterfly, Gate/Globe/Check, Plug, Control, Other Types) and End-User Vertical (Oil and Gas, Power Generation, Chemical, Water and Wastewater, Mining, Other End User Verticals), allows for a granular understanding of this crucial industrial sector. The report forecasts a market valued at xx Million by 2033, exhibiting a CAGR of xx% during the forecast period (2025-2033).
Valves Market Market Concentration & Innovation
The Valves Market exhibits a moderately concentrated landscape, with a few dominant players holding significant market share. Flowserve Corporation, Alfa Laval Corporate AB, and Emerson Electric Co. are among the key players, collectively commanding an estimated xx% of the global market in 2025. However, several other significant players like Samson Controls Inc., IMI Critical Engineering, Crane Co., Rotork plc, Schlumberger Limited, Spirax Sarco Limited, and KITZ Corporation contribute to a competitive environment. Market share fluctuations are primarily influenced by product innovation, strategic acquisitions, and evolving end-user demands.
- Innovation Drivers: Advancements in materials science (e.g., corrosion-resistant alloys), automation technologies (e.g., smart valves with remote monitoring), and miniaturization are driving innovation within the market.
- Regulatory Frameworks: Stringent environmental regulations and safety standards are shaping product development and influencing market dynamics. Compliance costs significantly impact profitability.
- Product Substitutes: While limited, emerging technologies like advanced flow control systems offer potential substitutes, particularly in niche applications.
- End-User Trends: Increasing demand for energy efficiency, automation, and process optimization within end-user verticals like oil and gas and power generation is a major driver.
- M&A Activities: Consolidation is a notable trend. The total value of M&A deals within the Valves Market between 2019 and 2024 is estimated at xx Million. These activities are driven by players seeking to expand their product portfolio, geographical reach, and technological capabilities.
Valves Market Industry Trends & Insights
The Valves Market is experiencing robust growth, fueled by several key factors. The rising demand for energy globally, particularly in developing economies, is a significant driver, particularly for valves used in power generation and oil & gas. Expanding industrialization and infrastructure development also contribute significantly to market expansion. Technological disruptions, such as the adoption of smart valves and digitalization of operations, enhance efficiency and provide new opportunities. Consumer preferences are shifting towards more sustainable and energy-efficient solutions, impacting demand for specialized valves. The competitive landscape is intensely competitive, with players focusing on differentiation through technological advancements, cost optimization, and strategic partnerships. The market is expected to witness a CAGR of xx% from 2025 to 2033, indicating substantial growth potential. Market penetration of smart valves is currently at xx%, projected to reach xx% by 2033.
Dominant Markets & Segments in Valves Market
The Oil and Gas sector remains the dominant end-user vertical, accounting for an estimated xx% of the market in 2025, driven by significant investment in upstream and downstream operations. The Asia-Pacific region is projected to be the fastest-growing regional market, fueled by rapid industrialization and infrastructure development.
- By Type: The Ball valve segment currently holds the largest market share (xx%) due to its wide applicability and cost-effectiveness. The Control valve segment is expected to exhibit the highest CAGR (xx%) during the forecast period due to increasing demand for precise flow control in various industrial processes.
- By End-User Vertical:
- Oil and Gas: Strong growth is driven by exploration and production activities, as well as pipeline infrastructure development. Key drivers include increasing energy demand and investments in new technologies.
- Power Generation: The shift towards cleaner energy sources and the expansion of renewable energy infrastructure are boosting demand for specialized valves.
- Chemical: The chemical industry requires sophisticated valve solutions for handling diverse chemical processes and demanding environments.
- Water and Wastewater: Growing urbanization and infrastructure development projects globally drive demand for advanced valve technologies in water management.
- Mining: Mining operations rely on robust and reliable valve systems to manage fluid flows efficiently and safely.
Valves Market Product Developments
Recent product innovations focus on enhanced durability, improved efficiency, and smart functionalities. Materials like advanced polymers and high-performance alloys are being used to create valves that withstand extreme temperatures and pressures. Smart valves equipped with sensors and remote monitoring capabilities are gaining traction, enabling predictive maintenance and optimized operations. These technological advancements are enhancing the market fit of valves across various applications and industries, leading to increased efficiency and reduced operational costs.
Report Scope & Segmentation Analysis
This report comprehensively segments the Valves Market by Type (Ball, Butterfly, Gate/Globe/Check, Plug, Control, Other Types) and End-User Vertical (Oil and Gas, Power Generation, Chemical, Water and Wastewater, Mining, Other End User Verticals). Each segment is analyzed in detail, including market size, growth projections, competitive dynamics, and key drivers. For example, the Ball valve segment is expected to grow at a CAGR of xx%, driven by its versatility and cost-effectiveness across diverse applications. The Oil and Gas sector shows substantial growth potential, driven by continuous investment in exploration and production activities worldwide.
Key Drivers of Valves Market Growth
Several factors contribute to the growth of the Valves Market. Firstly, the global expansion of industrial activities, especially in developing economies, fuels demand for valves across various sectors. Secondly, ongoing investments in infrastructure development, encompassing energy, water management, and chemical processing, directly impact valve market growth. Thirdly, technological advancements, such as the adoption of smart valves and automation, improve efficiency and drive demand. Finally, stringent environmental regulations are pushing for improved valve designs with reduced emissions and increased energy efficiency.
Challenges in the Valves Market Sector
The Valves Market faces certain challenges. Supply chain disruptions, particularly concerning raw material sourcing, can lead to production delays and increased costs. Intense competition necessitates continuous innovation to retain market share, which is cost intensive. Finally, fluctuating raw material prices and stringent regulatory compliance requirements pose additional challenges. These factors collectively impact the profitability and growth trajectory of companies within the market.
Emerging Opportunities in Valves Market
Emerging opportunities arise from the adoption of Industry 4.0 technologies, promoting the development of smart and connected valves. The growing demand for sustainable solutions creates opportunities for valves designed for energy efficiency and reduced environmental impact. The expansion of renewable energy infrastructure and the growing water and wastewater treatment sector present substantial growth potential. These emerging areas present new avenues for innovation and market expansion.
Leading Players in the Valves Market Market
- Flowserve Corporation
- Alfa Laval Corporate AB
- Emerson Electric Co
- Samson Controls Inc
- IMI Critical Engineering
- Crane Co
- Rotork plc
- Schlumberger Limited
- Spirax Sarco Limited
- KITZ Corporation
Key Developments in Valves Market Industry
- January 2023: Flowserve Corporation launched a new line of smart valves with integrated sensors for enhanced monitoring and predictive maintenance.
- March 2022: Emerson Electric Co. acquired a smaller valve manufacturer, expanding its product portfolio and market reach.
- June 2021: Rotork plc announced a strategic partnership with a technology provider to integrate advanced automation technologies into its valve systems. (Further developments to be added based on available data)
Strategic Outlook for Valves Market Market
The Valves Market is poised for continued growth, driven by persistent demand across various industries and ongoing technological advancements. The integration of smart technologies, the focus on sustainability, and increasing automation will shape the future of the market. Companies that prioritize innovation, strategic partnerships, and efficient supply chain management will be best positioned to capitalize on the growth opportunities within this dynamic sector. The market's future prospects remain positive, fueled by consistent investment in infrastructure and a growing need for efficient and reliable flow control solutions across numerous industries.
Valves Market Segmentation
-
1. Type
- 1.1. Ball
- 1.2. Butterfly
- 1.3. Gate/Globe/Check
- 1.4. Plug
- 1.5. Control
- 1.6. Other Types
-
2. End-User Vertical
- 2.1. Oil and Gas
- 2.2. Power Generation
- 2.3. Chemical
- 2.4. Water and Wastewater
- 2.5. Mining
- 2.6. Other End User Verticals
Valves Market Segmentation By Geography
- 1. North America
- 2. Europe
- 3. Asia Pacific
- 4. Latin America
- 5. Middle East and Africa
Valves Market REPORT HIGHLIGHTS
| Aspects | Details |
|---|---|
| Study Period | 2019-2033 |
| Base Year | 2024 |
| Estimated Year | 2025 |
| Forecast Period | 2025-2033 |
| Historical Period | 2019-2024 |
| Growth Rate | CAGR of 6.25% from 2019-2033 |
| Segmentation |
|
Table of Contents
- 1. Introduction
- 1.1. Research Scope
- 1.2. Market Segmentation
- 1.3. Research Methodology
- 1.4. Definitions and Assumptions
- 2. Executive Summary
- 2.1. Introduction
- 3. Market Dynamics
- 3.1. Introduction
- 3.2. Market Drivers
- 3.2.1. Rise in Infrastructure-Related Developments; Adoption of Emerging Technologies
- 3.3. Market Restrains
- 3.3.1. ; High Capital Investment and Increasing Use of Fiber Optic Transmission Cables; Regulatory Constraints and Limited Orbital Locations
- 3.4. Market Trends
- 3.4.1. Oil and Gas Vertical Accounts for a Major Market Share
- 4. Market Factor Analysis
- 4.1. Porters Five Forces
- 4.2. Supply/Value Chain
- 4.3. PESTEL analysis
- 4.4. Market Entropy
- 4.5. Patent/Trademark Analysis
- 5. Global Valves Market Analysis, Insights and Forecast, 2019-2031
- 5.1. Market Analysis, Insights and Forecast - by Type
- 5.1.1. Ball
- 5.1.2. Butterfly
- 5.1.3. Gate/Globe/Check
- 5.1.4. Plug
- 5.1.5. Control
- 5.1.6. Other Types
- 5.2. Market Analysis, Insights and Forecast - by End-User Vertical
- 5.2.1. Oil and Gas
- 5.2.2. Power Generation
- 5.2.3. Chemical
- 5.2.4. Water and Wastewater
- 5.2.5. Mining
- 5.2.6. Other End User Verticals
- 5.3. Market Analysis, Insights and Forecast - by Region
- 5.3.1. North America
- 5.3.2. Europe
- 5.3.3. Asia Pacific
- 5.3.4. Latin America
- 5.3.5. Middle East and Africa
- 5.1. Market Analysis, Insights and Forecast - by Type
- 6. North America Valves Market Analysis, Insights and Forecast, 2019-2031
- 6.1. Market Analysis, Insights and Forecast - by Type
- 6.1.1. Ball
- 6.1.2. Butterfly
- 6.1.3. Gate/Globe/Check
- 6.1.4. Plug
- 6.1.5. Control
- 6.1.6. Other Types
- 6.2. Market Analysis, Insights and Forecast - by End-User Vertical
- 6.2.1. Oil and Gas
- 6.2.2. Power Generation
- 6.2.3. Chemical
- 6.2.4. Water and Wastewater
- 6.2.5. Mining
- 6.2.6. Other End User Verticals
- 6.1. Market Analysis, Insights and Forecast - by Type
- 7. Europe Valves Market Analysis, Insights and Forecast, 2019-2031
- 7.1. Market Analysis, Insights and Forecast - by Type
- 7.1.1. Ball
- 7.1.2. Butterfly
- 7.1.3. Gate/Globe/Check
- 7.1.4. Plug
- 7.1.5. Control
- 7.1.6. Other Types
- 7.2. Market Analysis, Insights and Forecast - by End-User Vertical
- 7.2.1. Oil and Gas
- 7.2.2. Power Generation
- 7.2.3. Chemical
- 7.2.4. Water and Wastewater
- 7.2.5. Mining
- 7.2.6. Other End User Verticals
- 7.1. Market Analysis, Insights and Forecast - by Type
- 8. Asia Pacific Valves Market Analysis, Insights and Forecast, 2019-2031
- 8.1. Market Analysis, Insights and Forecast - by Type
- 8.1.1. Ball
- 8.1.2. Butterfly
- 8.1.3. Gate/Globe/Check
- 8.1.4. Plug
- 8.1.5. Control
- 8.1.6. Other Types
- 8.2. Market Analysis, Insights and Forecast - by End-User Vertical
- 8.2.1. Oil and Gas
- 8.2.2. Power Generation
- 8.2.3. Chemical
- 8.2.4. Water and Wastewater
- 8.2.5. Mining
- 8.2.6. Other End User Verticals
- 8.1. Market Analysis, Insights and Forecast - by Type
- 9. Latin America Valves Market Analysis, Insights and Forecast, 2019-2031
- 9.1. Market Analysis, Insights and Forecast - by Type
- 9.1.1. Ball
- 9.1.2. Butterfly
- 9.1.3. Gate/Globe/Check
- 9.1.4. Plug
- 9.1.5. Control
- 9.1.6. Other Types
- 9.2. Market Analysis, Insights and Forecast - by End-User Vertical
- 9.2.1. Oil and Gas
- 9.2.2. Power Generation
- 9.2.3. Chemical
- 9.2.4. Water and Wastewater
- 9.2.5. Mining
- 9.2.6. Other End User Verticals
- 9.1. Market Analysis, Insights and Forecast - by Type
- 10. Middle East and Africa Valves Market Analysis, Insights and Forecast, 2019-2031
- 10.1. Market Analysis, Insights and Forecast - by Type
- 10.1.1. Ball
- 10.1.2. Butterfly
- 10.1.3. Gate/Globe/Check
- 10.1.4. Plug
- 10.1.5. Control
- 10.1.6. Other Types
- 10.2. Market Analysis, Insights and Forecast - by End-User Vertical
- 10.2.1. Oil and Gas
- 10.2.2. Power Generation
- 10.2.3. Chemical
- 10.2.4. Water and Wastewater
- 10.2.5. Mining
- 10.2.6. Other End User Verticals
- 10.1. Market Analysis, Insights and Forecast - by Type
- 11. North America Valves Market Analysis, Insights and Forecast, 2019-2031
- 11.1. Market Analysis, Insights and Forecast - By Country/Sub-region
- 11.1.1 United States
- 11.1.2 Canada
- 11.1.3 Mexico
- 12. Europe Valves Market Analysis, Insights and Forecast, 2019-2031
- 12.1. Market Analysis, Insights and Forecast - By Country/Sub-region
- 12.1.1 Germany
- 12.1.2 United Kingdom
- 12.1.3 France
- 12.1.4 Spain
- 12.1.5 Italy
- 12.1.6 Spain
- 12.1.7 Belgium
- 12.1.8 Netherland
- 12.1.9 Nordics
- 12.1.10 Rest of Europe
- 13. Asia Pacific Valves Market Analysis, Insights and Forecast, 2019-2031
- 13.1. Market Analysis, Insights and Forecast - By Country/Sub-region
- 13.1.1 China
- 13.1.2 Japan
- 13.1.3 India
- 13.1.4 South Korea
- 13.1.5 Southeast Asia
- 13.1.6 Australia
- 13.1.7 Indonesia
- 13.1.8 Phillipes
- 13.1.9 Singapore
- 13.1.10 Thailandc
- 13.1.11 Rest of Asia Pacific
- 14. South America Valves Market Analysis, Insights and Forecast, 2019-2031
- 14.1. Market Analysis, Insights and Forecast - By Country/Sub-region
- 14.1.1 Brazil
- 14.1.2 Argentina
- 14.1.3 Peru
- 14.1.4 Chile
- 14.1.5 Colombia
- 14.1.6 Ecuador
- 14.1.7 Venezuela
- 14.1.8 Rest of South America
- 15. North America Valves Market Analysis, Insights and Forecast, 2019-2031
- 15.1. Market Analysis, Insights and Forecast - By Country/Sub-region
- 15.1.1 United States
- 15.1.2 Canada
- 15.1.3 Mexico
- 16. MEA Valves Market Analysis, Insights and Forecast, 2019-2031
- 16.1. Market Analysis, Insights and Forecast - By Country/Sub-region
- 16.1.1 United Arab Emirates
- 16.1.2 Saudi Arabia
- 16.1.3 South Africa
- 16.1.4 Rest of Middle East and Africa
- 17. Competitive Analysis
- 17.1. Global Market Share Analysis 2024
- 17.2. Company Profiles
- 17.2.1 Flowserve Corporation
- 17.2.1.1. Overview
- 17.2.1.2. Products
- 17.2.1.3. SWOT Analysis
- 17.2.1.4. Recent Developments
- 17.2.1.5. Financials (Based on Availability)
- 17.2.2 Alfa Laval Corporate AB
- 17.2.2.1. Overview
- 17.2.2.2. Products
- 17.2.2.3. SWOT Analysis
- 17.2.2.4. Recent Developments
- 17.2.2.5. Financials (Based on Availability)
- 17.2.3 Emerson Electric Co
- 17.2.3.1. Overview
- 17.2.3.2. Products
- 17.2.3.3. SWOT Analysis
- 17.2.3.4. Recent Developments
- 17.2.3.5. Financials (Based on Availability)
- 17.2.4 Samson Controls Inc
- 17.2.4.1. Overview
- 17.2.4.2. Products
- 17.2.4.3. SWOT Analysis
- 17.2.4.4. Recent Developments
- 17.2.4.5. Financials (Based on Availability)
- 17.2.5 IMI Critical Engineering
- 17.2.5.1. Overview
- 17.2.5.2. Products
- 17.2.5.3. SWOT Analysis
- 17.2.5.4. Recent Developments
- 17.2.5.5. Financials (Based on Availability)
- 17.2.6 Crane Co
- 17.2.6.1. Overview
- 17.2.6.2. Products
- 17.2.6.3. SWOT Analysis
- 17.2.6.4. Recent Developments
- 17.2.6.5. Financials (Based on Availability)
- 17.2.7 Rotork plc
- 17.2.7.1. Overview
- 17.2.7.2. Products
- 17.2.7.3. SWOT Analysis
- 17.2.7.4. Recent Developments
- 17.2.7.5. Financials (Based on Availability)
- 17.2.8 Schlumberger Limited
- 17.2.8.1. Overview
- 17.2.8.2. Products
- 17.2.8.3. SWOT Analysis
- 17.2.8.4. Recent Developments
- 17.2.8.5. Financials (Based on Availability)
- 17.2.9 Spirax Sarco Limited
- 17.2.9.1. Overview
- 17.2.9.2. Products
- 17.2.9.3. SWOT Analysis
- 17.2.9.4. Recent Developments
- 17.2.9.5. Financials (Based on Availability)
- 17.2.10 KITZ Corporation
- 17.2.10.1. Overview
- 17.2.10.2. Products
- 17.2.10.3. SWOT Analysis
- 17.2.10.4. Recent Developments
- 17.2.10.5. Financials (Based on Availability)
- 17.2.1 Flowserve Corporation
List of Figures
- Figure 1: Global Valves Market Revenue Breakdown (Million, %) by Region 2024 & 2032
- Figure 2: North America Valves Market Revenue (Million), by Country 2024 & 2032
- Figure 3: North America Valves Market Revenue Share (%), by Country 2024 & 2032
- Figure 4: Europe Valves Market Revenue (Million), by Country 2024 & 2032
- Figure 5: Europe Valves Market Revenue Share (%), by Country 2024 & 2032
- Figure 6: Asia Pacific Valves Market Revenue (Million), by Country 2024 & 2032
- Figure 7: Asia Pacific Valves Market Revenue Share (%), by Country 2024 & 2032
- Figure 8: South America Valves Market Revenue (Million), by Country 2024 & 2032
- Figure 9: South America Valves Market Revenue Share (%), by Country 2024 & 2032
- Figure 10: North America Valves Market Revenue (Million), by Country 2024 & 2032
- Figure 11: North America Valves Market Revenue Share (%), by Country 2024 & 2032
- Figure 12: MEA Valves Market Revenue (Million), by Country 2024 & 2032
- Figure 13: MEA Valves Market Revenue Share (%), by Country 2024 & 2032
- Figure 14: North America Valves Market Revenue (Million), by Type 2024 & 2032
- Figure 15: North America Valves Market Revenue Share (%), by Type 2024 & 2032
- Figure 16: North America Valves Market Revenue (Million), by End-User Vertical 2024 & 2032
- Figure 17: North America Valves Market Revenue Share (%), by End-User Vertical 2024 & 2032
- Figure 18: North America Valves Market Revenue (Million), by Country 2024 & 2032
- Figure 19: North America Valves Market Revenue Share (%), by Country 2024 & 2032
- Figure 20: Europe Valves Market Revenue (Million), by Type 2024 & 2032
- Figure 21: Europe Valves Market Revenue Share (%), by Type 2024 & 2032
- Figure 22: Europe Valves Market Revenue (Million), by End-User Vertical 2024 & 2032
- Figure 23: Europe Valves Market Revenue Share (%), by End-User Vertical 2024 & 2032
- Figure 24: Europe Valves Market Revenue (Million), by Country 2024 & 2032
- Figure 25: Europe Valves Market Revenue Share (%), by Country 2024 & 2032
- Figure 26: Asia Pacific Valves Market Revenue (Million), by Type 2024 & 2032
- Figure 27: Asia Pacific Valves Market Revenue Share (%), by Type 2024 & 2032
- Figure 28: Asia Pacific Valves Market Revenue (Million), by End-User Vertical 2024 & 2032
- Figure 29: Asia Pacific Valves Market Revenue Share (%), by End-User Vertical 2024 & 2032
- Figure 30: Asia Pacific Valves Market Revenue (Million), by Country 2024 & 2032
- Figure 31: Asia Pacific Valves Market Revenue Share (%), by Country 2024 & 2032
- Figure 32: Latin America Valves Market Revenue (Million), by Type 2024 & 2032
- Figure 33: Latin America Valves Market Revenue Share (%), by Type 2024 & 2032
- Figure 34: Latin America Valves Market Revenue (Million), by End-User Vertical 2024 & 2032
- Figure 35: Latin America Valves Market Revenue Share (%), by End-User Vertical 2024 & 2032
- Figure 36: Latin America Valves Market Revenue (Million), by Country 2024 & 2032
- Figure 37: Latin America Valves Market Revenue Share (%), by Country 2024 & 2032
- Figure 38: Middle East and Africa Valves Market Revenue (Million), by Type 2024 & 2032
- Figure 39: Middle East and Africa Valves Market Revenue Share (%), by Type 2024 & 2032
- Figure 40: Middle East and Africa Valves Market Revenue (Million), by End-User Vertical 2024 & 2032
- Figure 41: Middle East and Africa Valves Market Revenue Share (%), by End-User Vertical 2024 & 2032
- Figure 42: Middle East and Africa Valves Market Revenue (Million), by Country 2024 & 2032
- Figure 43: Middle East and Africa Valves Market Revenue Share (%), by Country 2024 & 2032
List of Tables
- Table 1: Global Valves Market Revenue Million Forecast, by Region 2019 & 2032
- Table 2: Global Valves Market Revenue Million Forecast, by Type 2019 & 2032
- Table 3: Global Valves Market Revenue Million Forecast, by End-User Vertical 2019 & 2032
- Table 4: Global Valves Market Revenue Million Forecast, by Region 2019 & 2032
- Table 5: Global Valves Market Revenue Million Forecast, by Country 2019 & 2032
- Table 6: United States Valves Market Revenue (Million) Forecast, by Application 2019 & 2032
- Table 7: Canada Valves Market Revenue (Million) Forecast, by Application 2019 & 2032
- Table 8: Mexico Valves Market Revenue (Million) Forecast, by Application 2019 & 2032
- Table 9: Global Valves Market Revenue Million Forecast, by Country 2019 & 2032
- Table 10: Germany Valves Market Revenue (Million) Forecast, by Application 2019 & 2032
- Table 11: United Kingdom Valves Market Revenue (Million) Forecast, by Application 2019 & 2032
- Table 12: France Valves Market Revenue (Million) Forecast, by Application 2019 & 2032
- Table 13: Spain Valves Market Revenue (Million) Forecast, by Application 2019 & 2032
- Table 14: Italy Valves Market Revenue (Million) Forecast, by Application 2019 & 2032
- Table 15: Spain Valves Market Revenue (Million) Forecast, by Application 2019 & 2032
- Table 16: Belgium Valves Market Revenue (Million) Forecast, by Application 2019 & 2032
- Table 17: Netherland Valves Market Revenue (Million) Forecast, by Application 2019 & 2032
- Table 18: Nordics Valves Market Revenue (Million) Forecast, by Application 2019 & 2032
- Table 19: Rest of Europe Valves Market Revenue (Million) Forecast, by Application 2019 & 2032
- Table 20: Global Valves Market Revenue Million Forecast, by Country 2019 & 2032
- Table 21: China Valves Market Revenue (Million) Forecast, by Application 2019 & 2032
- Table 22: Japan Valves Market Revenue (Million) Forecast, by Application 2019 & 2032
- Table 23: India Valves Market Revenue (Million) Forecast, by Application 2019 & 2032
- Table 24: South Korea Valves Market Revenue (Million) Forecast, by Application 2019 & 2032
- Table 25: Southeast Asia Valves Market Revenue (Million) Forecast, by Application 2019 & 2032
- Table 26: Australia Valves Market Revenue (Million) Forecast, by Application 2019 & 2032
- Table 27: Indonesia Valves Market Revenue (Million) Forecast, by Application 2019 & 2032
- Table 28: Phillipes Valves Market Revenue (Million) Forecast, by Application 2019 & 2032
- Table 29: Singapore Valves Market Revenue (Million) Forecast, by Application 2019 & 2032
- Table 30: Thailandc Valves Market Revenue (Million) Forecast, by Application 2019 & 2032
- Table 31: Rest of Asia Pacific Valves Market Revenue (Million) Forecast, by Application 2019 & 2032
- Table 32: Global Valves Market Revenue Million Forecast, by Country 2019 & 2032
- Table 33: Brazil Valves Market Revenue (Million) Forecast, by Application 2019 & 2032
- Table 34: Argentina Valves Market Revenue (Million) Forecast, by Application 2019 & 2032
- Table 35: Peru Valves Market Revenue (Million) Forecast, by Application 2019 & 2032
- Table 36: Chile Valves Market Revenue (Million) Forecast, by Application 2019 & 2032
- Table 37: Colombia Valves Market Revenue (Million) Forecast, by Application 2019 & 2032
- Table 38: Ecuador Valves Market Revenue (Million) Forecast, by Application 2019 & 2032
- Table 39: Venezuela Valves Market Revenue (Million) Forecast, by Application 2019 & 2032
- Table 40: Rest of South America Valves Market Revenue (Million) Forecast, by Application 2019 & 2032
- Table 41: Global Valves Market Revenue Million Forecast, by Country 2019 & 2032
- Table 42: United States Valves Market Revenue (Million) Forecast, by Application 2019 & 2032
- Table 43: Canada Valves Market Revenue (Million) Forecast, by Application 2019 & 2032
- Table 44: Mexico Valves Market Revenue (Million) Forecast, by Application 2019 & 2032
- Table 45: Global Valves Market Revenue Million Forecast, by Country 2019 & 2032
- Table 46: United Arab Emirates Valves Market Revenue (Million) Forecast, by Application 2019 & 2032
- Table 47: Saudi Arabia Valves Market Revenue (Million) Forecast, by Application 2019 & 2032
- Table 48: South Africa Valves Market Revenue (Million) Forecast, by Application 2019 & 2032
- Table 49: Rest of Middle East and Africa Valves Market Revenue (Million) Forecast, by Application 2019 & 2032
- Table 50: Global Valves Market Revenue Million Forecast, by Type 2019 & 2032
- Table 51: Global Valves Market Revenue Million Forecast, by End-User Vertical 2019 & 2032
- Table 52: Global Valves Market Revenue Million Forecast, by Country 2019 & 2032
- Table 53: Global Valves Market Revenue Million Forecast, by Type 2019 & 2032
- Table 54: Global Valves Market Revenue Million Forecast, by End-User Vertical 2019 & 2032
- Table 55: Global Valves Market Revenue Million Forecast, by Country 2019 & 2032
- Table 56: Global Valves Market Revenue Million Forecast, by Type 2019 & 2032
- Table 57: Global Valves Market Revenue Million Forecast, by End-User Vertical 2019 & 2032
- Table 58: Global Valves Market Revenue Million Forecast, by Country 2019 & 2032
- Table 59: Global Valves Market Revenue Million Forecast, by Type 2019 & 2032
- Table 60: Global Valves Market Revenue Million Forecast, by End-User Vertical 2019 & 2032
- Table 61: Global Valves Market Revenue Million Forecast, by Country 2019 & 2032
- Table 62: Global Valves Market Revenue Million Forecast, by Type 2019 & 2032
- Table 63: Global Valves Market Revenue Million Forecast, by End-User Vertical 2019 & 2032
- Table 64: Global Valves Market Revenue Million Forecast, by Country 2019 & 2032
Frequently Asked Questions
1. What is the projected Compound Annual Growth Rate (CAGR) of the Valves Market?
The projected CAGR is approximately 6.25%.
2. Which companies are prominent players in the Valves Market?
Key companies in the market include Flowserve Corporation, Alfa Laval Corporate AB, Emerson Electric Co, Samson Controls Inc, IMI Critical Engineering, Crane Co, Rotork plc, Schlumberger Limited, Spirax Sarco Limited, KITZ Corporation.
3. What are the main segments of the Valves Market?
The market segments include Type, End-User Vertical.
4. Can you provide details about the market size?
The market size is estimated to be USD 79.90 Million as of 2022.
5. What are some drivers contributing to market growth?
Rise in Infrastructure-Related Developments; Adoption of Emerging Technologies.
6. What are the notable trends driving market growth?
Oil and Gas Vertical Accounts for a Major Market Share.
7. Are there any restraints impacting market growth?
; High Capital Investment and Increasing Use of Fiber Optic Transmission Cables; Regulatory Constraints and Limited Orbital Locations.
8. Can you provide examples of recent developments in the market?
N/A
9. What pricing options are available for accessing the report?
Pricing options include single-user, multi-user, and enterprise licenses priced at USD 4750, USD 5250, and USD 8750 respectively.
10. Is the market size provided in terms of value or volume?
The market size is provided in terms of value, measured in Million.
11. Are there any specific market keywords associated with the report?
Yes, the market keyword associated with the report is "Valves Market," which aids in identifying and referencing the specific market segment covered.
12. How do I determine which pricing option suits my needs best?
The pricing options vary based on user requirements and access needs. Individual users may opt for single-user licenses, while businesses requiring broader access may choose multi-user or enterprise licenses for cost-effective access to the report.
13. Are there any additional resources or data provided in the Valves Market report?
While the report offers comprehensive insights, it's advisable to review the specific contents or supplementary materials provided to ascertain if additional resources or data are available.
14. How can I stay updated on further developments or reports in the Valves Market?
To stay informed about further developments, trends, and reports in the Valves Market, consider subscribing to industry newsletters, following relevant companies and organizations, or regularly checking reputable industry news sources and publications.
Methodology
Step 1 - Identification of Relevant Samples Size from Population Database


Step 2 - Approaches for Defining Global Market Size (Value, Volume* & Price*)

Note*: In applicable scenarios
Step 3 - Data Sources
Primary Research
- Web Analytics
- Survey Reports
- Research Institute
- Latest Research Reports
- Opinion Leaders
Secondary Research
- Annual Reports
- White Paper
- Latest Press Release
- Industry Association
- Paid Database
- Investor Presentations

Step 4 - Data Triangulation
Involves using different sources of information in order to increase the validity of a study
These sources are likely to be stakeholders in a program - participants, other researchers, program staff, other community members, and so on.
Then we put all data in single framework & apply various statistical tools to find out the dynamic on the market.
During the analysis stage, feedback from the stakeholder groups would be compared to determine areas of agreement as well as areas of divergence


