

Key Insights
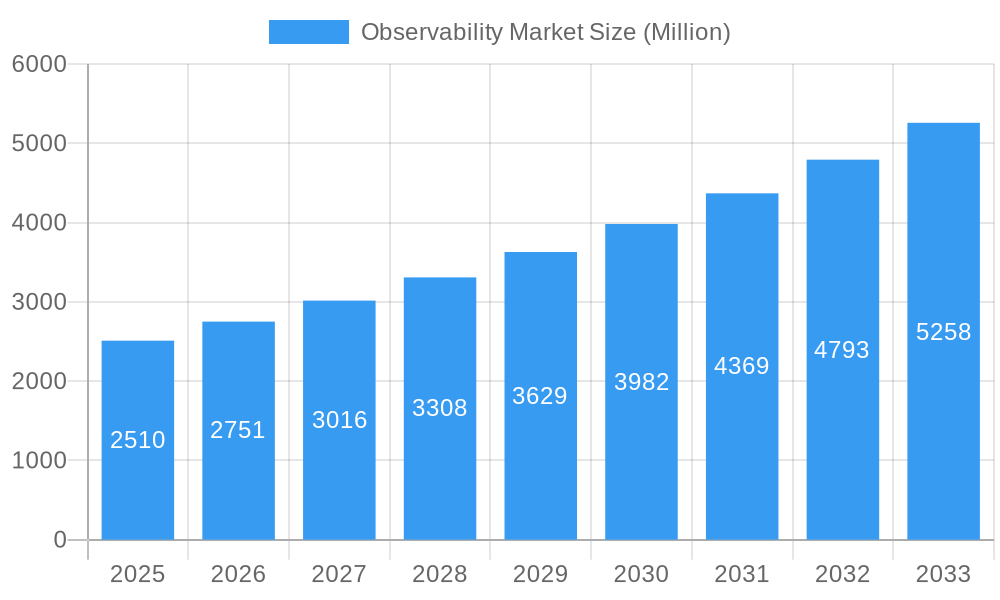
The global observability market is experiencing robust growth, projected to reach $2.51 billion in 2025 and maintain a Compound Annual Growth Rate (CAGR) of 9.73% from 2025 to 2033. This expansion is driven by several key factors. The increasing adoption of cloud-native architectures and microservices necessitates comprehensive monitoring and troubleshooting capabilities, fueling demand for observability solutions. Furthermore, the growing complexity of IT infrastructure, coupled with the rise of DevOps and the need for faster application deployments, underscores the critical role of observability in ensuring application performance and reliability. The market's growth is further propelled by the emergence of advanced analytics and artificial intelligence (AI) within observability platforms, enabling proactive issue identification and improved operational efficiency. Leading players like Broadcom, Dynatrace, GitLab, IBM, and Splunk are actively investing in innovation and expanding their offerings to cater to this expanding market.
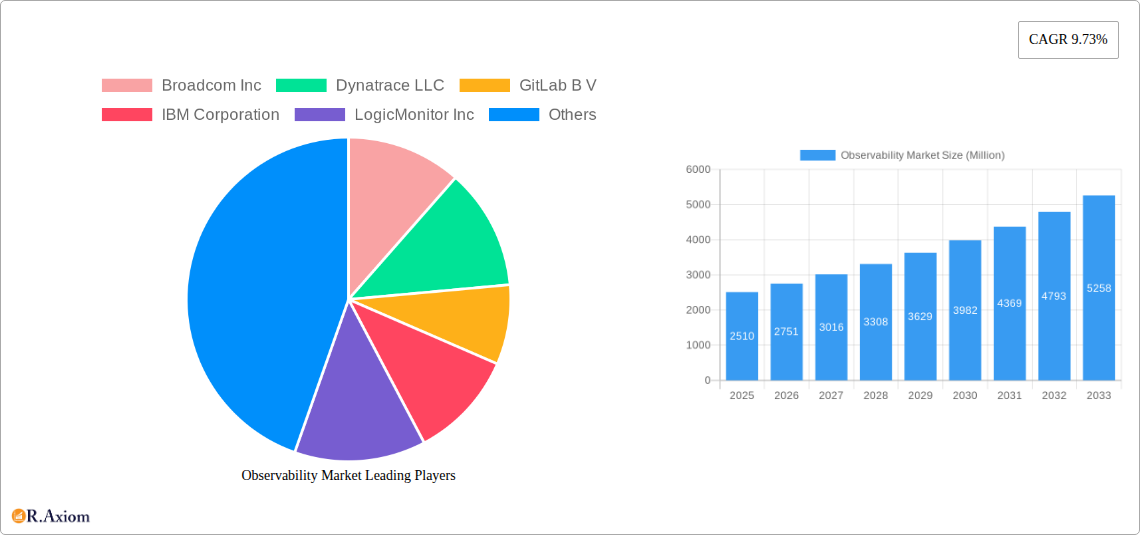
Observability Market Market Size (In Billion)
The competitive landscape is characterized by both established players and emerging startups, resulting in a dynamic environment of innovation. While the dominance of established vendors is undeniable, innovative solutions from smaller companies are disrupting the market with specialized capabilities and competitive pricing. Market segmentation is likely evolving around deployment models (cloud, on-premise, hybrid), application types (web, mobile, IoT), and industry verticals (finance, healthcare, retail). Despite the growth trajectory, market restraints exist. These include the complexity of implementing observability solutions, the need for specialized skillsets to effectively utilize these tools, and concerns regarding data security and privacy in relation to the vast amounts of data collected. Overcoming these challenges will be crucial for sustained market growth in the coming years.
Observability Market Company Market Share
Observability Market: A Comprehensive Report (2019-2033)
This comprehensive report provides an in-depth analysis of the Observability Market, covering the period from 2019 to 2033. It delves into market dynamics, segmentation, leading players, and future growth prospects, offering actionable insights for stakeholders across the industry. The report utilizes data from the historical period (2019-2024), the base year (2025), and the estimated year (2025) to project the forecast period (2025-2033). The market is valued at xx Million in 2025 and is projected to reach xx Million by 2033, exhibiting a CAGR of xx%.
Observability Market Concentration & Innovation
The Observability market is characterized by a moderately consolidated landscape, with several key players holding significant market share. While precise market share figures for each company require further proprietary data analysis, preliminary estimations suggest that companies like Splunk Inc, Dynatrace LLC, and Datadog (not explicitly listed but a major player) hold substantial portions. The market's innovation is driven by several factors: the increasing complexity of cloud-native architectures, the demand for improved application performance monitoring, and the rise of AI/ML-powered analytics for faster troubleshooting. Regulatory frameworks, particularly around data privacy and security, influence product development and market adoption. Product substitutes, such as traditional monitoring tools, are losing ground to comprehensive observability solutions. End-user trends indicate a strong preference for integrated platforms offering comprehensive insights across logs, metrics, and traces. M&A activity in the sector, such as the StackState acquisition by SUSE (discussed in detail later), demonstrates a consolidation trend and an attempt to expand functionalities within existing platforms. While exact M&A deal values are not publicly available for all deals in this space, estimations suggest values ranging from tens of Millions to hundreds of Millions USD depending on the size and scope of the companies involved.
- Market Concentration: Moderately consolidated, with a few major players dominating.
- Innovation Drivers: Cloud-native adoption, performance demands, AI/ML, data privacy regulations.
- M&A Activity: Ongoing consolidation, with deals valued from tens to hundreds of Millions USD.
- Product Substitutes: Traditional monitoring tools are being replaced by comprehensive observability solutions.
Observability Market Industry Trends & Insights
The Observability market is experiencing robust growth, driven by several key factors. The increasing adoption of cloud-native architectures and microservices necessitates comprehensive monitoring and troubleshooting capabilities that traditional monitoring solutions cannot provide. Furthermore, digital transformation initiatives across various industries are fueling demand for improved application performance and reliability. The incorporation of AI/ML technologies is enhancing anomaly detection and root cause analysis, significantly improving the efficiency of IT operations. Consumer preference is shifting towards integrated platforms that provide a unified view of application performance, security, and infrastructure. The competitive landscape is characterized by intense competition among established players and emerging startups, leading to continuous innovation and improvements in product offerings. Market penetration varies widely across industries and geographies, with sectors like finance and technology showing higher adoption rates. The overall market growth is expected to remain strong, with a projected CAGR of xx% during the forecast period.
Dominant Markets & Segments in Observability Market
While a precise breakdown of market dominance requires specific proprietary market data analysis, preliminary assessments indicate that North America currently holds the largest share of the Observability market, followed by Europe and Asia-Pacific. Within North America, the United States likely represents the leading national market.
Key Drivers for North American Dominance:
- Early adoption of cloud technologies and digital transformation initiatives.
- High concentration of technology companies and robust IT infrastructure.
- Favorable regulatory environment and substantial investment in technological advancements.
Key Drivers for European Market Growth:
- Increasing digitalization across various sectors.
- Strong focus on data privacy and security regulations, driving demand for robust observability solutions.
- Significant investments in cloud infrastructure and digital transformation projects across the region.
Key Drivers for Asia-Pacific Market Growth:
- Rapid growth of the IT sector, particularly in emerging economies.
- Increasing adoption of cloud-based services and digital transformation initiatives.
- Government support and incentives to encourage technological advancements.
Observability Market Product Developments
Recent product innovations focus on AI-driven anomaly detection, automated root cause analysis, and improved integration with various cloud platforms. This includes features such as real-time monitoring, predictive analytics, and improved security capabilities. These advancements enhance application performance and reliability while streamlining IT operations. Market fit is largely determined by the ability to seamlessly integrate with existing infrastructure and provide actionable insights in a user-friendly format.
Report Scope & Segmentation Analysis
This report segments the Observability market by deployment type (cloud, on-premises, hybrid), organization size (small and medium enterprises (SMEs), large enterprises), component (software, services), application (application performance monitoring (APM), log management, network monitoring, infrastructure monitoring), and geography (North America, Europe, Asia Pacific, Middle East & Africa, and South America). Each segment showcases distinct growth trajectories and competitive dynamics. For instance, the cloud deployment segment is experiencing the most rapid growth, driven by the increasing adoption of cloud-based applications and infrastructure. Market sizes and growth projections vary significantly among these segments; a comprehensive breakdown requires further detailed proprietary data analysis, but estimations can be generated from existing research sources.
Key Drivers of Observability Market Growth
Several factors fuel the growth of the Observability market. These include the rising adoption of cloud-native applications and microservices, the increasing demand for improved application performance and reliability, the growing need for advanced security and compliance solutions, and the expansion of digital transformation initiatives across various sectors. The integration of AI/ML further enhances the capabilities of observability platforms, driving market expansion. Government regulations promoting digitalization also contribute significantly to overall growth.
Challenges in the Observability Market Sector
The Observability market faces several challenges including the complexity of integrating observability solutions with existing IT infrastructure, the need for skilled personnel to manage and analyze the data generated, and the high cost of implementing and maintaining comprehensive observability solutions, potentially impacting adoption among smaller organizations. Competition amongst vendors necessitates continuous innovation and differentiation. Furthermore, data privacy and security concerns can impact adoption rates. These factors can collectively impact growth by limiting market penetration to a degree.
Emerging Opportunities in Observability Market
Emerging opportunities include the expansion into new markets, such as the Internet of Things (IoT) and edge computing, as well as the development of more advanced AI/ML capabilities for predictive analytics and automated remediation. The growing focus on security and compliance also creates new avenues for growth. Increased customization and tailoring of solutions to specific industry needs, such as healthcare and finance, presents further opportunities.
Leading Players in the Observability Market Market
Key Developments in Observability Market Industry
- June 2024: SUSE acquired StackState, integrating observability capabilities into its Rancher platform for Kubernetes management. This strengthens SUSE's position in the enterprise IT market and expands the capabilities of its Rancher platform.
- May 2024: Cisco launched a new virtual appliance for its AppDynamics On-Premises offering, providing a self-hosted, AI-powered observability solution. This expands Cisco's reach to customers prioritizing on-premises solutions and highlights the increasing importance of AI in observability.
Strategic Outlook for Observability Market Market
The Observability market is poised for continued growth, driven by the increasing complexity of IT infrastructure, the rising adoption of cloud-native applications, and the growing need for advanced monitoring and troubleshooting capabilities. The integration of AI/ML will further enhance the capabilities of observability platforms, providing more accurate and actionable insights. Expansion into new markets and the development of innovative solutions will unlock further growth potential. The market's future is bright, with significant opportunities for both established players and new entrants.
Observability Market Segmentation
-
1. Type
- 1.1. Solution
- 1.2. Services
-
2. Deployment
- 2.1. Cloud
- 2.2. On-Premises
-
3. Enterprises
- 3.1. SMEs
- 3.2. Large Enterprises
-
4. End-user Vertical
- 4.1. IT and Telecom
- 4.2. Retail and E-commerce
- 4.3. Manufacturing
- 4.4. BFSI
- 4.5. Government and Defense
- 4.6. Other End-user Verticals
Observability Market Segmentation By Geography
- 1. North America
- 2. Europe
- 3. Asia
- 4. Australia and New Zealand
- 5. Latin America
- 6. Middle East and Africa
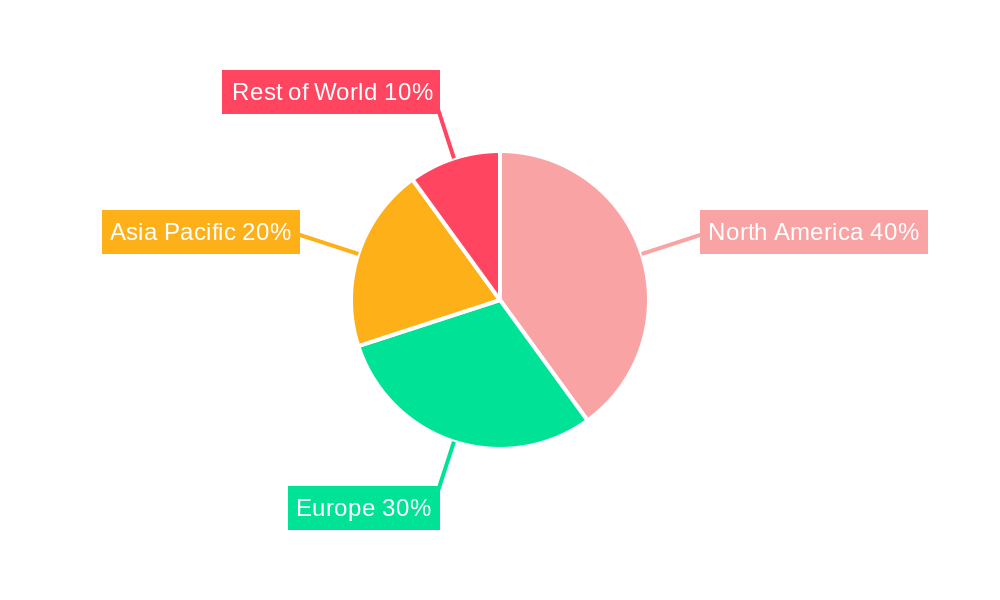
Observability Market Regional Market Share
Geographic Coverage of Observability Market
Observability Market REPORT HIGHLIGHTS
| Aspects | Details |
|---|---|
| Study Period | 2020-2034 |
| Base Year | 2025 |
| Estimated Year | 2026 |
| Forecast Period | 2026-2034 |
| Historical Period | 2020-2025 |
| Growth Rate | CAGR of 9.73% from 2020-2034 |
| Segmentation |
|
Table of Contents
- 1. Introduction
- 1.1. Research Scope
- 1.2. Market Segmentation
- 1.3. Research Objective
- 1.4. Definitions and Assumptions
- 2. Executive Summary
- 2.1. Market Snapshot
- 3. Market Dynamics
- 3.1. Market Drivers
- 3.2. Market Restrains
- 3.3. Market Trends
- 3.4. Market Opportunities
- 4. Market Factor Analysis
- 4.1. Porters Five Forces
- 4.1.1. Bargaining Power of Suppliers
- 4.1.2. Bargaining Power of Buyers
- 4.1.3. Threat of New Entrants
- 4.1.4. Threat of Substitutes
- 4.1.5. Competitive Rivalry
- 4.2. PESTEL analysis
- 4.3. BCG Analysis
- 4.3.1. Stars (High Growth, High Market Share)
- 4.3.2. Cash Cows (Low Growth, High Market Share)
- 4.3.3. Question Mark (High Growth, Low Market Share)
- 4.3.4. Dogs (Low Growth, Low Market Share)
- 4.4. Ansoff Matrix Analysis
- 4.5. Supply Chain Analysis
- 4.6. Regulatory Landscape
- 4.7. Current Market Potential and Opportunity Assessment (TAM–SAM–SOM Framework)
- 4.8. RAX Analyst Note
- 4.1. Porters Five Forces
- 5. Market Analysis, Insights and Forecast 2021-2033
- 5.1. Market Analysis, Insights and Forecast - by Type
- 5.1.1. Solution
- 5.1.2. Services
- 5.2. Market Analysis, Insights and Forecast - by Deployment
- 5.2.1. Cloud
- 5.2.2. On-Premises
- 5.3. Market Analysis, Insights and Forecast - by Enterprises
- 5.3.1. SMEs
- 5.3.2. Large Enterprises
- 5.4. Market Analysis, Insights and Forecast - by End-user Vertical
- 5.4.1. IT and Telecom
- 5.4.2. Retail and E-commerce
- 5.4.3. Manufacturing
- 5.4.4. BFSI
- 5.4.5. Government and Defense
- 5.4.6. Other End-user Verticals
- 5.5. Market Analysis, Insights and Forecast - by Region
- 5.5.1. North America
- 5.5.2. Europe
- 5.5.3. Asia
- 5.5.4. Australia and New Zealand
- 5.5.5. Latin America
- 5.5.6. Middle East and Africa
- 5.1. Market Analysis, Insights and Forecast - by Type
- 6. Global Observability Market Analysis, Insights and Forecast, 2021-2033
- 6.1. Market Analysis, Insights and Forecast - by Type
- 6.1.1. Solution
- 6.1.2. Services
- 6.2. Market Analysis, Insights and Forecast - by Deployment
- 6.2.1. Cloud
- 6.2.2. On-Premises
- 6.3. Market Analysis, Insights and Forecast - by Enterprises
- 6.3.1. SMEs
- 6.3.2. Large Enterprises
- 6.4. Market Analysis, Insights and Forecast - by End-user Vertical
- 6.4.1. IT and Telecom
- 6.4.2. Retail and E-commerce
- 6.4.3. Manufacturing
- 6.4.4. BFSI
- 6.4.5. Government and Defense
- 6.4.6. Other End-user Verticals
- 6.1. Market Analysis, Insights and Forecast - by Type
- 7. North America Observability Market Analysis, Insights and Forecast, 2020-2032
- 7.1. Market Analysis, Insights and Forecast - by Type
- 7.1.1. Solution
- 7.1.2. Services
- 7.2. Market Analysis, Insights and Forecast - by Deployment
- 7.2.1. Cloud
- 7.2.2. On-Premises
- 7.3. Market Analysis, Insights and Forecast - by Enterprises
- 7.3.1. SMEs
- 7.3.2. Large Enterprises
- 7.4. Market Analysis, Insights and Forecast - by End-user Vertical
- 7.4.1. IT and Telecom
- 7.4.2. Retail and E-commerce
- 7.4.3. Manufacturing
- 7.4.4. BFSI
- 7.4.5. Government and Defense
- 7.4.6. Other End-user Verticals
- 7.1. Market Analysis, Insights and Forecast - by Type
- 8. Europe Observability Market Analysis, Insights and Forecast, 2020-2032
- 8.1. Market Analysis, Insights and Forecast - by Type
- 8.1.1. Solution
- 8.1.2. Services
- 8.2. Market Analysis, Insights and Forecast - by Deployment
- 8.2.1. Cloud
- 8.2.2. On-Premises
- 8.3. Market Analysis, Insights and Forecast - by Enterprises
- 8.3.1. SMEs
- 8.3.2. Large Enterprises
- 8.4. Market Analysis, Insights and Forecast - by End-user Vertical
- 8.4.1. IT and Telecom
- 8.4.2. Retail and E-commerce
- 8.4.3. Manufacturing
- 8.4.4. BFSI
- 8.4.5. Government and Defense
- 8.4.6. Other End-user Verticals
- 8.1. Market Analysis, Insights and Forecast - by Type
- 9. Asia Observability Market Analysis, Insights and Forecast, 2020-2032
- 9.1. Market Analysis, Insights and Forecast - by Type
- 9.1.1. Solution
- 9.1.2. Services
- 9.2. Market Analysis, Insights and Forecast - by Deployment
- 9.2.1. Cloud
- 9.2.2. On-Premises
- 9.3. Market Analysis, Insights and Forecast - by Enterprises
- 9.3.1. SMEs
- 9.3.2. Large Enterprises
- 9.4. Market Analysis, Insights and Forecast - by End-user Vertical
- 9.4.1. IT and Telecom
- 9.4.2. Retail and E-commerce
- 9.4.3. Manufacturing
- 9.4.4. BFSI
- 9.4.5. Government and Defense
- 9.4.6. Other End-user Verticals
- 9.1. Market Analysis, Insights and Forecast - by Type
- 10. Australia and New Zealand Observability Market Analysis, Insights and Forecast, 2020-2032
- 10.1. Market Analysis, Insights and Forecast - by Type
- 10.1.1. Solution
- 10.1.2. Services
- 10.2. Market Analysis, Insights and Forecast - by Deployment
- 10.2.1. Cloud
- 10.2.2. On-Premises
- 10.3. Market Analysis, Insights and Forecast - by Enterprises
- 10.3.1. SMEs
- 10.3.2. Large Enterprises
- 10.4. Market Analysis, Insights and Forecast - by End-user Vertical
- 10.4.1. IT and Telecom
- 10.4.2. Retail and E-commerce
- 10.4.3. Manufacturing
- 10.4.4. BFSI
- 10.4.5. Government and Defense
- 10.4.6. Other End-user Verticals
- 10.1. Market Analysis, Insights and Forecast - by Type
- 11. Latin America Observability Market Analysis, Insights and Forecast, 2020-2032
- 11.1. Market Analysis, Insights and Forecast - by Type
- 11.1.1. Solution
- 11.1.2. Services
- 11.2. Market Analysis, Insights and Forecast - by Deployment
- 11.2.1. Cloud
- 11.2.2. On-Premises
- 11.3. Market Analysis, Insights and Forecast - by Enterprises
- 11.3.1. SMEs
- 11.3.2. Large Enterprises
- 11.4. Market Analysis, Insights and Forecast - by End-user Vertical
- 11.4.1. IT and Telecom
- 11.4.2. Retail and E-commerce
- 11.4.3. Manufacturing
- 11.4.4. BFSI
- 11.4.5. Government and Defense
- 11.4.6. Other End-user Verticals
- 11.1. Market Analysis, Insights and Forecast - by Type
- 12. Middle East and Africa Observability Market Analysis, Insights and Forecast, 2020-2032
- 12.1. Market Analysis, Insights and Forecast - by Type
- 12.1.1. Solution
- 12.1.2. Services
- 12.2. Market Analysis, Insights and Forecast - by Deployment
- 12.2.1. Cloud
- 12.2.2. On-Premises
- 12.3. Market Analysis, Insights and Forecast - by Enterprises
- 12.3.1. SMEs
- 12.3.2. Large Enterprises
- 12.4. Market Analysis, Insights and Forecast - by End-user Vertical
- 12.4.1. IT and Telecom
- 12.4.2. Retail and E-commerce
- 12.4.3. Manufacturing
- 12.4.4. BFSI
- 12.4.5. Government and Defense
- 12.4.6. Other End-user Verticals
- 12.1. Market Analysis, Insights and Forecast - by Type
- 13. Competitive Analysis
- 13.1. Company Profiles
- 13.1.1 Broadcom Inc
- 13.1.1.1. Company Overview
- 13.1.1.2. Products
- 13.1.1.3. Company Financials
- 13.1.1.4. SWOT Analysis
- 13.1.2 Dynatrace LLC
- 13.1.2.1. Company Overview
- 13.1.2.2. Products
- 13.1.2.3. Company Financials
- 13.1.2.4. SWOT Analysis
- 13.1.3 GitLab B V
- 13.1.3.1. Company Overview
- 13.1.3.2. Products
- 13.1.3.3. Company Financials
- 13.1.3.4. SWOT Analysis
- 13.1.4 IBM Corporation
- 13.1.4.1. Company Overview
- 13.1.4.2. Products
- 13.1.4.3. Company Financials
- 13.1.4.4. SWOT Analysis
- 13.1.5 LogicMonitor Inc
- 13.1.5.1. Company Overview
- 13.1.5.2. Products
- 13.1.5.3. Company Financials
- 13.1.5.4. SWOT Analysis
- 13.1.6 Microsoft Corporation
- 13.1.6.1. Company Overview
- 13.1.6.2. Products
- 13.1.6.3. Company Financials
- 13.1.6.4. SWOT Analysis
- 13.1.7 Monte Carlo Corporation
- 13.1.7.1. Company Overview
- 13.1.7.2. Products
- 13.1.7.3. Company Financials
- 13.1.7.4. SWOT Analysis
- 13.1.8 Riverbed Technology
- 13.1.8.1. Company Overview
- 13.1.8.2. Products
- 13.1.8.3. Company Financials
- 13.1.8.4. SWOT Analysis
- 13.1.9 ScienceLogic Inc
- 13.1.9.1. Company Overview
- 13.1.9.2. Products
- 13.1.9.3. Company Financials
- 13.1.9.4. SWOT Analysis
- 13.1.10 Splunk Inc *List Not Exhaustive
- 13.1.10.1. Company Overview
- 13.1.10.2. Products
- 13.1.10.3. Company Financials
- 13.1.10.4. SWOT Analysis
- 13.1.1 Broadcom Inc
- 13.2. Market Entropy
- 13.2.1 Company's Key Areas Served
- 13.2.2 Recent Developments
- 13.3. Company Market Share Analysis 2025
- 13.3.1 Top 5 Companies Market Share Analysis
- 13.3.2 Top 3 Companies Market Share Analysis
- 13.4. List of Potential Customers
- 14. Research Methodology
List of Figures
- Figure 1: Global Observability Market Revenue Breakdown (Million, %) by Region 2025 & 2033
- Figure 2: Global Observability Market Volume Breakdown (Billion, %) by Region 2025 & 2033
- Figure 3: North America Observability Market Revenue (Million), by Type 2025 & 2033
- Figure 4: North America Observability Market Volume (Billion), by Type 2025 & 2033
- Figure 5: North America Observability Market Revenue Share (%), by Type 2025 & 2033
- Figure 6: North America Observability Market Volume Share (%), by Type 2025 & 2033
- Figure 7: North America Observability Market Revenue (Million), by Deployment 2025 & 2033
- Figure 8: North America Observability Market Volume (Billion), by Deployment 2025 & 2033
- Figure 9: North America Observability Market Revenue Share (%), by Deployment 2025 & 2033
- Figure 10: North America Observability Market Volume Share (%), by Deployment 2025 & 2033
- Figure 11: North America Observability Market Revenue (Million), by Enterprises 2025 & 2033
- Figure 12: North America Observability Market Volume (Billion), by Enterprises 2025 & 2033
- Figure 13: North America Observability Market Revenue Share (%), by Enterprises 2025 & 2033
- Figure 14: North America Observability Market Volume Share (%), by Enterprises 2025 & 2033
- Figure 15: North America Observability Market Revenue (Million), by End-user Vertical 2025 & 2033
- Figure 16: North America Observability Market Volume (Billion), by End-user Vertical 2025 & 2033
- Figure 17: North America Observability Market Revenue Share (%), by End-user Vertical 2025 & 2033
- Figure 18: North America Observability Market Volume Share (%), by End-user Vertical 2025 & 2033
- Figure 19: North America Observability Market Revenue (Million), by Country 2025 & 2033
- Figure 20: North America Observability Market Volume (Billion), by Country 2025 & 2033
- Figure 21: North America Observability Market Revenue Share (%), by Country 2025 & 2033
- Figure 22: North America Observability Market Volume Share (%), by Country 2025 & 2033
- Figure 23: Europe Observability Market Revenue (Million), by Type 2025 & 2033
- Figure 24: Europe Observability Market Volume (Billion), by Type 2025 & 2033
- Figure 25: Europe Observability Market Revenue Share (%), by Type 2025 & 2033
- Figure 26: Europe Observability Market Volume Share (%), by Type 2025 & 2033
- Figure 27: Europe Observability Market Revenue (Million), by Deployment 2025 & 2033
- Figure 28: Europe Observability Market Volume (Billion), by Deployment 2025 & 2033
- Figure 29: Europe Observability Market Revenue Share (%), by Deployment 2025 & 2033
- Figure 30: Europe Observability Market Volume Share (%), by Deployment 2025 & 2033
- Figure 31: Europe Observability Market Revenue (Million), by Enterprises 2025 & 2033
- Figure 32: Europe Observability Market Volume (Billion), by Enterprises 2025 & 2033
- Figure 33: Europe Observability Market Revenue Share (%), by Enterprises 2025 & 2033
- Figure 34: Europe Observability Market Volume Share (%), by Enterprises 2025 & 2033
- Figure 35: Europe Observability Market Revenue (Million), by End-user Vertical 2025 & 2033
- Figure 36: Europe Observability Market Volume (Billion), by End-user Vertical 2025 & 2033
- Figure 37: Europe Observability Market Revenue Share (%), by End-user Vertical 2025 & 2033
- Figure 38: Europe Observability Market Volume Share (%), by End-user Vertical 2025 & 2033
- Figure 39: Europe Observability Market Revenue (Million), by Country 2025 & 2033
- Figure 40: Europe Observability Market Volume (Billion), by Country 2025 & 2033
- Figure 41: Europe Observability Market Revenue Share (%), by Country 2025 & 2033
- Figure 42: Europe Observability Market Volume Share (%), by Country 2025 & 2033
- Figure 43: Asia Observability Market Revenue (Million), by Type 2025 & 2033
- Figure 44: Asia Observability Market Volume (Billion), by Type 2025 & 2033
- Figure 45: Asia Observability Market Revenue Share (%), by Type 2025 & 2033
- Figure 46: Asia Observability Market Volume Share (%), by Type 2025 & 2033
- Figure 47: Asia Observability Market Revenue (Million), by Deployment 2025 & 2033
- Figure 48: Asia Observability Market Volume (Billion), by Deployment 2025 & 2033
- Figure 49: Asia Observability Market Revenue Share (%), by Deployment 2025 & 2033
- Figure 50: Asia Observability Market Volume Share (%), by Deployment 2025 & 2033
- Figure 51: Asia Observability Market Revenue (Million), by Enterprises 2025 & 2033
- Figure 52: Asia Observability Market Volume (Billion), by Enterprises 2025 & 2033
- Figure 53: Asia Observability Market Revenue Share (%), by Enterprises 2025 & 2033
- Figure 54: Asia Observability Market Volume Share (%), by Enterprises 2025 & 2033
- Figure 55: Asia Observability Market Revenue (Million), by End-user Vertical 2025 & 2033
- Figure 56: Asia Observability Market Volume (Billion), by End-user Vertical 2025 & 2033
- Figure 57: Asia Observability Market Revenue Share (%), by End-user Vertical 2025 & 2033
- Figure 58: Asia Observability Market Volume Share (%), by End-user Vertical 2025 & 2033
- Figure 59: Asia Observability Market Revenue (Million), by Country 2025 & 2033
- Figure 60: Asia Observability Market Volume (Billion), by Country 2025 & 2033
- Figure 61: Asia Observability Market Revenue Share (%), by Country 2025 & 2033
- Figure 62: Asia Observability Market Volume Share (%), by Country 2025 & 2033
- Figure 63: Australia and New Zealand Observability Market Revenue (Million), by Type 2025 & 2033
- Figure 64: Australia and New Zealand Observability Market Volume (Billion), by Type 2025 & 2033
- Figure 65: Australia and New Zealand Observability Market Revenue Share (%), by Type 2025 & 2033
- Figure 66: Australia and New Zealand Observability Market Volume Share (%), by Type 2025 & 2033
- Figure 67: Australia and New Zealand Observability Market Revenue (Million), by Deployment 2025 & 2033
- Figure 68: Australia and New Zealand Observability Market Volume (Billion), by Deployment 2025 & 2033
- Figure 69: Australia and New Zealand Observability Market Revenue Share (%), by Deployment 2025 & 2033
- Figure 70: Australia and New Zealand Observability Market Volume Share (%), by Deployment 2025 & 2033
- Figure 71: Australia and New Zealand Observability Market Revenue (Million), by Enterprises 2025 & 2033
- Figure 72: Australia and New Zealand Observability Market Volume (Billion), by Enterprises 2025 & 2033
- Figure 73: Australia and New Zealand Observability Market Revenue Share (%), by Enterprises 2025 & 2033
- Figure 74: Australia and New Zealand Observability Market Volume Share (%), by Enterprises 2025 & 2033
- Figure 75: Australia and New Zealand Observability Market Revenue (Million), by End-user Vertical 2025 & 2033
- Figure 76: Australia and New Zealand Observability Market Volume (Billion), by End-user Vertical 2025 & 2033
- Figure 77: Australia and New Zealand Observability Market Revenue Share (%), by End-user Vertical 2025 & 2033
- Figure 78: Australia and New Zealand Observability Market Volume Share (%), by End-user Vertical 2025 & 2033
- Figure 79: Australia and New Zealand Observability Market Revenue (Million), by Country 2025 & 2033
- Figure 80: Australia and New Zealand Observability Market Volume (Billion), by Country 2025 & 2033
- Figure 81: Australia and New Zealand Observability Market Revenue Share (%), by Country 2025 & 2033
- Figure 82: Australia and New Zealand Observability Market Volume Share (%), by Country 2025 & 2033
- Figure 83: Latin America Observability Market Revenue (Million), by Type 2025 & 2033
- Figure 84: Latin America Observability Market Volume (Billion), by Type 2025 & 2033
- Figure 85: Latin America Observability Market Revenue Share (%), by Type 2025 & 2033
- Figure 86: Latin America Observability Market Volume Share (%), by Type 2025 & 2033
- Figure 87: Latin America Observability Market Revenue (Million), by Deployment 2025 & 2033
- Figure 88: Latin America Observability Market Volume (Billion), by Deployment 2025 & 2033
- Figure 89: Latin America Observability Market Revenue Share (%), by Deployment 2025 & 2033
- Figure 90: Latin America Observability Market Volume Share (%), by Deployment 2025 & 2033
- Figure 91: Latin America Observability Market Revenue (Million), by Enterprises 2025 & 2033
- Figure 92: Latin America Observability Market Volume (Billion), by Enterprises 2025 & 2033
- Figure 93: Latin America Observability Market Revenue Share (%), by Enterprises 2025 & 2033
- Figure 94: Latin America Observability Market Volume Share (%), by Enterprises 2025 & 2033
- Figure 95: Latin America Observability Market Revenue (Million), by End-user Vertical 2025 & 2033
- Figure 96: Latin America Observability Market Volume (Billion), by End-user Vertical 2025 & 2033
- Figure 97: Latin America Observability Market Revenue Share (%), by End-user Vertical 2025 & 2033
- Figure 98: Latin America Observability Market Volume Share (%), by End-user Vertical 2025 & 2033
- Figure 99: Latin America Observability Market Revenue (Million), by Country 2025 & 2033
- Figure 100: Latin America Observability Market Volume (Billion), by Country 2025 & 2033
- Figure 101: Latin America Observability Market Revenue Share (%), by Country 2025 & 2033
- Figure 102: Latin America Observability Market Volume Share (%), by Country 2025 & 2033
- Figure 103: Middle East and Africa Observability Market Revenue (Million), by Type 2025 & 2033
- Figure 104: Middle East and Africa Observability Market Volume (Billion), by Type 2025 & 2033
- Figure 105: Middle East and Africa Observability Market Revenue Share (%), by Type 2025 & 2033
- Figure 106: Middle East and Africa Observability Market Volume Share (%), by Type 2025 & 2033
- Figure 107: Middle East and Africa Observability Market Revenue (Million), by Deployment 2025 & 2033
- Figure 108: Middle East and Africa Observability Market Volume (Billion), by Deployment 2025 & 2033
- Figure 109: Middle East and Africa Observability Market Revenue Share (%), by Deployment 2025 & 2033
- Figure 110: Middle East and Africa Observability Market Volume Share (%), by Deployment 2025 & 2033
- Figure 111: Middle East and Africa Observability Market Revenue (Million), by Enterprises 2025 & 2033
- Figure 112: Middle East and Africa Observability Market Volume (Billion), by Enterprises 2025 & 2033
- Figure 113: Middle East and Africa Observability Market Revenue Share (%), by Enterprises 2025 & 2033
- Figure 114: Middle East and Africa Observability Market Volume Share (%), by Enterprises 2025 & 2033
- Figure 115: Middle East and Africa Observability Market Revenue (Million), by End-user Vertical 2025 & 2033
- Figure 116: Middle East and Africa Observability Market Volume (Billion), by End-user Vertical 2025 & 2033
- Figure 117: Middle East and Africa Observability Market Revenue Share (%), by End-user Vertical 2025 & 2033
- Figure 118: Middle East and Africa Observability Market Volume Share (%), by End-user Vertical 2025 & 2033
- Figure 119: Middle East and Africa Observability Market Revenue (Million), by Country 2025 & 2033
- Figure 120: Middle East and Africa Observability Market Volume (Billion), by Country 2025 & 2033
- Figure 121: Middle East and Africa Observability Market Revenue Share (%), by Country 2025 & 2033
- Figure 122: Middle East and Africa Observability Market Volume Share (%), by Country 2025 & 2033
List of Tables
- Table 1: Global Observability Market Revenue Million Forecast, by Type 2020 & 2033
- Table 2: Global Observability Market Volume Billion Forecast, by Type 2020 & 2033
- Table 3: Global Observability Market Revenue Million Forecast, by Deployment 2020 & 2033
- Table 4: Global Observability Market Volume Billion Forecast, by Deployment 2020 & 2033
- Table 5: Global Observability Market Revenue Million Forecast, by Enterprises 2020 & 2033
- Table 6: Global Observability Market Volume Billion Forecast, by Enterprises 2020 & 2033
- Table 7: Global Observability Market Revenue Million Forecast, by End-user Vertical 2020 & 2033
- Table 8: Global Observability Market Volume Billion Forecast, by End-user Vertical 2020 & 2033
- Table 9: Global Observability Market Revenue Million Forecast, by Region 2020 & 2033
- Table 10: Global Observability Market Volume Billion Forecast, by Region 2020 & 2033
- Table 11: Global Observability Market Revenue Million Forecast, by Type 2020 & 2033
- Table 12: Global Observability Market Volume Billion Forecast, by Type 2020 & 2033
- Table 13: Global Observability Market Revenue Million Forecast, by Deployment 2020 & 2033
- Table 14: Global Observability Market Volume Billion Forecast, by Deployment 2020 & 2033
- Table 15: Global Observability Market Revenue Million Forecast, by Enterprises 2020 & 2033
- Table 16: Global Observability Market Volume Billion Forecast, by Enterprises 2020 & 2033
- Table 17: Global Observability Market Revenue Million Forecast, by End-user Vertical 2020 & 2033
- Table 18: Global Observability Market Volume Billion Forecast, by End-user Vertical 2020 & 2033
- Table 19: Global Observability Market Revenue Million Forecast, by Country 2020 & 2033
- Table 20: Global Observability Market Volume Billion Forecast, by Country 2020 & 2033
- Table 21: Global Observability Market Revenue Million Forecast, by Type 2020 & 2033
- Table 22: Global Observability Market Volume Billion Forecast, by Type 2020 & 2033
- Table 23: Global Observability Market Revenue Million Forecast, by Deployment 2020 & 2033
- Table 24: Global Observability Market Volume Billion Forecast, by Deployment 2020 & 2033
- Table 25: Global Observability Market Revenue Million Forecast, by Enterprises 2020 & 2033
- Table 26: Global Observability Market Volume Billion Forecast, by Enterprises 2020 & 2033
- Table 27: Global Observability Market Revenue Million Forecast, by End-user Vertical 2020 & 2033
- Table 28: Global Observability Market Volume Billion Forecast, by End-user Vertical 2020 & 2033
- Table 29: Global Observability Market Revenue Million Forecast, by Country 2020 & 2033
- Table 30: Global Observability Market Volume Billion Forecast, by Country 2020 & 2033
- Table 31: Global Observability Market Revenue Million Forecast, by Type 2020 & 2033
- Table 32: Global Observability Market Volume Billion Forecast, by Type 2020 & 2033
- Table 33: Global Observability Market Revenue Million Forecast, by Deployment 2020 & 2033
- Table 34: Global Observability Market Volume Billion Forecast, by Deployment 2020 & 2033
- Table 35: Global Observability Market Revenue Million Forecast, by Enterprises 2020 & 2033
- Table 36: Global Observability Market Volume Billion Forecast, by Enterprises 2020 & 2033
- Table 37: Global Observability Market Revenue Million Forecast, by End-user Vertical 2020 & 2033
- Table 38: Global Observability Market Volume Billion Forecast, by End-user Vertical 2020 & 2033
- Table 39: Global Observability Market Revenue Million Forecast, by Country 2020 & 2033
- Table 40: Global Observability Market Volume Billion Forecast, by Country 2020 & 2033
- Table 41: Global Observability Market Revenue Million Forecast, by Type 2020 & 2033
- Table 42: Global Observability Market Volume Billion Forecast, by Type 2020 & 2033
- Table 43: Global Observability Market Revenue Million Forecast, by Deployment 2020 & 2033
- Table 44: Global Observability Market Volume Billion Forecast, by Deployment 2020 & 2033
- Table 45: Global Observability Market Revenue Million Forecast, by Enterprises 2020 & 2033
- Table 46: Global Observability Market Volume Billion Forecast, by Enterprises 2020 & 2033
- Table 47: Global Observability Market Revenue Million Forecast, by End-user Vertical 2020 & 2033
- Table 48: Global Observability Market Volume Billion Forecast, by End-user Vertical 2020 & 2033
- Table 49: Global Observability Market Revenue Million Forecast, by Country 2020 & 2033
- Table 50: Global Observability Market Volume Billion Forecast, by Country 2020 & 2033
- Table 51: Global Observability Market Revenue Million Forecast, by Type 2020 & 2033
- Table 52: Global Observability Market Volume Billion Forecast, by Type 2020 & 2033
- Table 53: Global Observability Market Revenue Million Forecast, by Deployment 2020 & 2033
- Table 54: Global Observability Market Volume Billion Forecast, by Deployment 2020 & 2033
- Table 55: Global Observability Market Revenue Million Forecast, by Enterprises 2020 & 2033
- Table 56: Global Observability Market Volume Billion Forecast, by Enterprises 2020 & 2033
- Table 57: Global Observability Market Revenue Million Forecast, by End-user Vertical 2020 & 2033
- Table 58: Global Observability Market Volume Billion Forecast, by End-user Vertical 2020 & 2033
- Table 59: Global Observability Market Revenue Million Forecast, by Country 2020 & 2033
- Table 60: Global Observability Market Volume Billion Forecast, by Country 2020 & 2033
- Table 61: Global Observability Market Revenue Million Forecast, by Type 2020 & 2033
- Table 62: Global Observability Market Volume Billion Forecast, by Type 2020 & 2033
- Table 63: Global Observability Market Revenue Million Forecast, by Deployment 2020 & 2033
- Table 64: Global Observability Market Volume Billion Forecast, by Deployment 2020 & 2033
- Table 65: Global Observability Market Revenue Million Forecast, by Enterprises 2020 & 2033
- Table 66: Global Observability Market Volume Billion Forecast, by Enterprises 2020 & 2033
- Table 67: Global Observability Market Revenue Million Forecast, by End-user Vertical 2020 & 2033
- Table 68: Global Observability Market Volume Billion Forecast, by End-user Vertical 2020 & 2033
- Table 69: Global Observability Market Revenue Million Forecast, by Country 2020 & 2033
- Table 70: Global Observability Market Volume Billion Forecast, by Country 2020 & 2033
Frequently Asked Questions
1. What is the projected Compound Annual Growth Rate (CAGR) of the Observability Market?
The projected CAGR is approximately 9.73%.
2. Which companies are prominent players in the Observability Market?
Key companies in the market include Broadcom Inc, Dynatrace LLC, GitLab B V, IBM Corporation, LogicMonitor Inc, Microsoft Corporation, Monte Carlo Corporation, Riverbed Technology, ScienceLogic Inc, Splunk Inc *List Not Exhaustive.
3. What are the main segments of the Observability Market?
The market segments include Type, Deployment, Enterprises, End-user Vertical.
4. Can you provide details about the market size?
The market size is estimated to be USD 2.51 Million as of 2022.
5. What are some drivers contributing to market growth?
Increasing Automation Among Enterprises; Shifting Workloads of Enterprises towards Cloud Environment.
6. What are the notable trends driving market growth?
BFSI to Hold Significant Share.
7. Are there any restraints impacting market growth?
Increasing Automation Among Enterprises; Shifting Workloads of Enterprises towards Cloud Environment.
8. Can you provide examples of recent developments in the market?
June 2024: SUSE announced it has acquired StackState as part of a plan to embed observability capabilities into its Rancher platform for managing Kubernetes clusters. Announced at SUSECon event, the StackState observability platform will be embedded into the Rancher Prime version of the platform for enterprise IT teams.May 2024: Cisco announced a new virtual appliance for its AppDynamics On-Premises application observability offering, enabling customers to use a self-hosted observability solution built on AI-powered intelligence for anomaly detection and root cause analysis, application security, and SAP monitoring.
9. What pricing options are available for accessing the report?
Pricing options include single-user, multi-user, and enterprise licenses priced at USD 4750, USD 5250, and USD 8750 respectively.
10. Is the market size provided in terms of value or volume?
The market size is provided in terms of value, measured in Million and volume, measured in Billion.
11. Are there any specific market keywords associated with the report?
Yes, the market keyword associated with the report is "Observability Market," which aids in identifying and referencing the specific market segment covered.
12. How do I determine which pricing option suits my needs best?
The pricing options vary based on user requirements and access needs. Individual users may opt for single-user licenses, while businesses requiring broader access may choose multi-user or enterprise licenses for cost-effective access to the report.
13. Are there any additional resources or data provided in the Observability Market report?
While the report offers comprehensive insights, it's advisable to review the specific contents or supplementary materials provided to ascertain if additional resources or data are available.
14. How can I stay updated on further developments or reports in the Observability Market?
To stay informed about further developments, trends, and reports in the Observability Market, consider subscribing to industry newsletters, following relevant companies and organizations, or regularly checking reputable industry news sources and publications.
Methodology
Step 1 - Identification of Relevant Samples Size from Population Database


Step 2 - Approaches for Defining Global Market Size (Value, Volume* & Price*)

Note*: In applicable scenarios
Step 3 - Data Sources
Primary Research
- Web Analytics
- Survey Reports
- Research Institute
- Latest Research Reports
- Opinion Leaders
Secondary Research
- Annual Reports
- White Paper
- Latest Press Release
- Industry Association
- Paid Database
- Investor Presentations

Step 4 - Data Triangulation
Involves using different sources of information in order to increase the validity of a study
These sources are likely to be stakeholders in a program - participants, other researchers, program staff, other community members, and so on.
Then we put all data in single framework & apply various statistical tools to find out the dynamic on the market.
During the analysis stage, feedback from the stakeholder groups would be compared to determine areas of agreement as well as areas of divergence