
Key Insights
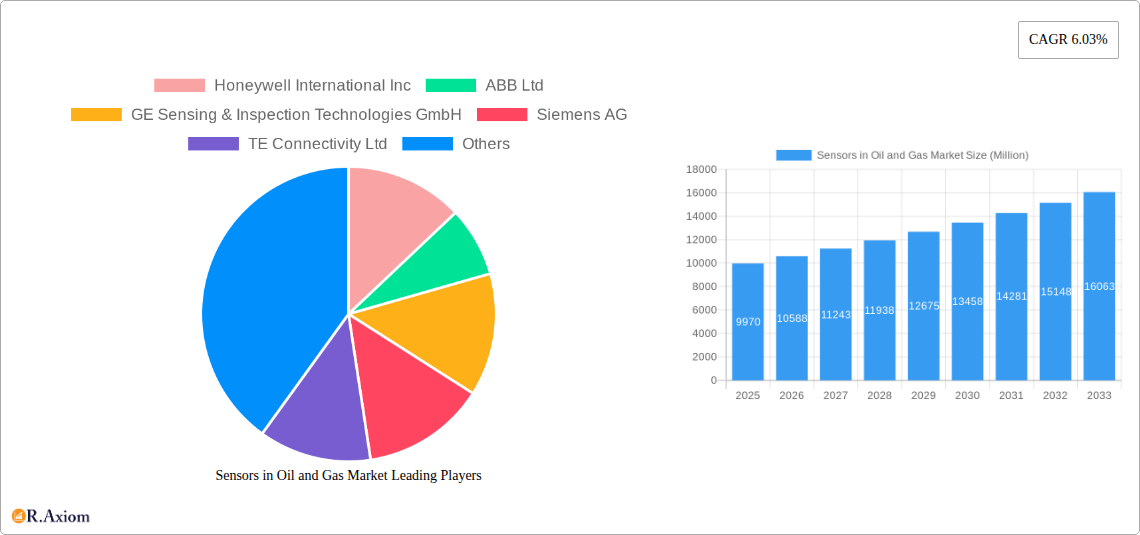
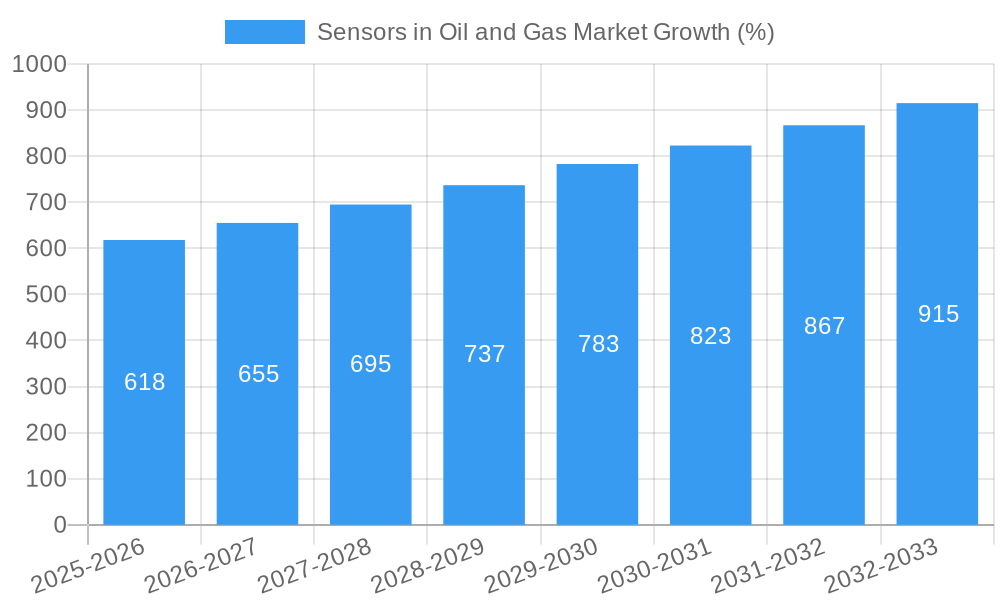
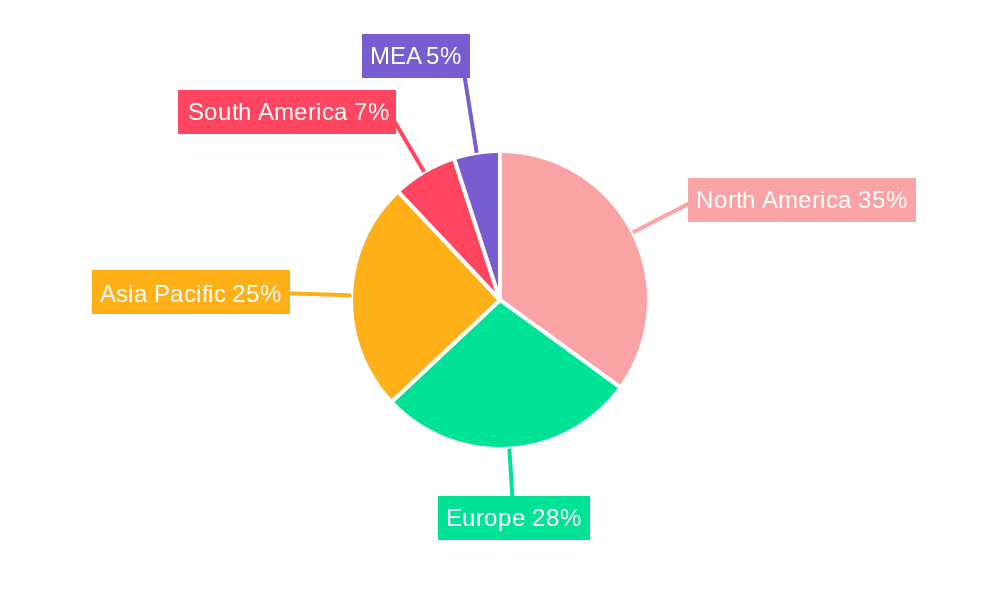
The global Sensors in Oil and Gas market is experiencing robust growth, projected to reach a value of $9.97 billion in 2025 and maintain a Compound Annual Growth Rate (CAGR) of 6.03% from 2025 to 2033. This expansion is driven by several key factors. Firstly, the increasing demand for enhanced safety and operational efficiency within oil and gas extraction, processing, and transportation necessitates the widespread adoption of advanced sensor technologies. Secondly, the rising focus on automation and digitization across the oil and gas value chain, encompassing upstream, midstream, and downstream activities, fuels the demand for sophisticated sensors capable of real-time data acquisition and analysis. Furthermore, stringent environmental regulations and the need for precise emission monitoring are compelling oil and gas companies to invest heavily in sensor-based solutions for leak detection and environmental compliance. Technological advancements, such as the miniaturization of sensors and the development of more robust and reliable sensor systems, are also contributing to market growth. The market is segmented by sensor type (gas, temperature, ultrasonic, pressure, flow, level, and others), connectivity (wired and wireless), and activity (upstream, midstream, and downstream). North America, Europe, and Asia Pacific currently represent the largest regional markets, though significant growth potential exists in developing economies within Asia Pacific, South America, and the Middle East and Africa, driven by increasing investment in oil and gas infrastructure projects.
The competitive landscape is marked by the presence of established players such as Honeywell, ABB, and Siemens, alongside specialized sensor manufacturers. These companies are strategically investing in research and development to improve sensor capabilities and expand their product portfolios. Future growth will likely be fueled by the integration of sensors with advanced analytics platforms for predictive maintenance, improved process optimization, and enhanced safety protocols. The adoption of Internet of Things (IoT) and cloud-based solutions will further drive market expansion by enabling real-time monitoring, data analysis, and remote asset management across geographically dispersed oil and gas operations. The market faces certain challenges, including the volatile nature of oil prices and the initial high capital expenditure associated with implementing comprehensive sensor networks. However, the long-term benefits in terms of improved safety, efficiency, and environmental compliance are expected to outweigh these challenges, ensuring sustained market growth throughout the forecast period.
Sensors in Oil and Gas Market: A Comprehensive Report (2019-2033)
This comprehensive report provides a detailed analysis of the Sensors in Oil and Gas Market, offering invaluable insights for industry stakeholders, investors, and businesses seeking to navigate this dynamic sector. The report covers the period from 2019 to 2033, with a focus on the forecast period of 2025-2033 and a base year of 2025. The market is segmented by sensor type (Gas Sensor, Temperature Sensor, Ultrasonic Sensor, Pressure Sensor, Flow Sensor, Level Sensor, Other Sensor Types), connectivity (Wired, Wireless), and activity (Upstream, Midstream, Downstream). Key players analyzed include Honeywell International Inc, ABB Ltd, GE Sensing & Inspection Technologies GmbH, Siemens AG, TE Connectivity Ltd, Robert Bosch GmbH, Rockwell Automation Inc, Analog Devices Inc, SKF A, and Emerson Electric Company. The report’s value exceeds xx Million.
Sensors in Oil and Gas Market Market Concentration & Innovation
The Sensors in Oil and Gas market exhibits a moderately concentrated landscape, with a few major players holding significant market share. However, the market also displays considerable innovation, driven by the need for enhanced efficiency, safety, and environmental sustainability in oil and gas operations. Several factors influence market concentration:
Mergers and Acquisitions (M&A): The M&A activity in the sector has been significant, with deal values exceeding xx Million in recent years, leading to consolidation among major players. These acquisitions often focus on expanding product portfolios and geographic reach. For example, the acquisition of [Insert Example M&A if data available, otherwise state "Specific M&A data is unavailable for this report."].
Technological Advancements: Continuous innovation in sensor technology, including the development of more accurate, reliable, and cost-effective sensors, is a key driver. The increasing adoption of advanced sensor technologies like IoT-enabled sensors and AI-driven analytics is reshaping the market.
Regulatory Frameworks: Stringent environmental regulations and safety standards are pushing the adoption of advanced sensors for emission monitoring and risk mitigation. This is further driving innovation in sensor technology and creating new opportunities.
Product Substitutes: While there are limited direct substitutes for specific sensor types, the emergence of alternative monitoring technologies and data analysis methods might indirectly influence market dynamics.
End-User Trends: The growing demand for automation and digitalization in oil and gas operations is creating a surge in the demand for advanced sensors. The shift towards remote monitoring and predictive maintenance is also impacting sensor choices and preferences.
Sensors in Oil and Gas Market Industry Trends & Insights
The Sensors in Oil and Gas market is experiencing robust growth, fueled by several key trends:
The market is projected to witness a Compound Annual Growth Rate (CAGR) of xx% during the forecast period (2025-2033). This growth is primarily driven by the increasing need for automation, digitalization, and enhanced safety in oil and gas operations. The market penetration of advanced sensor technologies like wireless sensors and smart sensors is also on the rise, creating new growth opportunities. Furthermore, the increasing focus on environmental sustainability is driving the demand for sensors that enable precise monitoring of methane emissions and other environmental pollutants. The competitive landscape is characterized by intense rivalry among established players and emerging companies. Strategic partnerships, technological collaborations, and product differentiation are key competitive strategies. The preferences of end-users are shifting towards sensors that offer greater accuracy, reliability, durability, and ease of integration with existing systems. Technological disruptions such as the integration of AI and machine learning in sensor technology are significantly impacting the market.
Dominant Markets & Segments in Sensors in Oil and Gas Market
The upstream segment currently dominates the Sensors in Oil and Gas market, accounting for approximately xx% of the total market value. This dominance is attributable to the extensive use of sensors in exploration and production activities. However, the downstream segment is projected to witness significant growth due to increasing focus on refining process optimization and environmental compliance.
By Sensor Type: Pressure sensors hold a leading position, followed by temperature sensors and flow sensors. The demand for gas sensors is increasing steadily driven by emission monitoring needs.
By Connectivity: Wired sensors currently dominate the market due to their reliability and established infrastructure. However, wireless sensors are rapidly gaining traction, driven by their flexibility and ease of installation in remote locations.
By Activity: The upstream sector demonstrates robust growth, followed by midstream and downstream. The increasing adoption of automation and digitalization across all three segments fuels the demand for sensors.
Key Drivers (By Region/Country):
- North America: Strong investment in oil and gas exploration and production, coupled with stringent environmental regulations.
- Europe: Focus on enhancing safety and efficiency in offshore operations.
- Asia Pacific: Rapid industrialization and growth in oil and gas consumption.
- Middle East: Significant investment in new oil and gas projects.
Sensors in Oil and Gas Market Product Developments
Recent product innovations focus on miniaturization, improved accuracy, enhanced durability, and increased integration capabilities. The integration of AI and machine learning is also a prominent trend, enabling predictive maintenance and real-time anomaly detection. Companies are competing on the basis of superior sensor performance, cost-effectiveness, and ease of integration with existing systems. New sensor designs enhance reliability in harsh environments, while advancements in data analytics improve the value extracted from sensor data, enhancing operational efficiency and optimizing resource allocation.
Report Scope & Segmentation Analysis
This report comprehensively analyzes the Sensors in Oil and Gas market across various segments:
By Sensor Type: Each sensor type (Gas, Temperature, Ultrasonic, Pressure, Flow, Level, Other) has unique growth projections, market sizes, and competitive dynamics. Gas sensors, for instance, benefit from stricter emission regulations.
By Connectivity: Wired and wireless sensor connectivity segments demonstrate differing growth trajectories influenced by cost, reliability, and deployment flexibility. Wireless is experiencing higher growth.
By Activity: Upstream, midstream, and downstream segments exhibit unique market dynamics. Upstream, heavily reliant on exploration and production, shows robust sensor demand.
Key Drivers of Sensors in Oil and Gas Market Growth
The market is propelled by several factors:
Increasing Automation and Digitalization: The trend toward smart oilfields and automated operations drives significant sensor demand.
Stringent Environmental Regulations: Regulations concerning emission monitoring and environmental protection boost sensor adoption.
Focus on Safety and Risk Mitigation: The demand for real-time monitoring and predictive maintenance is a key growth driver.
Advancements in Sensor Technology: Improved accuracy, reliability, and cost-effectiveness stimulate higher adoption.
Challenges in the Sensors in Oil and Gas Market Sector
The market faces several hurdles:
High Initial Investment Costs: The cost of implementing advanced sensor systems can be substantial.
Harsh Operating Environments: Sensors must endure extreme conditions (temperature, pressure, corrosion).
Data Security Concerns: Protecting sensitive operational data from cyber threats is crucial.
Supply Chain Disruptions: Global supply chain issues can impact sensor availability and pricing.
Emerging Opportunities in Sensors in Oil and Gas Market
Emerging opportunities include:
IoT-Enabled Sensors: The integration of sensors into the Internet of Things (IoT) offers significant advantages.
AI and Machine Learning: Advanced data analytics enhance operational efficiency and predictive capabilities.
Satellite-Based Monitoring: Remote monitoring using satellites offers new possibilities for large-scale operations.
Demand for Sensors in Renewable Energy: The integration of sensors within renewable energy infrastructure presents a new growth avenue.
Leading Players in the Sensors in Oil and Gas Market Market
- Honeywell International Inc
- ABB Ltd
- GE Sensing & Inspection Technologies GmbH
- Siemens AG
- TE Connectivity Ltd
- Robert Bosch GmbH
- Rockwell Automation Inc
- Analog Devices Inc
- SKF A
- Emerson Electric Company
Key Developments in Sensors in Oil and Gas Market Industry
October 2022: Svanehj Tank Control Systems supplied tank gauging systems for six 220,000 m³ LNG tanks at the Longkou Nanshan LNG Terminal in China. This highlights the growing demand for advanced level and temperature sensors in large-scale LNG projects.
October 2022: ADNOC's commitment to OGMP 2.0 and exploration of drone-mounted sensors indicates a strong focus on methane emission monitoring and the potential for significant growth in this segment.
Strategic Outlook for Sensors in Oil and Gas Market Market
The Sensors in Oil and Gas market is poised for continued growth, driven by technological advancements, increasing demand for automation, and stringent environmental regulations. The focus on digitalization, predictive maintenance, and enhanced safety will further fuel the market's expansion. New opportunities in emerging markets and the integration of AI and IoT will shape the future of this dynamic sector. The market is expected to reach xx Million by 2033.
Sensors in Oil and Gas Market Segmentation
-
1. Sensor Type
- 1.1. Gas Sensor
- 1.2. Temperature Sensor
- 1.3. Ultrasonic Sensor
- 1.4. Pressure Sensor
- 1.5. Flow Sensor
- 1.6. Level Sensor
- 1.7. Other Sensor Types
-
2. Connectivity
- 2.1. Wired
- 2.2. Wireless
-
3. Activity
- 3.1. Upstream
- 3.2. Midstream
- 3.3. Downstream
Sensors in Oil and Gas Market Segmentation By Geography
-
1. North America
- 1.1. United States
- 1.2. Canada
-
2. Europe
- 2.1. United Kingdom
- 2.2. Germany
- 2.3. Rest of Europe
-
3. Asia Pacific
- 3.1. China
- 3.2. India
- 3.3. Indonesia
- 3.4. Rest of Asia Pacific
-
4. Latin America
- 4.1. Mexico
- 4.2. Brazil
- 4.3. Argentina
- 4.4. Rest of Latin America
-
5. Middle East and Africa
- 5.1. United Arab Emirates
- 5.2. Saudi Arabia
- 5.3. South Africa
- 5.4. Rest of Middle East and Africa
Sensors in Oil and Gas Market REPORT HIGHLIGHTS
| Aspects | Details |
|---|---|
| Study Period | 2019-2033 |
| Base Year | 2024 |
| Estimated Year | 2025 |
| Forecast Period | 2025-2033 |
| Historical Period | 2019-2024 |
| Growth Rate | CAGR of 6.03% from 2019-2033 |
| Segmentation |
|
Table of Contents
- 1. Introduction
- 1.1. Research Scope
- 1.2. Market Segmentation
- 1.3. Research Methodology
- 1.4. Definitions and Assumptions
- 2. Executive Summary
- 2.1. Introduction
- 3. Market Dynamics
- 3.1. Introduction
- 3.2. Market Drivers
- 3.2.1. Rising Demand for Safety Systems in the Oil and Gas Industry; Increasing Need for a Simplified Network Architecture in the Wireless Sensor Segment
- 3.3. Market Restrains
- 3.3.1. Rigid Regulations Imposed on Oil and Gas Drilling Activities
- 3.4. Market Trends
- 3.4.1. Upstream Industries Offer Potential Growth
- 4. Market Factor Analysis
- 4.1. Porters Five Forces
- 4.2. Supply/Value Chain
- 4.3. PESTEL analysis
- 4.4. Market Entropy
- 4.5. Patent/Trademark Analysis
- 5. Global Sensors in Oil and Gas Market Analysis, Insights and Forecast, 2019-2031
- 5.1. Market Analysis, Insights and Forecast - by Sensor Type
- 5.1.1. Gas Sensor
- 5.1.2. Temperature Sensor
- 5.1.3. Ultrasonic Sensor
- 5.1.4. Pressure Sensor
- 5.1.5. Flow Sensor
- 5.1.6. Level Sensor
- 5.1.7. Other Sensor Types
- 5.2. Market Analysis, Insights and Forecast - by Connectivity
- 5.2.1. Wired
- 5.2.2. Wireless
- 5.3. Market Analysis, Insights and Forecast - by Activity
- 5.3.1. Upstream
- 5.3.2. Midstream
- 5.3.3. Downstream
- 5.4. Market Analysis, Insights and Forecast - by Region
- 5.4.1. North America
- 5.4.2. Europe
- 5.4.3. Asia Pacific
- 5.4.4. Latin America
- 5.4.5. Middle East and Africa
- 5.1. Market Analysis, Insights and Forecast - by Sensor Type
- 6. North America Sensors in Oil and Gas Market Analysis, Insights and Forecast, 2019-2031
- 6.1. Market Analysis, Insights and Forecast - by Sensor Type
- 6.1.1. Gas Sensor
- 6.1.2. Temperature Sensor
- 6.1.3. Ultrasonic Sensor
- 6.1.4. Pressure Sensor
- 6.1.5. Flow Sensor
- 6.1.6. Level Sensor
- 6.1.7. Other Sensor Types
- 6.2. Market Analysis, Insights and Forecast - by Connectivity
- 6.2.1. Wired
- 6.2.2. Wireless
- 6.3. Market Analysis, Insights and Forecast - by Activity
- 6.3.1. Upstream
- 6.3.2. Midstream
- 6.3.3. Downstream
- 6.1. Market Analysis, Insights and Forecast - by Sensor Type
- 7. Europe Sensors in Oil and Gas Market Analysis, Insights and Forecast, 2019-2031
- 7.1. Market Analysis, Insights and Forecast - by Sensor Type
- 7.1.1. Gas Sensor
- 7.1.2. Temperature Sensor
- 7.1.3. Ultrasonic Sensor
- 7.1.4. Pressure Sensor
- 7.1.5. Flow Sensor
- 7.1.6. Level Sensor
- 7.1.7. Other Sensor Types
- 7.2. Market Analysis, Insights and Forecast - by Connectivity
- 7.2.1. Wired
- 7.2.2. Wireless
- 7.3. Market Analysis, Insights and Forecast - by Activity
- 7.3.1. Upstream
- 7.3.2. Midstream
- 7.3.3. Downstream
- 7.1. Market Analysis, Insights and Forecast - by Sensor Type
- 8. Asia Pacific Sensors in Oil and Gas Market Analysis, Insights and Forecast, 2019-2031
- 8.1. Market Analysis, Insights and Forecast - by Sensor Type
- 8.1.1. Gas Sensor
- 8.1.2. Temperature Sensor
- 8.1.3. Ultrasonic Sensor
- 8.1.4. Pressure Sensor
- 8.1.5. Flow Sensor
- 8.1.6. Level Sensor
- 8.1.7. Other Sensor Types
- 8.2. Market Analysis, Insights and Forecast - by Connectivity
- 8.2.1. Wired
- 8.2.2. Wireless
- 8.3. Market Analysis, Insights and Forecast - by Activity
- 8.3.1. Upstream
- 8.3.2. Midstream
- 8.3.3. Downstream
- 8.1. Market Analysis, Insights and Forecast - by Sensor Type
- 9. Latin America Sensors in Oil and Gas Market Analysis, Insights and Forecast, 2019-2031
- 9.1. Market Analysis, Insights and Forecast - by Sensor Type
- 9.1.1. Gas Sensor
- 9.1.2. Temperature Sensor
- 9.1.3. Ultrasonic Sensor
- 9.1.4. Pressure Sensor
- 9.1.5. Flow Sensor
- 9.1.6. Level Sensor
- 9.1.7. Other Sensor Types
- 9.2. Market Analysis, Insights and Forecast - by Connectivity
- 9.2.1. Wired
- 9.2.2. Wireless
- 9.3. Market Analysis, Insights and Forecast - by Activity
- 9.3.1. Upstream
- 9.3.2. Midstream
- 9.3.3. Downstream
- 9.1. Market Analysis, Insights and Forecast - by Sensor Type
- 10. Middle East and Africa Sensors in Oil and Gas Market Analysis, Insights and Forecast, 2019-2031
- 10.1. Market Analysis, Insights and Forecast - by Sensor Type
- 10.1.1. Gas Sensor
- 10.1.2. Temperature Sensor
- 10.1.3. Ultrasonic Sensor
- 10.1.4. Pressure Sensor
- 10.1.5. Flow Sensor
- 10.1.6. Level Sensor
- 10.1.7. Other Sensor Types
- 10.2. Market Analysis, Insights and Forecast - by Connectivity
- 10.2.1. Wired
- 10.2.2. Wireless
- 10.3. Market Analysis, Insights and Forecast - by Activity
- 10.3.1. Upstream
- 10.3.2. Midstream
- 10.3.3. Downstream
- 10.1. Market Analysis, Insights and Forecast - by Sensor Type
- 11. North America Sensors in Oil and Gas Market Analysis, Insights and Forecast, 2019-2031
- 11.1. Market Analysis, Insights and Forecast - By Country/Sub-region
- 11.1.1 United States
- 11.1.2 Canada
- 11.1.3 Mexico
- 12. Europe Sensors in Oil and Gas Market Analysis, Insights and Forecast, 2019-2031
- 12.1. Market Analysis, Insights and Forecast - By Country/Sub-region
- 12.1.1 Germany
- 12.1.2 United Kingdom
- 12.1.3 France
- 12.1.4 Spain
- 12.1.5 Italy
- 12.1.6 Spain
- 12.1.7 Belgium
- 12.1.8 Netherland
- 12.1.9 Nordics
- 12.1.10 Rest of Europe
- 13. Asia Pacific Sensors in Oil and Gas Market Analysis, Insights and Forecast, 2019-2031
- 13.1. Market Analysis, Insights and Forecast - By Country/Sub-region
- 13.1.1 China
- 13.1.2 Japan
- 13.1.3 India
- 13.1.4 South Korea
- 13.1.5 Southeast Asia
- 13.1.6 Australia
- 13.1.7 Indonesia
- 13.1.8 Phillipes
- 13.1.9 Singapore
- 13.1.10 Thailandc
- 13.1.11 Rest of Asia Pacific
- 14. South America Sensors in Oil and Gas Market Analysis, Insights and Forecast, 2019-2031
- 14.1. Market Analysis, Insights and Forecast - By Country/Sub-region
- 14.1.1 Brazil
- 14.1.2 Argentina
- 14.1.3 Peru
- 14.1.4 Chile
- 14.1.5 Colombia
- 14.1.6 Ecuador
- 14.1.7 Venezuela
- 14.1.8 Rest of South America
- 15. North America Sensors in Oil and Gas Market Analysis, Insights and Forecast, 2019-2031
- 15.1. Market Analysis, Insights and Forecast - By Country/Sub-region
- 15.1.1 United States
- 15.1.2 Canada
- 15.1.3 Mexico
- 16. MEA Sensors in Oil and Gas Market Analysis, Insights and Forecast, 2019-2031
- 16.1. Market Analysis, Insights and Forecast - By Country/Sub-region
- 16.1.1 United Arab Emirates
- 16.1.2 Saudi Arabia
- 16.1.3 South Africa
- 16.1.4 Rest of Middle East and Africa
- 17. Competitive Analysis
- 17.1. Global Market Share Analysis 2024
- 17.2. Company Profiles
- 17.2.1 Honeywell International Inc
- 17.2.1.1. Overview
- 17.2.1.2. Products
- 17.2.1.3. SWOT Analysis
- 17.2.1.4. Recent Developments
- 17.2.1.5. Financials (Based on Availability)
- 17.2.2 ABB Ltd
- 17.2.2.1. Overview
- 17.2.2.2. Products
- 17.2.2.3. SWOT Analysis
- 17.2.2.4. Recent Developments
- 17.2.2.5. Financials (Based on Availability)
- 17.2.3 GE Sensing & Inspection Technologies GmbH
- 17.2.3.1. Overview
- 17.2.3.2. Products
- 17.2.3.3. SWOT Analysis
- 17.2.3.4. Recent Developments
- 17.2.3.5. Financials (Based on Availability)
- 17.2.4 Siemens AG
- 17.2.4.1. Overview
- 17.2.4.2. Products
- 17.2.4.3. SWOT Analysis
- 17.2.4.4. Recent Developments
- 17.2.4.5. Financials (Based on Availability)
- 17.2.5 TE Connectivity Ltd
- 17.2.5.1. Overview
- 17.2.5.2. Products
- 17.2.5.3. SWOT Analysis
- 17.2.5.4. Recent Developments
- 17.2.5.5. Financials (Based on Availability)
- 17.2.6 Robert Bosch GmbH
- 17.2.6.1. Overview
- 17.2.6.2. Products
- 17.2.6.3. SWOT Analysis
- 17.2.6.4. Recent Developments
- 17.2.6.5. Financials (Based on Availability)
- 17.2.7 Rockwell Automation Inc
- 17.2.7.1. Overview
- 17.2.7.2. Products
- 17.2.7.3. SWOT Analysis
- 17.2.7.4. Recent Developments
- 17.2.7.5. Financials (Based on Availability)
- 17.2.8 Analog Devices Inc
- 17.2.8.1. Overview
- 17.2.8.2. Products
- 17.2.8.3. SWOT Analysis
- 17.2.8.4. Recent Developments
- 17.2.8.5. Financials (Based on Availability)
- 17.2.9 SKF A
- 17.2.9.1. Overview
- 17.2.9.2. Products
- 17.2.9.3. SWOT Analysis
- 17.2.9.4. Recent Developments
- 17.2.9.5. Financials (Based on Availability)
- 17.2.10 Emerson Electric Company
- 17.2.10.1. Overview
- 17.2.10.2. Products
- 17.2.10.3. SWOT Analysis
- 17.2.10.4. Recent Developments
- 17.2.10.5. Financials (Based on Availability)
- 17.2.1 Honeywell International Inc
List of Figures
- Figure 1: Global Sensors in Oil and Gas Market Revenue Breakdown (Million, %) by Region 2024 & 2032
- Figure 2: North America Sensors in Oil and Gas Market Revenue (Million), by Country 2024 & 2032
- Figure 3: North America Sensors in Oil and Gas Market Revenue Share (%), by Country 2024 & 2032
- Figure 4: Europe Sensors in Oil and Gas Market Revenue (Million), by Country 2024 & 2032
- Figure 5: Europe Sensors in Oil and Gas Market Revenue Share (%), by Country 2024 & 2032
- Figure 6: Asia Pacific Sensors in Oil and Gas Market Revenue (Million), by Country 2024 & 2032
- Figure 7: Asia Pacific Sensors in Oil and Gas Market Revenue Share (%), by Country 2024 & 2032
- Figure 8: South America Sensors in Oil and Gas Market Revenue (Million), by Country 2024 & 2032
- Figure 9: South America Sensors in Oil and Gas Market Revenue Share (%), by Country 2024 & 2032
- Figure 10: North America Sensors in Oil and Gas Market Revenue (Million), by Country 2024 & 2032
- Figure 11: North America Sensors in Oil and Gas Market Revenue Share (%), by Country 2024 & 2032
- Figure 12: MEA Sensors in Oil and Gas Market Revenue (Million), by Country 2024 & 2032
- Figure 13: MEA Sensors in Oil and Gas Market Revenue Share (%), by Country 2024 & 2032
- Figure 14: North America Sensors in Oil and Gas Market Revenue (Million), by Sensor Type 2024 & 2032
- Figure 15: North America Sensors in Oil and Gas Market Revenue Share (%), by Sensor Type 2024 & 2032
- Figure 16: North America Sensors in Oil and Gas Market Revenue (Million), by Connectivity 2024 & 2032
- Figure 17: North America Sensors in Oil and Gas Market Revenue Share (%), by Connectivity 2024 & 2032
- Figure 18: North America Sensors in Oil and Gas Market Revenue (Million), by Activity 2024 & 2032
- Figure 19: North America Sensors in Oil and Gas Market Revenue Share (%), by Activity 2024 & 2032
- Figure 20: North America Sensors in Oil and Gas Market Revenue (Million), by Country 2024 & 2032
- Figure 21: North America Sensors in Oil and Gas Market Revenue Share (%), by Country 2024 & 2032
- Figure 22: Europe Sensors in Oil and Gas Market Revenue (Million), by Sensor Type 2024 & 2032
- Figure 23: Europe Sensors in Oil and Gas Market Revenue Share (%), by Sensor Type 2024 & 2032
- Figure 24: Europe Sensors in Oil and Gas Market Revenue (Million), by Connectivity 2024 & 2032
- Figure 25: Europe Sensors in Oil and Gas Market Revenue Share (%), by Connectivity 2024 & 2032
- Figure 26: Europe Sensors in Oil and Gas Market Revenue (Million), by Activity 2024 & 2032
- Figure 27: Europe Sensors in Oil and Gas Market Revenue Share (%), by Activity 2024 & 2032
- Figure 28: Europe Sensors in Oil and Gas Market Revenue (Million), by Country 2024 & 2032
- Figure 29: Europe Sensors in Oil and Gas Market Revenue Share (%), by Country 2024 & 2032
- Figure 30: Asia Pacific Sensors in Oil and Gas Market Revenue (Million), by Sensor Type 2024 & 2032
- Figure 31: Asia Pacific Sensors in Oil and Gas Market Revenue Share (%), by Sensor Type 2024 & 2032
- Figure 32: Asia Pacific Sensors in Oil and Gas Market Revenue (Million), by Connectivity 2024 & 2032
- Figure 33: Asia Pacific Sensors in Oil and Gas Market Revenue Share (%), by Connectivity 2024 & 2032
- Figure 34: Asia Pacific Sensors in Oil and Gas Market Revenue (Million), by Activity 2024 & 2032
- Figure 35: Asia Pacific Sensors in Oil and Gas Market Revenue Share (%), by Activity 2024 & 2032
- Figure 36: Asia Pacific Sensors in Oil and Gas Market Revenue (Million), by Country 2024 & 2032
- Figure 37: Asia Pacific Sensors in Oil and Gas Market Revenue Share (%), by Country 2024 & 2032
- Figure 38: Latin America Sensors in Oil and Gas Market Revenue (Million), by Sensor Type 2024 & 2032
- Figure 39: Latin America Sensors in Oil and Gas Market Revenue Share (%), by Sensor Type 2024 & 2032
- Figure 40: Latin America Sensors in Oil and Gas Market Revenue (Million), by Connectivity 2024 & 2032
- Figure 41: Latin America Sensors in Oil and Gas Market Revenue Share (%), by Connectivity 2024 & 2032
- Figure 42: Latin America Sensors in Oil and Gas Market Revenue (Million), by Activity 2024 & 2032
- Figure 43: Latin America Sensors in Oil and Gas Market Revenue Share (%), by Activity 2024 & 2032
- Figure 44: Latin America Sensors in Oil and Gas Market Revenue (Million), by Country 2024 & 2032
- Figure 45: Latin America Sensors in Oil and Gas Market Revenue Share (%), by Country 2024 & 2032
- Figure 46: Middle East and Africa Sensors in Oil and Gas Market Revenue (Million), by Sensor Type 2024 & 2032
- Figure 47: Middle East and Africa Sensors in Oil and Gas Market Revenue Share (%), by Sensor Type 2024 & 2032
- Figure 48: Middle East and Africa Sensors in Oil and Gas Market Revenue (Million), by Connectivity 2024 & 2032
- Figure 49: Middle East and Africa Sensors in Oil and Gas Market Revenue Share (%), by Connectivity 2024 & 2032
- Figure 50: Middle East and Africa Sensors in Oil and Gas Market Revenue (Million), by Activity 2024 & 2032
- Figure 51: Middle East and Africa Sensors in Oil and Gas Market Revenue Share (%), by Activity 2024 & 2032
- Figure 52: Middle East and Africa Sensors in Oil and Gas Market Revenue (Million), by Country 2024 & 2032
- Figure 53: Middle East and Africa Sensors in Oil and Gas Market Revenue Share (%), by Country 2024 & 2032
List of Tables
- Table 1: Global Sensors in Oil and Gas Market Revenue Million Forecast, by Region 2019 & 2032
- Table 2: Global Sensors in Oil and Gas Market Revenue Million Forecast, by Sensor Type 2019 & 2032
- Table 3: Global Sensors in Oil and Gas Market Revenue Million Forecast, by Connectivity 2019 & 2032
- Table 4: Global Sensors in Oil and Gas Market Revenue Million Forecast, by Activity 2019 & 2032
- Table 5: Global Sensors in Oil and Gas Market Revenue Million Forecast, by Region 2019 & 2032
- Table 6: Global Sensors in Oil and Gas Market Revenue Million Forecast, by Country 2019 & 2032
- Table 7: United States Sensors in Oil and Gas Market Revenue (Million) Forecast, by Application 2019 & 2032
- Table 8: Canada Sensors in Oil and Gas Market Revenue (Million) Forecast, by Application 2019 & 2032
- Table 9: Mexico Sensors in Oil and Gas Market Revenue (Million) Forecast, by Application 2019 & 2032
- Table 10: Global Sensors in Oil and Gas Market Revenue Million Forecast, by Country 2019 & 2032
- Table 11: Germany Sensors in Oil and Gas Market Revenue (Million) Forecast, by Application 2019 & 2032
- Table 12: United Kingdom Sensors in Oil and Gas Market Revenue (Million) Forecast, by Application 2019 & 2032
- Table 13: France Sensors in Oil and Gas Market Revenue (Million) Forecast, by Application 2019 & 2032
- Table 14: Spain Sensors in Oil and Gas Market Revenue (Million) Forecast, by Application 2019 & 2032
- Table 15: Italy Sensors in Oil and Gas Market Revenue (Million) Forecast, by Application 2019 & 2032
- Table 16: Spain Sensors in Oil and Gas Market Revenue (Million) Forecast, by Application 2019 & 2032
- Table 17: Belgium Sensors in Oil and Gas Market Revenue (Million) Forecast, by Application 2019 & 2032
- Table 18: Netherland Sensors in Oil and Gas Market Revenue (Million) Forecast, by Application 2019 & 2032
- Table 19: Nordics Sensors in Oil and Gas Market Revenue (Million) Forecast, by Application 2019 & 2032
- Table 20: Rest of Europe Sensors in Oil and Gas Market Revenue (Million) Forecast, by Application 2019 & 2032
- Table 21: Global Sensors in Oil and Gas Market Revenue Million Forecast, by Country 2019 & 2032
- Table 22: China Sensors in Oil and Gas Market Revenue (Million) Forecast, by Application 2019 & 2032
- Table 23: Japan Sensors in Oil and Gas Market Revenue (Million) Forecast, by Application 2019 & 2032
- Table 24: India Sensors in Oil and Gas Market Revenue (Million) Forecast, by Application 2019 & 2032
- Table 25: South Korea Sensors in Oil and Gas Market Revenue (Million) Forecast, by Application 2019 & 2032
- Table 26: Southeast Asia Sensors in Oil and Gas Market Revenue (Million) Forecast, by Application 2019 & 2032
- Table 27: Australia Sensors in Oil and Gas Market Revenue (Million) Forecast, by Application 2019 & 2032
- Table 28: Indonesia Sensors in Oil and Gas Market Revenue (Million) Forecast, by Application 2019 & 2032
- Table 29: Phillipes Sensors in Oil and Gas Market Revenue (Million) Forecast, by Application 2019 & 2032
- Table 30: Singapore Sensors in Oil and Gas Market Revenue (Million) Forecast, by Application 2019 & 2032
- Table 31: Thailandc Sensors in Oil and Gas Market Revenue (Million) Forecast, by Application 2019 & 2032
- Table 32: Rest of Asia Pacific Sensors in Oil and Gas Market Revenue (Million) Forecast, by Application 2019 & 2032
- Table 33: Global Sensors in Oil and Gas Market Revenue Million Forecast, by Country 2019 & 2032
- Table 34: Brazil Sensors in Oil and Gas Market Revenue (Million) Forecast, by Application 2019 & 2032
- Table 35: Argentina Sensors in Oil and Gas Market Revenue (Million) Forecast, by Application 2019 & 2032
- Table 36: Peru Sensors in Oil and Gas Market Revenue (Million) Forecast, by Application 2019 & 2032
- Table 37: Chile Sensors in Oil and Gas Market Revenue (Million) Forecast, by Application 2019 & 2032
- Table 38: Colombia Sensors in Oil and Gas Market Revenue (Million) Forecast, by Application 2019 & 2032
- Table 39: Ecuador Sensors in Oil and Gas Market Revenue (Million) Forecast, by Application 2019 & 2032
- Table 40: Venezuela Sensors in Oil and Gas Market Revenue (Million) Forecast, by Application 2019 & 2032
- Table 41: Rest of South America Sensors in Oil and Gas Market Revenue (Million) Forecast, by Application 2019 & 2032
- Table 42: Global Sensors in Oil and Gas Market Revenue Million Forecast, by Country 2019 & 2032
- Table 43: United States Sensors in Oil and Gas Market Revenue (Million) Forecast, by Application 2019 & 2032
- Table 44: Canada Sensors in Oil and Gas Market Revenue (Million) Forecast, by Application 2019 & 2032
- Table 45: Mexico Sensors in Oil and Gas Market Revenue (Million) Forecast, by Application 2019 & 2032
- Table 46: Global Sensors in Oil and Gas Market Revenue Million Forecast, by Country 2019 & 2032
- Table 47: United Arab Emirates Sensors in Oil and Gas Market Revenue (Million) Forecast, by Application 2019 & 2032
- Table 48: Saudi Arabia Sensors in Oil and Gas Market Revenue (Million) Forecast, by Application 2019 & 2032
- Table 49: South Africa Sensors in Oil and Gas Market Revenue (Million) Forecast, by Application 2019 & 2032
- Table 50: Rest of Middle East and Africa Sensors in Oil and Gas Market Revenue (Million) Forecast, by Application 2019 & 2032
- Table 51: Global Sensors in Oil and Gas Market Revenue Million Forecast, by Sensor Type 2019 & 2032
- Table 52: Global Sensors in Oil and Gas Market Revenue Million Forecast, by Connectivity 2019 & 2032
- Table 53: Global Sensors in Oil and Gas Market Revenue Million Forecast, by Activity 2019 & 2032
- Table 54: Global Sensors in Oil and Gas Market Revenue Million Forecast, by Country 2019 & 2032
- Table 55: United States Sensors in Oil and Gas Market Revenue (Million) Forecast, by Application 2019 & 2032
- Table 56: Canada Sensors in Oil and Gas Market Revenue (Million) Forecast, by Application 2019 & 2032
- Table 57: Global Sensors in Oil and Gas Market Revenue Million Forecast, by Sensor Type 2019 & 2032
- Table 58: Global Sensors in Oil and Gas Market Revenue Million Forecast, by Connectivity 2019 & 2032
- Table 59: Global Sensors in Oil and Gas Market Revenue Million Forecast, by Activity 2019 & 2032
- Table 60: Global Sensors in Oil and Gas Market Revenue Million Forecast, by Country 2019 & 2032
- Table 61: United Kingdom Sensors in Oil and Gas Market Revenue (Million) Forecast, by Application 2019 & 2032
- Table 62: Germany Sensors in Oil and Gas Market Revenue (Million) Forecast, by Application 2019 & 2032
- Table 63: Rest of Europe Sensors in Oil and Gas Market Revenue (Million) Forecast, by Application 2019 & 2032
- Table 64: Global Sensors in Oil and Gas Market Revenue Million Forecast, by Sensor Type 2019 & 2032
- Table 65: Global Sensors in Oil and Gas Market Revenue Million Forecast, by Connectivity 2019 & 2032
- Table 66: Global Sensors in Oil and Gas Market Revenue Million Forecast, by Activity 2019 & 2032
- Table 67: Global Sensors in Oil and Gas Market Revenue Million Forecast, by Country 2019 & 2032
- Table 68: China Sensors in Oil and Gas Market Revenue (Million) Forecast, by Application 2019 & 2032
- Table 69: India Sensors in Oil and Gas Market Revenue (Million) Forecast, by Application 2019 & 2032
- Table 70: Indonesia Sensors in Oil and Gas Market Revenue (Million) Forecast, by Application 2019 & 2032
- Table 71: Rest of Asia Pacific Sensors in Oil and Gas Market Revenue (Million) Forecast, by Application 2019 & 2032
- Table 72: Global Sensors in Oil and Gas Market Revenue Million Forecast, by Sensor Type 2019 & 2032
- Table 73: Global Sensors in Oil and Gas Market Revenue Million Forecast, by Connectivity 2019 & 2032
- Table 74: Global Sensors in Oil and Gas Market Revenue Million Forecast, by Activity 2019 & 2032
- Table 75: Global Sensors in Oil and Gas Market Revenue Million Forecast, by Country 2019 & 2032
- Table 76: Mexico Sensors in Oil and Gas Market Revenue (Million) Forecast, by Application 2019 & 2032
- Table 77: Brazil Sensors in Oil and Gas Market Revenue (Million) Forecast, by Application 2019 & 2032
- Table 78: Argentina Sensors in Oil and Gas Market Revenue (Million) Forecast, by Application 2019 & 2032
- Table 79: Rest of Latin America Sensors in Oil and Gas Market Revenue (Million) Forecast, by Application 2019 & 2032
- Table 80: Global Sensors in Oil and Gas Market Revenue Million Forecast, by Sensor Type 2019 & 2032
- Table 81: Global Sensors in Oil and Gas Market Revenue Million Forecast, by Connectivity 2019 & 2032
- Table 82: Global Sensors in Oil and Gas Market Revenue Million Forecast, by Activity 2019 & 2032
- Table 83: Global Sensors in Oil and Gas Market Revenue Million Forecast, by Country 2019 & 2032
- Table 84: United Arab Emirates Sensors in Oil and Gas Market Revenue (Million) Forecast, by Application 2019 & 2032
- Table 85: Saudi Arabia Sensors in Oil and Gas Market Revenue (Million) Forecast, by Application 2019 & 2032
- Table 86: South Africa Sensors in Oil and Gas Market Revenue (Million) Forecast, by Application 2019 & 2032
- Table 87: Rest of Middle East and Africa Sensors in Oil and Gas Market Revenue (Million) Forecast, by Application 2019 & 2032
Frequently Asked Questions
1. What is the projected Compound Annual Growth Rate (CAGR) of the Sensors in Oil and Gas Market?
The projected CAGR is approximately 6.03%.
2. Which companies are prominent players in the Sensors in Oil and Gas Market?
Key companies in the market include Honeywell International Inc, ABB Ltd, GE Sensing & Inspection Technologies GmbH, Siemens AG, TE Connectivity Ltd, Robert Bosch GmbH, Rockwell Automation Inc, Analog Devices Inc, SKF A, Emerson Electric Company.
3. What are the main segments of the Sensors in Oil and Gas Market?
The market segments include Sensor Type, Connectivity, Activity.
4. Can you provide details about the market size?
The market size is estimated to be USD 9.97 Million as of 2022.
5. What are some drivers contributing to market growth?
Rising Demand for Safety Systems in the Oil and Gas Industry; Increasing Need for a Simplified Network Architecture in the Wireless Sensor Segment.
6. What are the notable trends driving market growth?
Upstream Industries Offer Potential Growth.
7. Are there any restraints impacting market growth?
Rigid Regulations Imposed on Oil and Gas Drilling Activities.
8. Can you provide examples of recent developments in the market?
October 2022: Svanehj Tank Control Systems supplied the tank gauging systems for six 220,000 m3 LNG tanks at the Longkou Nanshan LNG Terminal, which is being constructed in China. The client is COOEC, one of the biggest EPCI contractors for the Asia-Pacific region's offshore oil and gas industry. The 18 servo level gauges, six LTD gauges, 12 multi-spot temperature sensors, hardware, and software for data collecting and rollover prediction are all part of the order from COOEC.
9. What pricing options are available for accessing the report?
Pricing options include single-user, multi-user, and enterprise licenses priced at USD 4750, USD 5250, and USD 8750 respectively.
10. Is the market size provided in terms of value or volume?
The market size is provided in terms of value, measured in Million.
11. Are there any specific market keywords associated with the report?
Yes, the market keyword associated with the report is "Sensors in Oil and Gas Market," which aids in identifying and referencing the specific market segment covered.
12. How do I determine which pricing option suits my needs best?
The pricing options vary based on user requirements and access needs. Individual users may opt for single-user licenses, while businesses requiring broader access may choose multi-user or enterprise licenses for cost-effective access to the report.
13. Are there any additional resources or data provided in the Sensors in Oil and Gas Market report?
While the report offers comprehensive insights, it's advisable to review the specific contents or supplementary materials provided to ascertain if additional resources or data are available.
14. How can I stay updated on further developments or reports in the Sensors in Oil and Gas Market?
To stay informed about further developments, trends, and reports in the Sensors in Oil and Gas Market, consider subscribing to industry newsletters, following relevant companies and organizations, or regularly checking reputable industry news sources and publications.
Methodology
Step 1 - Identification of Relevant Samples Size from Population Database


Step 2 - Approaches for Defining Global Market Size (Value, Volume* & Price*)

Note*: In applicable scenarios
Step 3 - Data Sources
Primary Research
- Web Analytics
- Survey Reports
- Research Institute
- Latest Research Reports
- Opinion Leaders
Secondary Research
- Annual Reports
- White Paper
- Latest Press Release
- Industry Association
- Paid Database
- Investor Presentations

Step 4 - Data Triangulation
Involves using different sources of information in order to increase the validity of a study
These sources are likely to be stakeholders in a program - participants, other researchers, program staff, other community members, and so on.
Then we put all data in single framework & apply various statistical tools to find out the dynamic on the market.
During the analysis stage, feedback from the stakeholder groups would be compared to determine areas of agreement as well as areas of divergence


