
Key Insights
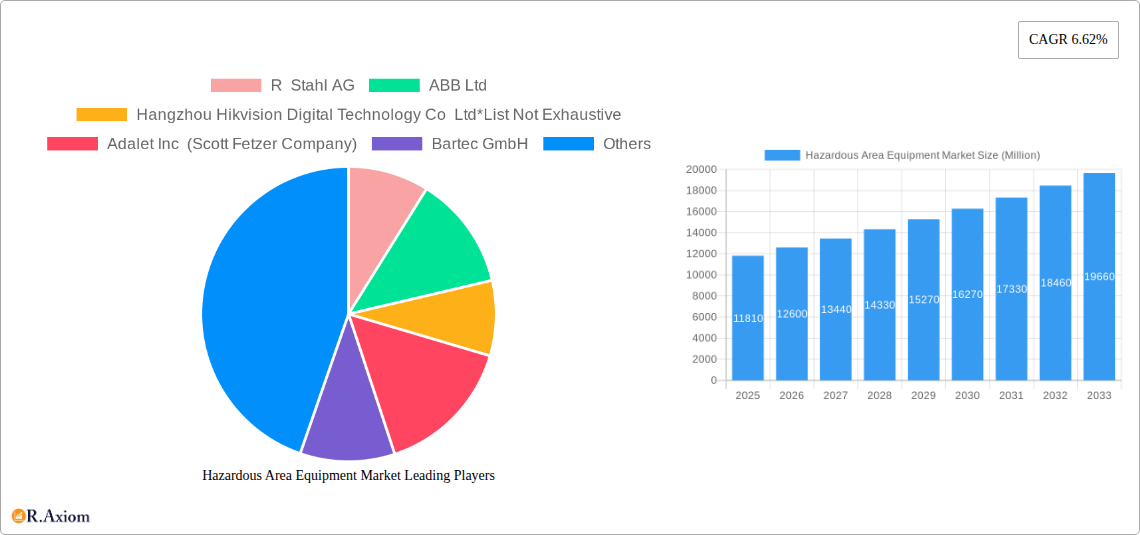
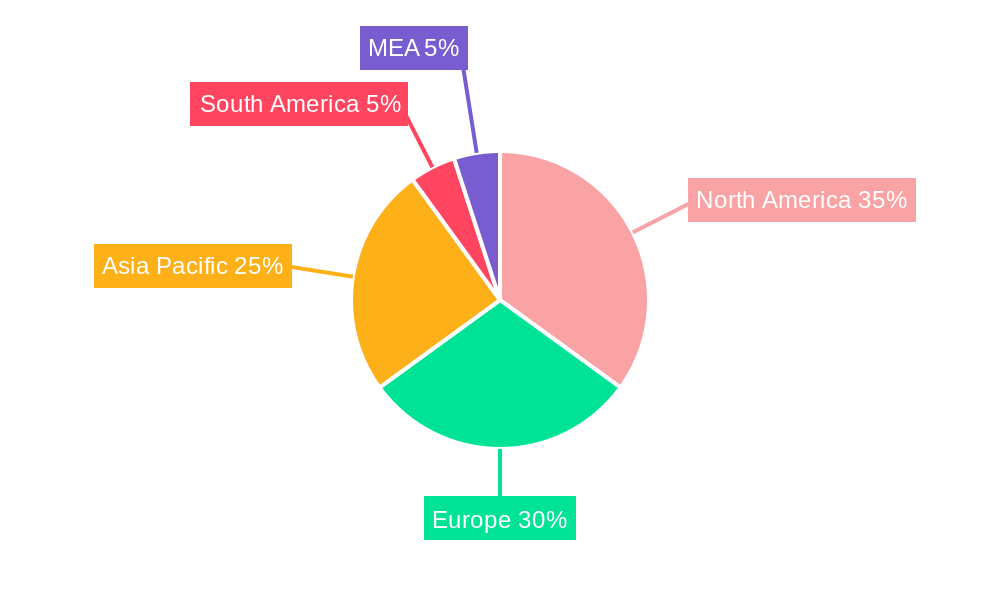
The Hazardous Area Equipment market, valued at $11.81 billion in 2025, is projected to experience robust growth, driven by increasing investments in infrastructure projects across various end-user industries, particularly oil and gas, energy, and chemical sectors. Stringent safety regulations mandating the use of explosion-proof and intrinsically safe equipment in hazardous environments are a key catalyst. The market is segmented by equipment type (power supply systems, electric motors, surveillance systems, and others) and end-user industry. Growth is further fueled by the rising adoption of automation and digital technologies within these industries, leading to greater demand for advanced control systems and instrumentation. However, the high initial investment costs associated with hazardous area equipment and the potential for supply chain disruptions can act as restraints on market expansion. Technological advancements like the development of more efficient and reliable equipment, coupled with the increasing demand for improved safety features, are reshaping the market landscape. North America and Europe currently dominate the market, but the Asia-Pacific region is expected to witness significant growth due to substantial industrial development and infrastructure projects.
The competitive landscape is characterized by a mix of established global players and regional manufacturers. Companies like ABB, Siemens, Rockwell Automation, and Honeywell hold significant market share, leveraging their brand recognition, extensive product portfolios, and robust distribution networks. However, emerging players are also making inroads, particularly in the Asia-Pacific region, by offering cost-effective solutions and focusing on specific niche markets. Future market growth will be influenced by factors such as the global economic outlook, regulatory changes, and the adoption of Industry 4.0 technologies, driving demand for advanced automation and connected solutions within hazardous areas. Further market segmentation based on specific types of hazardous areas (e.g., Class I, Division 1) and specific applications could provide even more granular insight into market dynamics. This detailed understanding will enable businesses to effectively target their product development and marketing strategies.
Hazardous Area Equipment Market: A Comprehensive Report (2019-2033)
This detailed report provides a comprehensive analysis of the Hazardous Area Equipment market, offering valuable insights for industry stakeholders, investors, and strategic decision-makers. Covering the period from 2019 to 2033, with a focus on 2025, this report meticulously examines market dynamics, competitive landscapes, and future growth prospects. The market is segmented by equipment type and end-user industry, offering granular data for informed strategic planning.
Hazardous Area Equipment Market Market Concentration & Innovation
The Hazardous Area Equipment market exhibits a moderately concentrated landscape, with several major players holding significant market share. However, the presence of numerous smaller, specialized companies fosters innovation and competition. Market share data indicates that the top five players collectively account for approximately xx% of the global market in 2025, while the remaining share is distributed among numerous smaller participants. Innovation is driven by stringent safety regulations, the demand for enhanced efficiency and productivity in hazardous environments, and advancements in technologies such as IoT and AI. Regulatory frameworks, such as those defined by ATEX and IECEx, significantly influence product development and adoption. The market also witnesses continuous product substitution, with newer, more efficient, and safer equipment gradually replacing older technologies. Significant M&A activity is observed, with deal values exceeding xx Million in recent years, primarily driven by expansion strategies and technological acquisitions. Key trends include:
- Increasing adoption of intrinsically safe equipment.
- Growing demand for remote monitoring and control systems.
- Focus on reducing operational costs through improved equipment efficiency.
- Stringent safety regulations driving innovation in explosion-proof and flameproof technologies.
- Strategic partnerships and collaborations for technological advancements.
Hazardous Area Equipment Market Industry Trends & Insights
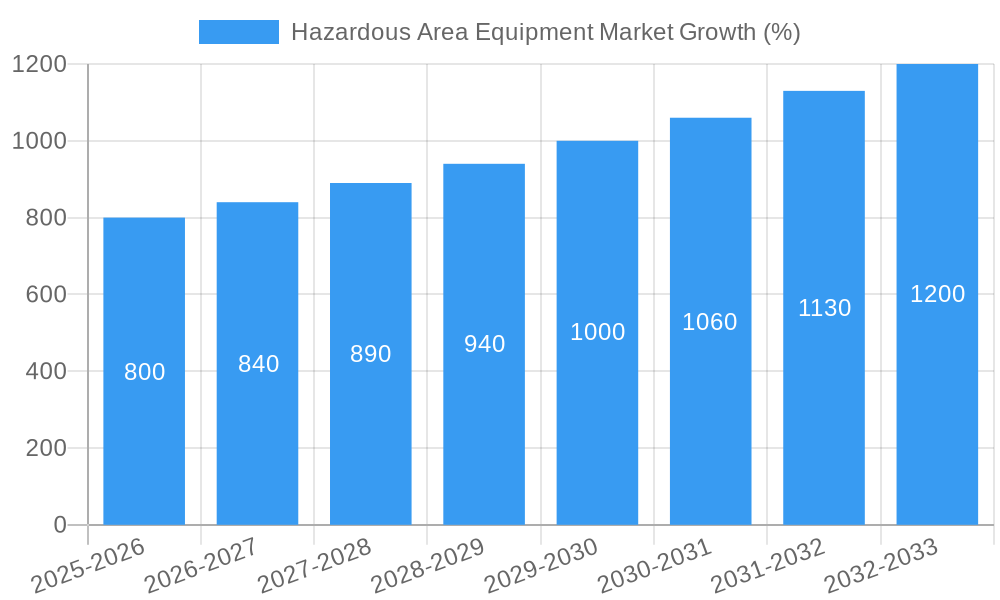
The Hazardous Area Equipment market is experiencing robust growth, with a projected Compound Annual Growth Rate (CAGR) of xx% during the forecast period (2025-2033). This growth is primarily propelled by the rising demand for safety and efficiency enhancements across various end-user industries. The increasing adoption of automation and digitalization across sectors like Oil & Gas and Energy & Power Generation is a significant driver. Technological disruptions, including the integration of IoT and AI, are enhancing equipment functionalities and operational safety. Consumer preferences are increasingly shifting towards advanced, intelligent equipment offering remote monitoring capabilities and predictive maintenance features. The competitive dynamics are characterized by intense competition among established players and the emergence of new entrants, leading to continuous product innovation and price optimization. Market penetration of advanced technologies like wireless communication and explosion-proof sensors is rapidly increasing, demonstrating the industry's commitment to enhanced safety and operational efficiency.
Dominant Markets & Segments in Hazardous Area Equipment Market
The Oil and Gas sector remains the dominant end-user industry for Hazardous Area Equipment, accounting for approximately xx% of the market share in 2025, due to stringent safety regulations and the inherent risks associated with its operations. This segment is expected to maintain its leading position throughout the forecast period. The Energy and Power Generation sector is another significant market, with a market share of approximately xx% in 2025. Geographically, North America and Europe currently hold the largest market shares, with robust industrial activity and a strong regulatory framework. However, Asia-Pacific is expected to exhibit the fastest growth rate due to ongoing infrastructure development and industrialization.
- Key Drivers in Oil & Gas: Stringent safety regulations, increasing offshore exploration, and rising demand for energy.
- Key Drivers in Energy & Power Generation: Growing renewable energy capacity, modernization of existing infrastructure, and increasing focus on grid stability.
- Key Drivers in North America: Strong industrial base, robust regulatory framework, and high capital expenditure.
- Key Drivers in Europe: Stringent safety regulations, focus on sustainable energy solutions, and ongoing industrial modernization.
- Key Drivers in Asia-Pacific: Rapid industrialization, infrastructure development, and significant investments in energy infrastructure.
By Equipment: Power Supply Systems and Automation and Control Products currently hold the largest market shares, driven by the increasing complexity of hazardous area operations. Other segments, such as Enclosures and Cable Glands and Connectors, exhibit steady growth, fueled by the demand for robust and reliable equipment.
Hazardous Area Equipment Market Product Developments
Recent product innovations focus on enhancing safety, efficiency, and connectivity. Manufacturers are integrating advanced technologies like wireless communication, remote monitoring capabilities, and predictive maintenance functionalities into their equipment. This provides significant competitive advantages, allowing companies to offer more reliable, efficient, and safer solutions to their customers. The market is witnessing a strong trend towards intrinsically safe equipment and the adoption of advanced materials for improved durability and longevity in harsh environments.
Report Scope & Segmentation Analysis
This report comprehensively analyzes the Hazardous Area Equipment market across various segments:
By Equipment: Power Supply Systems, Electric Motors, Surveillance Systems, Cable Glands and Connectors, Automation and Control Products, Enclosures, Lighting Products, Push Buttons and Signaling Devices. Each segment's growth projections, market size, and competitive dynamics are analyzed in detail.
By End-user Industry: Oil and Gas, Energy and Power Generation, Chemical, Food and Beverage, Pharmaceuticals, Other End-user Industries. The report assesses the specific needs and trends within each industry and projects their impact on market growth.
Key Drivers of Hazardous Area Equipment Market Growth
Several factors drive market growth: increasing demand for safety and efficiency in hazardous environments, stringent government regulations, technological advancements, and rising investments in infrastructure development across various industries. Stringent safety standards mandate the adoption of specialized equipment, propelling market demand. Furthermore, increasing automation and digitization trends across industrial sectors further drive market growth.
Challenges in the Hazardous Area Equipment Market Sector
The Hazardous Area Equipment market faces challenges such as high initial investment costs, complex installation procedures, and the need for specialized expertise. Supply chain disruptions and fluctuating raw material prices can also impact profitability. Intense competition among existing players and the emergence of new entrants present ongoing challenges for market participants.
Emerging Opportunities in Hazardous Area Equipment Market
Emerging opportunities lie in the development of innovative solutions leveraging IoT, AI, and big data analytics for remote monitoring, predictive maintenance, and enhanced safety. The expanding adoption of renewable energy sources also presents significant growth opportunities for the market. Focus on sustainability and eco-friendly solutions represents a substantial area for market expansion.
Leading Players in the Hazardous Area Equipment Market Market
- R Stahl AG
- ABB Ltd
- Hangzhou Hikvision Digital Technology Co Ltd
- Adalet Inc (Scott Fetzer Company)
- Bartec GmbH
- Honeywell HBT
- Supermec Pte Ltd
- Marechal Electric Group
- Siemens AG
- Eaton Corporation PLC
- CZ Electric Co Ltd
- G M International Srl
- Spina Group SRL
- Phoenix Mecano
- Warom Technology Inc Co
- Rockwell Automation Inc
- Cordex Instruments Ltd
- Pepperl+Fuchs GmbH
- Alloy Industry Co Ltd
- Wago GmbH & Co KG
Key Developments in Hazardous Area Equipment Market Industry
- June 2023: Siemens AG announced a EUR 2 billion (USD 2.11 billion) investment in new manufacturing capacity, innovation labs, education centers, and other sites, including a new high-tech factory in Singapore.
- May 2023: R. Stahl AG expanded its product portfolio with the 8150/5-V88 series socket panels designed for particle-contamination-free applications in hazardous areas (Zones 1, 2, 21, and 22).
Strategic Outlook for Hazardous Area Equipment Market Market
The Hazardous Area Equipment market is poised for significant growth driven by continuous technological advancements, rising safety concerns, and expanding industrial activities globally. The increasing adoption of smart technologies, remote monitoring systems, and the integration of IoT and AI will create lucrative opportunities for market participants. Companies that focus on innovation, product differentiation, and strong customer relationships are expected to thrive in this competitive landscape.
Hazardous Area Equipment Market Segmentation
-
1. Equipment
- 1.1. Power Supply Systems
- 1.2. Electric Motors
- 1.3. Surveillance Systems
- 1.4. Cable Glands and Connectors
- 1.5. Automation and Control Products
- 1.6. Enclosures
- 1.7. Lighting Products
- 1.8. Push Buttons and Signaling Devices
-
2. End-user Industry
- 2.1. Oil and Gas
- 2.2. Energy and Power Generation
- 2.3. Chemical
- 2.4. Food and Beverage
- 2.5. Pharmaceuticals
- 2.6. Other End-user Industries
Hazardous Area Equipment Market Segmentation By Geography
-
1. North America
- 1.1. United States
- 1.2. Canada
-
2. Europe
- 2.1. United Kingdom
- 2.2. Germany
-
3. List of Manufacturers of Hazardous Equipment
- 3.1. France
- 3.2. Spain
- 3.3. Italy
- 3.4. Benelux
-
4. Asia
- 4.1. China
- 4.2. India
- 4.3. Japan
- 4.4. South Korea
- 4.5. Australia and New Zealand
-
5. Latin America
- 5.1. Mexico
- 5.2. Brazil
-
6. Middle East and Africa
- 6.1. United Arab Emirates
- 6.2. Saudi Arabia
- 6.3. South Africa
Hazardous Area Equipment Market REPORT HIGHLIGHTS
| Aspects | Details |
|---|---|
| Study Period | 2019-2033 |
| Base Year | 2024 |
| Estimated Year | 2025 |
| Forecast Period | 2025-2033 |
| Historical Period | 2019-2024 |
| Growth Rate | CAGR of 6.62% from 2019-2033 |
| Segmentation |
|
Table of Contents
- 1. Introduction
- 1.1. Research Scope
- 1.2. Market Segmentation
- 1.3. Research Methodology
- 1.4. Definitions and Assumptions
- 2. Executive Summary
- 2.1. Introduction
- 3. Market Dynamics
- 3.1. Introduction
- 3.2. Market Drivers
- 3.2.1 Stricter Regulations for Handling Hazardous Areas and Substances; Increasing Energy Requirements
- 3.2.2 Driving the Demand for Exploration of New Mines
- 3.3. Market Restrains
- 3.3.1. High Investments and High Installation Cost of the Equipment
- 3.4. Market Trends
- 3.4.1. Oil and Gas End-user Industry Segment is Expected to Hold Significant Market Share
- 4. Market Factor Analysis
- 4.1. Porters Five Forces
- 4.2. Supply/Value Chain
- 4.3. PESTEL analysis
- 4.4. Market Entropy
- 4.5. Patent/Trademark Analysis
- 5. Global Hazardous Area Equipment Market Analysis, Insights and Forecast, 2019-2031
- 5.1. Market Analysis, Insights and Forecast - by Equipment
- 5.1.1. Power Supply Systems
- 5.1.2. Electric Motors
- 5.1.3. Surveillance Systems
- 5.1.4. Cable Glands and Connectors
- 5.1.5. Automation and Control Products
- 5.1.6. Enclosures
- 5.1.7. Lighting Products
- 5.1.8. Push Buttons and Signaling Devices
- 5.2. Market Analysis, Insights and Forecast - by End-user Industry
- 5.2.1. Oil and Gas
- 5.2.2. Energy and Power Generation
- 5.2.3. Chemical
- 5.2.4. Food and Beverage
- 5.2.5. Pharmaceuticals
- 5.2.6. Other End-user Industries
- 5.3. Market Analysis, Insights and Forecast - by Region
- 5.3.1. North America
- 5.3.2. Europe
- 5.3.3. List of Manufacturers of Hazardous Equipment
- 5.3.4. Asia
- 5.3.5. Latin America
- 5.3.6. Middle East and Africa
- 5.1. Market Analysis, Insights and Forecast - by Equipment
- 6. North America Hazardous Area Equipment Market Analysis, Insights and Forecast, 2019-2031
- 6.1. Market Analysis, Insights and Forecast - by Equipment
- 6.1.1. Power Supply Systems
- 6.1.2. Electric Motors
- 6.1.3. Surveillance Systems
- 6.1.4. Cable Glands and Connectors
- 6.1.5. Automation and Control Products
- 6.1.6. Enclosures
- 6.1.7. Lighting Products
- 6.1.8. Push Buttons and Signaling Devices
- 6.2. Market Analysis, Insights and Forecast - by End-user Industry
- 6.2.1. Oil and Gas
- 6.2.2. Energy and Power Generation
- 6.2.3. Chemical
- 6.2.4. Food and Beverage
- 6.2.5. Pharmaceuticals
- 6.2.6. Other End-user Industries
- 6.1. Market Analysis, Insights and Forecast - by Equipment
- 7. Europe Hazardous Area Equipment Market Analysis, Insights and Forecast, 2019-2031
- 7.1. Market Analysis, Insights and Forecast - by Equipment
- 7.1.1. Power Supply Systems
- 7.1.2. Electric Motors
- 7.1.3. Surveillance Systems
- 7.1.4. Cable Glands and Connectors
- 7.1.5. Automation and Control Products
- 7.1.6. Enclosures
- 7.1.7. Lighting Products
- 7.1.8. Push Buttons and Signaling Devices
- 7.2. Market Analysis, Insights and Forecast - by End-user Industry
- 7.2.1. Oil and Gas
- 7.2.2. Energy and Power Generation
- 7.2.3. Chemical
- 7.2.4. Food and Beverage
- 7.2.5. Pharmaceuticals
- 7.2.6. Other End-user Industries
- 7.1. Market Analysis, Insights and Forecast - by Equipment
- 8. List of Manufacturers of Hazardous Equipment Hazardous Area Equipment Market Analysis, Insights and Forecast, 2019-2031
- 8.1. Market Analysis, Insights and Forecast - by Equipment
- 8.1.1. Power Supply Systems
- 8.1.2. Electric Motors
- 8.1.3. Surveillance Systems
- 8.1.4. Cable Glands and Connectors
- 8.1.5. Automation and Control Products
- 8.1.6. Enclosures
- 8.1.7. Lighting Products
- 8.1.8. Push Buttons and Signaling Devices
- 8.2. Market Analysis, Insights and Forecast - by End-user Industry
- 8.2.1. Oil and Gas
- 8.2.2. Energy and Power Generation
- 8.2.3. Chemical
- 8.2.4. Food and Beverage
- 8.2.5. Pharmaceuticals
- 8.2.6. Other End-user Industries
- 8.1. Market Analysis, Insights and Forecast - by Equipment
- 9. Asia Hazardous Area Equipment Market Analysis, Insights and Forecast, 2019-2031
- 9.1. Market Analysis, Insights and Forecast - by Equipment
- 9.1.1. Power Supply Systems
- 9.1.2. Electric Motors
- 9.1.3. Surveillance Systems
- 9.1.4. Cable Glands and Connectors
- 9.1.5. Automation and Control Products
- 9.1.6. Enclosures
- 9.1.7. Lighting Products
- 9.1.8. Push Buttons and Signaling Devices
- 9.2. Market Analysis, Insights and Forecast - by End-user Industry
- 9.2.1. Oil and Gas
- 9.2.2. Energy and Power Generation
- 9.2.3. Chemical
- 9.2.4. Food and Beverage
- 9.2.5. Pharmaceuticals
- 9.2.6. Other End-user Industries
- 9.1. Market Analysis, Insights and Forecast - by Equipment
- 10. Latin America Hazardous Area Equipment Market Analysis, Insights and Forecast, 2019-2031
- 10.1. Market Analysis, Insights and Forecast - by Equipment
- 10.1.1. Power Supply Systems
- 10.1.2. Electric Motors
- 10.1.3. Surveillance Systems
- 10.1.4. Cable Glands and Connectors
- 10.1.5. Automation and Control Products
- 10.1.6. Enclosures
- 10.1.7. Lighting Products
- 10.1.8. Push Buttons and Signaling Devices
- 10.2. Market Analysis, Insights and Forecast - by End-user Industry
- 10.2.1. Oil and Gas
- 10.2.2. Energy and Power Generation
- 10.2.3. Chemical
- 10.2.4. Food and Beverage
- 10.2.5. Pharmaceuticals
- 10.2.6. Other End-user Industries
- 10.1. Market Analysis, Insights and Forecast - by Equipment
- 11. Middle East and Africa Hazardous Area Equipment Market Analysis, Insights and Forecast, 2019-2031
- 11.1. Market Analysis, Insights and Forecast - by Equipment
- 11.1.1. Power Supply Systems
- 11.1.2. Electric Motors
- 11.1.3. Surveillance Systems
- 11.1.4. Cable Glands and Connectors
- 11.1.5. Automation and Control Products
- 11.1.6. Enclosures
- 11.1.7. Lighting Products
- 11.1.8. Push Buttons and Signaling Devices
- 11.2. Market Analysis, Insights and Forecast - by End-user Industry
- 11.2.1. Oil and Gas
- 11.2.2. Energy and Power Generation
- 11.2.3. Chemical
- 11.2.4. Food and Beverage
- 11.2.5. Pharmaceuticals
- 11.2.6. Other End-user Industries
- 11.1. Market Analysis, Insights and Forecast - by Equipment
- 12. North America Hazardous Area Equipment Market Analysis, Insights and Forecast, 2019-2031
- 12.1. Market Analysis, Insights and Forecast - By Country/Sub-region
- 12.1.1 United States
- 12.1.2 Canada
- 12.1.3 Mexico
- 13. Europe Hazardous Area Equipment Market Analysis, Insights and Forecast, 2019-2031
- 13.1. Market Analysis, Insights and Forecast - By Country/Sub-region
- 13.1.1 Germany
- 13.1.2 United Kingdom
- 13.1.3 France
- 13.1.4 Spain
- 13.1.5 Italy
- 13.1.6 Spain
- 13.1.7 Belgium
- 13.1.8 Netherland
- 13.1.9 Nordics
- 13.1.10 Rest of Europe
- 14. Asia Pacific Hazardous Area Equipment Market Analysis, Insights and Forecast, 2019-2031
- 14.1. Market Analysis, Insights and Forecast - By Country/Sub-region
- 14.1.1 China
- 14.1.2 Japan
- 14.1.3 India
- 14.1.4 South Korea
- 14.1.5 Southeast Asia
- 14.1.6 Australia
- 14.1.7 Indonesia
- 14.1.8 Phillipes
- 14.1.9 Singapore
- 14.1.10 Thailandc
- 14.1.11 Rest of Asia Pacific
- 15. South America Hazardous Area Equipment Market Analysis, Insights and Forecast, 2019-2031
- 15.1. Market Analysis, Insights and Forecast - By Country/Sub-region
- 15.1.1 Brazil
- 15.1.2 Argentina
- 15.1.3 Peru
- 15.1.4 Chile
- 15.1.5 Colombia
- 15.1.6 Ecuador
- 15.1.7 Venezuela
- 15.1.8 Rest of South America
- 16. North America Hazardous Area Equipment Market Analysis, Insights and Forecast, 2019-2031
- 16.1. Market Analysis, Insights and Forecast - By Country/Sub-region
- 16.1.1 United States
- 16.1.2 Canada
- 16.1.3 Mexico
- 17. MEA Hazardous Area Equipment Market Analysis, Insights and Forecast, 2019-2031
- 17.1. Market Analysis, Insights and Forecast - By Country/Sub-region
- 17.1.1 United Arab Emirates
- 17.1.2 Saudi Arabia
- 17.1.3 South Africa
- 17.1.4 Rest of Middle East and Africa
- 18. Competitive Analysis
- 18.1. Global Market Share Analysis 2024
- 18.2. Company Profiles
- 18.2.1 R Stahl AG
- 18.2.1.1. Overview
- 18.2.1.2. Products
- 18.2.1.3. SWOT Analysis
- 18.2.1.4. Recent Developments
- 18.2.1.5. Financials (Based on Availability)
- 18.2.2 ABB Ltd
- 18.2.2.1. Overview
- 18.2.2.2. Products
- 18.2.2.3. SWOT Analysis
- 18.2.2.4. Recent Developments
- 18.2.2.5. Financials (Based on Availability)
- 18.2.3 Hangzhou Hikvision Digital Technology Co Ltd*List Not Exhaustive
- 18.2.3.1. Overview
- 18.2.3.2. Products
- 18.2.3.3. SWOT Analysis
- 18.2.3.4. Recent Developments
- 18.2.3.5. Financials (Based on Availability)
- 18.2.4 Adalet Inc (Scott Fetzer Company)
- 18.2.4.1. Overview
- 18.2.4.2. Products
- 18.2.4.3. SWOT Analysis
- 18.2.4.4. Recent Developments
- 18.2.4.5. Financials (Based on Availability)
- 18.2.5 Bartec GmbH
- 18.2.5.1. Overview
- 18.2.5.2. Products
- 18.2.5.3. SWOT Analysis
- 18.2.5.4. Recent Developments
- 18.2.5.5. Financials (Based on Availability)
- 18.2.6 Honeywell HBT
- 18.2.6.1. Overview
- 18.2.6.2. Products
- 18.2.6.3. SWOT Analysis
- 18.2.6.4. Recent Developments
- 18.2.6.5. Financials (Based on Availability)
- 18.2.7 Supermec Pte Ltd
- 18.2.7.1. Overview
- 18.2.7.2. Products
- 18.2.7.3. SWOT Analysis
- 18.2.7.4. Recent Developments
- 18.2.7.5. Financials (Based on Availability)
- 18.2.8 Marechal Electric Group
- 18.2.8.1. Overview
- 18.2.8.2. Products
- 18.2.8.3. SWOT Analysis
- 18.2.8.4. Recent Developments
- 18.2.8.5. Financials (Based on Availability)
- 18.2.9 Siemens AG
- 18.2.9.1. Overview
- 18.2.9.2. Products
- 18.2.9.3. SWOT Analysis
- 18.2.9.4. Recent Developments
- 18.2.9.5. Financials (Based on Availability)
- 18.2.10 Eaton Corporation PLC
- 18.2.10.1. Overview
- 18.2.10.2. Products
- 18.2.10.3. SWOT Analysis
- 18.2.10.4. Recent Developments
- 18.2.10.5. Financials (Based on Availability)
- 18.2.11 CZ Electric Co Ltd
- 18.2.11.1. Overview
- 18.2.11.2. Products
- 18.2.11.3. SWOT Analysis
- 18.2.11.4. Recent Developments
- 18.2.11.5. Financials (Based on Availability)
- 18.2.12 G M International Srl
- 18.2.12.1. Overview
- 18.2.12.2. Products
- 18.2.12.3. SWOT Analysis
- 18.2.12.4. Recent Developments
- 18.2.12.5. Financials (Based on Availability)
- 18.2.13 Spina Group SRL
- 18.2.13.1. Overview
- 18.2.13.2. Products
- 18.2.13.3. SWOT Analysis
- 18.2.13.4. Recent Developments
- 18.2.13.5. Financials (Based on Availability)
- 18.2.14 Phoenix Mecano
- 18.2.14.1. Overview
- 18.2.14.2. Products
- 18.2.14.3. SWOT Analysis
- 18.2.14.4. Recent Developments
- 18.2.14.5. Financials (Based on Availability)
- 18.2.15 Warom Technology Inc Co
- 18.2.15.1. Overview
- 18.2.15.2. Products
- 18.2.15.3. SWOT Analysis
- 18.2.15.4. Recent Developments
- 18.2.15.5. Financials (Based on Availability)
- 18.2.16 Rockwell Automation Inc
- 18.2.16.1. Overview
- 18.2.16.2. Products
- 18.2.16.3. SWOT Analysis
- 18.2.16.4. Recent Developments
- 18.2.16.5. Financials (Based on Availability)
- 18.2.17 Cordex Instruments Ltd
- 18.2.17.1. Overview
- 18.2.17.2. Products
- 18.2.17.3. SWOT Analysis
- 18.2.17.4. Recent Developments
- 18.2.17.5. Financials (Based on Availability)
- 18.2.18 Pepperl+Fuchs GmbH
- 18.2.18.1. Overview
- 18.2.18.2. Products
- 18.2.18.3. SWOT Analysis
- 18.2.18.4. Recent Developments
- 18.2.18.5. Financials (Based on Availability)
- 18.2.19 Alloy Industry Co Ltd
- 18.2.19.1. Overview
- 18.2.19.2. Products
- 18.2.19.3. SWOT Analysis
- 18.2.19.4. Recent Developments
- 18.2.19.5. Financials (Based on Availability)
- 18.2.20 Wago GmbH & Co KG
- 18.2.20.1. Overview
- 18.2.20.2. Products
- 18.2.20.3. SWOT Analysis
- 18.2.20.4. Recent Developments
- 18.2.20.5. Financials (Based on Availability)
- 18.2.1 R Stahl AG
List of Figures
- Figure 1: Global Hazardous Area Equipment Market Revenue Breakdown (Million, %) by Region 2024 & 2032
- Figure 2: North America Hazardous Area Equipment Market Revenue (Million), by Country 2024 & 2032
- Figure 3: North America Hazardous Area Equipment Market Revenue Share (%), by Country 2024 & 2032
- Figure 4: Europe Hazardous Area Equipment Market Revenue (Million), by Country 2024 & 2032
- Figure 5: Europe Hazardous Area Equipment Market Revenue Share (%), by Country 2024 & 2032
- Figure 6: Asia Pacific Hazardous Area Equipment Market Revenue (Million), by Country 2024 & 2032
- Figure 7: Asia Pacific Hazardous Area Equipment Market Revenue Share (%), by Country 2024 & 2032
- Figure 8: South America Hazardous Area Equipment Market Revenue (Million), by Country 2024 & 2032
- Figure 9: South America Hazardous Area Equipment Market Revenue Share (%), by Country 2024 & 2032
- Figure 10: North America Hazardous Area Equipment Market Revenue (Million), by Country 2024 & 2032
- Figure 11: North America Hazardous Area Equipment Market Revenue Share (%), by Country 2024 & 2032
- Figure 12: MEA Hazardous Area Equipment Market Revenue (Million), by Country 2024 & 2032
- Figure 13: MEA Hazardous Area Equipment Market Revenue Share (%), by Country 2024 & 2032
- Figure 14: North America Hazardous Area Equipment Market Revenue (Million), by Equipment 2024 & 2032
- Figure 15: North America Hazardous Area Equipment Market Revenue Share (%), by Equipment 2024 & 2032
- Figure 16: North America Hazardous Area Equipment Market Revenue (Million), by End-user Industry 2024 & 2032
- Figure 17: North America Hazardous Area Equipment Market Revenue Share (%), by End-user Industry 2024 & 2032
- Figure 18: North America Hazardous Area Equipment Market Revenue (Million), by Country 2024 & 2032
- Figure 19: North America Hazardous Area Equipment Market Revenue Share (%), by Country 2024 & 2032
- Figure 20: Europe Hazardous Area Equipment Market Revenue (Million), by Equipment 2024 & 2032
- Figure 21: Europe Hazardous Area Equipment Market Revenue Share (%), by Equipment 2024 & 2032
- Figure 22: Europe Hazardous Area Equipment Market Revenue (Million), by End-user Industry 2024 & 2032
- Figure 23: Europe Hazardous Area Equipment Market Revenue Share (%), by End-user Industry 2024 & 2032
- Figure 24: Europe Hazardous Area Equipment Market Revenue (Million), by Country 2024 & 2032
- Figure 25: Europe Hazardous Area Equipment Market Revenue Share (%), by Country 2024 & 2032
- Figure 26: List of Manufacturers of Hazardous Equipment Hazardous Area Equipment Market Revenue (Million), by Equipment 2024 & 2032
- Figure 27: List of Manufacturers of Hazardous Equipment Hazardous Area Equipment Market Revenue Share (%), by Equipment 2024 & 2032
- Figure 28: List of Manufacturers of Hazardous Equipment Hazardous Area Equipment Market Revenue (Million), by End-user Industry 2024 & 2032
- Figure 29: List of Manufacturers of Hazardous Equipment Hazardous Area Equipment Market Revenue Share (%), by End-user Industry 2024 & 2032
- Figure 30: List of Manufacturers of Hazardous Equipment Hazardous Area Equipment Market Revenue (Million), by Country 2024 & 2032
- Figure 31: List of Manufacturers of Hazardous Equipment Hazardous Area Equipment Market Revenue Share (%), by Country 2024 & 2032
- Figure 32: Asia Hazardous Area Equipment Market Revenue (Million), by Equipment 2024 & 2032
- Figure 33: Asia Hazardous Area Equipment Market Revenue Share (%), by Equipment 2024 & 2032
- Figure 34: Asia Hazardous Area Equipment Market Revenue (Million), by End-user Industry 2024 & 2032
- Figure 35: Asia Hazardous Area Equipment Market Revenue Share (%), by End-user Industry 2024 & 2032
- Figure 36: Asia Hazardous Area Equipment Market Revenue (Million), by Country 2024 & 2032
- Figure 37: Asia Hazardous Area Equipment Market Revenue Share (%), by Country 2024 & 2032
- Figure 38: Latin America Hazardous Area Equipment Market Revenue (Million), by Equipment 2024 & 2032
- Figure 39: Latin America Hazardous Area Equipment Market Revenue Share (%), by Equipment 2024 & 2032
- Figure 40: Latin America Hazardous Area Equipment Market Revenue (Million), by End-user Industry 2024 & 2032
- Figure 41: Latin America Hazardous Area Equipment Market Revenue Share (%), by End-user Industry 2024 & 2032
- Figure 42: Latin America Hazardous Area Equipment Market Revenue (Million), by Country 2024 & 2032
- Figure 43: Latin America Hazardous Area Equipment Market Revenue Share (%), by Country 2024 & 2032
- Figure 44: Middle East and Africa Hazardous Area Equipment Market Revenue (Million), by Equipment 2024 & 2032
- Figure 45: Middle East and Africa Hazardous Area Equipment Market Revenue Share (%), by Equipment 2024 & 2032
- Figure 46: Middle East and Africa Hazardous Area Equipment Market Revenue (Million), by End-user Industry 2024 & 2032
- Figure 47: Middle East and Africa Hazardous Area Equipment Market Revenue Share (%), by End-user Industry 2024 & 2032
- Figure 48: Middle East and Africa Hazardous Area Equipment Market Revenue (Million), by Country 2024 & 2032
- Figure 49: Middle East and Africa Hazardous Area Equipment Market Revenue Share (%), by Country 2024 & 2032
List of Tables
- Table 1: Global Hazardous Area Equipment Market Revenue Million Forecast, by Region 2019 & 2032
- Table 2: Global Hazardous Area Equipment Market Revenue Million Forecast, by Equipment 2019 & 2032
- Table 3: Global Hazardous Area Equipment Market Revenue Million Forecast, by End-user Industry 2019 & 2032
- Table 4: Global Hazardous Area Equipment Market Revenue Million Forecast, by Region 2019 & 2032
- Table 5: Global Hazardous Area Equipment Market Revenue Million Forecast, by Country 2019 & 2032
- Table 6: United States Hazardous Area Equipment Market Revenue (Million) Forecast, by Application 2019 & 2032
- Table 7: Canada Hazardous Area Equipment Market Revenue (Million) Forecast, by Application 2019 & 2032
- Table 8: Mexico Hazardous Area Equipment Market Revenue (Million) Forecast, by Application 2019 & 2032
- Table 9: Global Hazardous Area Equipment Market Revenue Million Forecast, by Country 2019 & 2032
- Table 10: Germany Hazardous Area Equipment Market Revenue (Million) Forecast, by Application 2019 & 2032
- Table 11: United Kingdom Hazardous Area Equipment Market Revenue (Million) Forecast, by Application 2019 & 2032
- Table 12: France Hazardous Area Equipment Market Revenue (Million) Forecast, by Application 2019 & 2032
- Table 13: Spain Hazardous Area Equipment Market Revenue (Million) Forecast, by Application 2019 & 2032
- Table 14: Italy Hazardous Area Equipment Market Revenue (Million) Forecast, by Application 2019 & 2032
- Table 15: Spain Hazardous Area Equipment Market Revenue (Million) Forecast, by Application 2019 & 2032
- Table 16: Belgium Hazardous Area Equipment Market Revenue (Million) Forecast, by Application 2019 & 2032
- Table 17: Netherland Hazardous Area Equipment Market Revenue (Million) Forecast, by Application 2019 & 2032
- Table 18: Nordics Hazardous Area Equipment Market Revenue (Million) Forecast, by Application 2019 & 2032
- Table 19: Rest of Europe Hazardous Area Equipment Market Revenue (Million) Forecast, by Application 2019 & 2032
- Table 20: Global Hazardous Area Equipment Market Revenue Million Forecast, by Country 2019 & 2032
- Table 21: China Hazardous Area Equipment Market Revenue (Million) Forecast, by Application 2019 & 2032
- Table 22: Japan Hazardous Area Equipment Market Revenue (Million) Forecast, by Application 2019 & 2032
- Table 23: India Hazardous Area Equipment Market Revenue (Million) Forecast, by Application 2019 & 2032
- Table 24: South Korea Hazardous Area Equipment Market Revenue (Million) Forecast, by Application 2019 & 2032
- Table 25: Southeast Asia Hazardous Area Equipment Market Revenue (Million) Forecast, by Application 2019 & 2032
- Table 26: Australia Hazardous Area Equipment Market Revenue (Million) Forecast, by Application 2019 & 2032
- Table 27: Indonesia Hazardous Area Equipment Market Revenue (Million) Forecast, by Application 2019 & 2032
- Table 28: Phillipes Hazardous Area Equipment Market Revenue (Million) Forecast, by Application 2019 & 2032
- Table 29: Singapore Hazardous Area Equipment Market Revenue (Million) Forecast, by Application 2019 & 2032
- Table 30: Thailandc Hazardous Area Equipment Market Revenue (Million) Forecast, by Application 2019 & 2032
- Table 31: Rest of Asia Pacific Hazardous Area Equipment Market Revenue (Million) Forecast, by Application 2019 & 2032
- Table 32: Global Hazardous Area Equipment Market Revenue Million Forecast, by Country 2019 & 2032
- Table 33: Brazil Hazardous Area Equipment Market Revenue (Million) Forecast, by Application 2019 & 2032
- Table 34: Argentina Hazardous Area Equipment Market Revenue (Million) Forecast, by Application 2019 & 2032
- Table 35: Peru Hazardous Area Equipment Market Revenue (Million) Forecast, by Application 2019 & 2032
- Table 36: Chile Hazardous Area Equipment Market Revenue (Million) Forecast, by Application 2019 & 2032
- Table 37: Colombia Hazardous Area Equipment Market Revenue (Million) Forecast, by Application 2019 & 2032
- Table 38: Ecuador Hazardous Area Equipment Market Revenue (Million) Forecast, by Application 2019 & 2032
- Table 39: Venezuela Hazardous Area Equipment Market Revenue (Million) Forecast, by Application 2019 & 2032
- Table 40: Rest of South America Hazardous Area Equipment Market Revenue (Million) Forecast, by Application 2019 & 2032
- Table 41: Global Hazardous Area Equipment Market Revenue Million Forecast, by Country 2019 & 2032
- Table 42: United States Hazardous Area Equipment Market Revenue (Million) Forecast, by Application 2019 & 2032
- Table 43: Canada Hazardous Area Equipment Market Revenue (Million) Forecast, by Application 2019 & 2032
- Table 44: Mexico Hazardous Area Equipment Market Revenue (Million) Forecast, by Application 2019 & 2032
- Table 45: Global Hazardous Area Equipment Market Revenue Million Forecast, by Country 2019 & 2032
- Table 46: United Arab Emirates Hazardous Area Equipment Market Revenue (Million) Forecast, by Application 2019 & 2032
- Table 47: Saudi Arabia Hazardous Area Equipment Market Revenue (Million) Forecast, by Application 2019 & 2032
- Table 48: South Africa Hazardous Area Equipment Market Revenue (Million) Forecast, by Application 2019 & 2032
- Table 49: Rest of Middle East and Africa Hazardous Area Equipment Market Revenue (Million) Forecast, by Application 2019 & 2032
- Table 50: Global Hazardous Area Equipment Market Revenue Million Forecast, by Equipment 2019 & 2032
- Table 51: Global Hazardous Area Equipment Market Revenue Million Forecast, by End-user Industry 2019 & 2032
- Table 52: Global Hazardous Area Equipment Market Revenue Million Forecast, by Country 2019 & 2032
- Table 53: United States Hazardous Area Equipment Market Revenue (Million) Forecast, by Application 2019 & 2032
- Table 54: Canada Hazardous Area Equipment Market Revenue (Million) Forecast, by Application 2019 & 2032
- Table 55: Global Hazardous Area Equipment Market Revenue Million Forecast, by Equipment 2019 & 2032
- Table 56: Global Hazardous Area Equipment Market Revenue Million Forecast, by End-user Industry 2019 & 2032
- Table 57: Global Hazardous Area Equipment Market Revenue Million Forecast, by Country 2019 & 2032
- Table 58: United Kingdom Hazardous Area Equipment Market Revenue (Million) Forecast, by Application 2019 & 2032
- Table 59: Germany Hazardous Area Equipment Market Revenue (Million) Forecast, by Application 2019 & 2032
- Table 60: Global Hazardous Area Equipment Market Revenue Million Forecast, by Equipment 2019 & 2032
- Table 61: Global Hazardous Area Equipment Market Revenue Million Forecast, by End-user Industry 2019 & 2032
- Table 62: Global Hazardous Area Equipment Market Revenue Million Forecast, by Country 2019 & 2032
- Table 63: France Hazardous Area Equipment Market Revenue (Million) Forecast, by Application 2019 & 2032
- Table 64: Spain Hazardous Area Equipment Market Revenue (Million) Forecast, by Application 2019 & 2032
- Table 65: Italy Hazardous Area Equipment Market Revenue (Million) Forecast, by Application 2019 & 2032
- Table 66: Benelux Hazardous Area Equipment Market Revenue (Million) Forecast, by Application 2019 & 2032
- Table 67: Global Hazardous Area Equipment Market Revenue Million Forecast, by Equipment 2019 & 2032
- Table 68: Global Hazardous Area Equipment Market Revenue Million Forecast, by End-user Industry 2019 & 2032
- Table 69: Global Hazardous Area Equipment Market Revenue Million Forecast, by Country 2019 & 2032
- Table 70: China Hazardous Area Equipment Market Revenue (Million) Forecast, by Application 2019 & 2032
- Table 71: India Hazardous Area Equipment Market Revenue (Million) Forecast, by Application 2019 & 2032
- Table 72: Japan Hazardous Area Equipment Market Revenue (Million) Forecast, by Application 2019 & 2032
- Table 73: South Korea Hazardous Area Equipment Market Revenue (Million) Forecast, by Application 2019 & 2032
- Table 74: Australia and New Zealand Hazardous Area Equipment Market Revenue (Million) Forecast, by Application 2019 & 2032
- Table 75: Global Hazardous Area Equipment Market Revenue Million Forecast, by Equipment 2019 & 2032
- Table 76: Global Hazardous Area Equipment Market Revenue Million Forecast, by End-user Industry 2019 & 2032
- Table 77: Global Hazardous Area Equipment Market Revenue Million Forecast, by Country 2019 & 2032
- Table 78: Mexico Hazardous Area Equipment Market Revenue (Million) Forecast, by Application 2019 & 2032
- Table 79: Brazil Hazardous Area Equipment Market Revenue (Million) Forecast, by Application 2019 & 2032
- Table 80: Global Hazardous Area Equipment Market Revenue Million Forecast, by Equipment 2019 & 2032
- Table 81: Global Hazardous Area Equipment Market Revenue Million Forecast, by End-user Industry 2019 & 2032
- Table 82: Global Hazardous Area Equipment Market Revenue Million Forecast, by Country 2019 & 2032
- Table 83: United Arab Emirates Hazardous Area Equipment Market Revenue (Million) Forecast, by Application 2019 & 2032
- Table 84: Saudi Arabia Hazardous Area Equipment Market Revenue (Million) Forecast, by Application 2019 & 2032
- Table 85: South Africa Hazardous Area Equipment Market Revenue (Million) Forecast, by Application 2019 & 2032
Frequently Asked Questions
1. What is the projected Compound Annual Growth Rate (CAGR) of the Hazardous Area Equipment Market?
The projected CAGR is approximately 6.62%.
2. Which companies are prominent players in the Hazardous Area Equipment Market?
Key companies in the market include R Stahl AG, ABB Ltd, Hangzhou Hikvision Digital Technology Co Ltd*List Not Exhaustive, Adalet Inc (Scott Fetzer Company), Bartec GmbH, Honeywell HBT, Supermec Pte Ltd, Marechal Electric Group, Siemens AG, Eaton Corporation PLC, CZ Electric Co Ltd, G M International Srl, Spina Group SRL, Phoenix Mecano, Warom Technology Inc Co, Rockwell Automation Inc, Cordex Instruments Ltd, Pepperl+Fuchs GmbH, Alloy Industry Co Ltd, Wago GmbH & Co KG.
3. What are the main segments of the Hazardous Area Equipment Market?
The market segments include Equipment, End-user Industry.
4. Can you provide details about the market size?
The market size is estimated to be USD 11.81 Million as of 2022.
5. What are some drivers contributing to market growth?
Stricter Regulations for Handling Hazardous Areas and Substances; Increasing Energy Requirements. Driving the Demand for Exploration of New Mines.
6. What are the notable trends driving market growth?
Oil and Gas End-user Industry Segment is Expected to Hold Significant Market Share.
7. Are there any restraints impacting market growth?
High Investments and High Installation Cost of the Equipment.
8. Can you provide examples of recent developments in the market?
June 2023 - Siemens AG announced an investment of EUR 2 billion (USD 2.11 billion) for new manufacturing capacity and innovation labs, education centers, and other sites. Siemens also announced the construction of a new high-tech factory in Singapore to meet the growing demand from Southeast Asia markets. The company is further expected to announce additional investments in the US and Europe.
9. What pricing options are available for accessing the report?
Pricing options include single-user, multi-user, and enterprise licenses priced at USD 4750, USD 5250, and USD 8750 respectively.
10. Is the market size provided in terms of value or volume?
The market size is provided in terms of value, measured in Million.
11. Are there any specific market keywords associated with the report?
Yes, the market keyword associated with the report is "Hazardous Area Equipment Market," which aids in identifying and referencing the specific market segment covered.
12. How do I determine which pricing option suits my needs best?
The pricing options vary based on user requirements and access needs. Individual users may opt for single-user licenses, while businesses requiring broader access may choose multi-user or enterprise licenses for cost-effective access to the report.
13. Are there any additional resources or data provided in the Hazardous Area Equipment Market report?
While the report offers comprehensive insights, it's advisable to review the specific contents or supplementary materials provided to ascertain if additional resources or data are available.
14. How can I stay updated on further developments or reports in the Hazardous Area Equipment Market?
To stay informed about further developments, trends, and reports in the Hazardous Area Equipment Market, consider subscribing to industry newsletters, following relevant companies and organizations, or regularly checking reputable industry news sources and publications.
Methodology
Step 1 - Identification of Relevant Samples Size from Population Database


Step 2 - Approaches for Defining Global Market Size (Value, Volume* & Price*)

Note*: In applicable scenarios
Step 3 - Data Sources
Primary Research
- Web Analytics
- Survey Reports
- Research Institute
- Latest Research Reports
- Opinion Leaders
Secondary Research
- Annual Reports
- White Paper
- Latest Press Release
- Industry Association
- Paid Database
- Investor Presentations

Step 4 - Data Triangulation
Involves using different sources of information in order to increase the validity of a study
These sources are likely to be stakeholders in a program - participants, other researchers, program staff, other community members, and so on.
Then we put all data in single framework & apply various statistical tools to find out the dynamic on the market.
During the analysis stage, feedback from the stakeholder groups would be compared to determine areas of agreement as well as areas of divergence


