
Key Insights
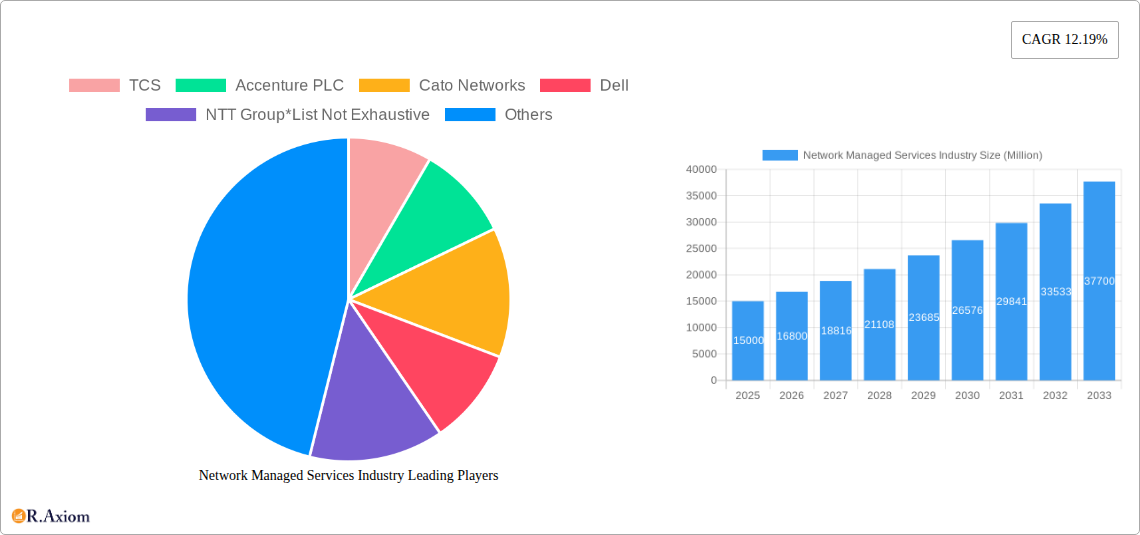
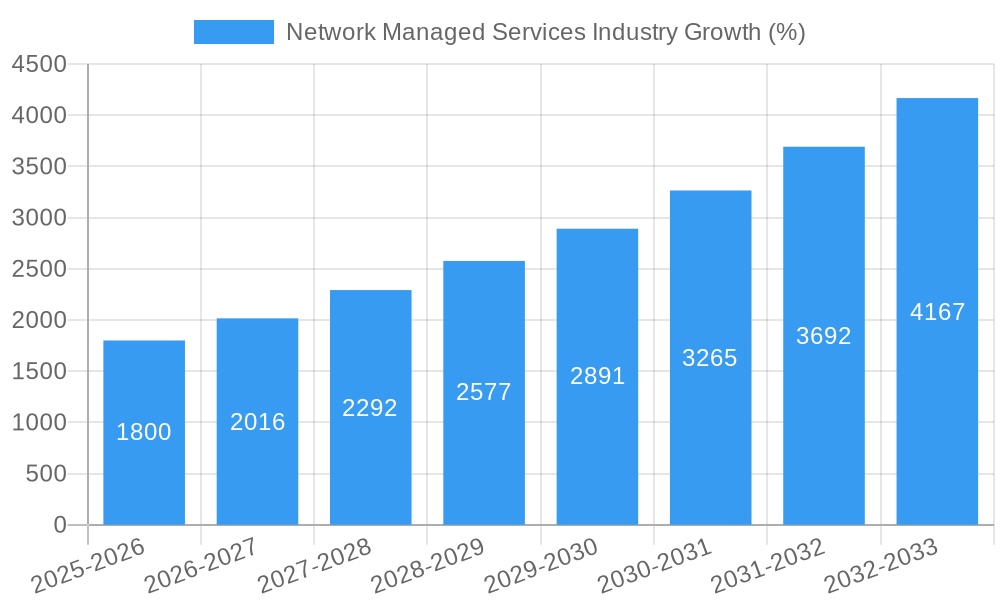
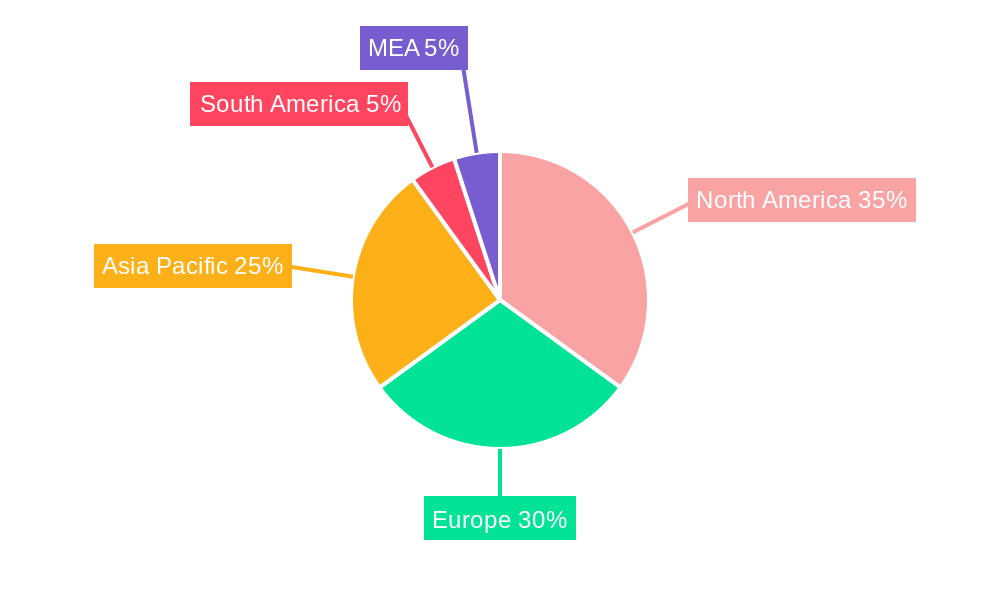
The Network Managed Services (NMS) market is experiencing robust growth, projected to reach a substantial size by 2033. A CAGR of 12.19% from 2019 to 2025 indicates significant market expansion driven by several key factors. The increasing adoption of cloud computing, the growing need for enhanced cybersecurity, and the rising demand for improved network efficiency across various sectors are major contributors to this growth. The BFSI, IT and Telecom, and Healthcare and Pharmaceutical sectors are leading adopters, driving demand for managed LAN, WAN, Wi-Fi, and network security services. Large enterprises currently dominate the market share, but the SME segment is exhibiting rapid growth fueled by the affordability and scalability of managed services. The market's geographic distribution shows a strong presence in North America and Europe, but the Asia-Pacific region is poised for significant expansion driven by rapid digitalization and infrastructure development in countries like India and China. Competition is fierce among established players like TCS, Accenture, Dell, and NTT, alongside specialized providers like Cato Networks. However, the market is also witnessing the emergence of smaller, agile companies offering niche solutions and specialized services. This competitive landscape fosters innovation and drives down prices, ultimately benefitting end-users.
The continued growth of the NMS market is expected to be influenced by several factors. The increasing prevalence of hybrid work models necessitates robust and secure network management capabilities. The integration of advanced technologies like AI and machine learning into NMS solutions promises to enhance network performance and security further. Regulatory compliance requirements, particularly in data privacy and security, will continue to drive demand for professional network management services. However, potential restraints include the complexity of integrating legacy systems with new managed services and the potential for vendor lock-in. Overcoming these challenges will be crucial for sustained market growth. The ongoing evolution of network technologies, particularly in 5G and edge computing, will necessitate continuous adaptation and innovation within the NMS industry. Companies that can effectively leverage these technological advancements and adapt to changing customer needs are expected to thrive in this dynamic market. The forecast period of 2025-2033 promises further expansion, with the Asia-Pacific region and the SME segment expected to be key growth drivers.
Network Managed Services Industry: A Comprehensive Market Report (2019-2033)
This in-depth report provides a comprehensive analysis of the Network Managed Services industry, offering valuable insights into market dynamics, growth drivers, competitive landscape, and future trends. The report covers the period 2019-2033, with a focus on the estimated year 2025. Key players such as TCS, Accenture PLC, Cato Networks, Dell, NTT Group, Wipro, Verizon, HCL Technologies Limited, IBM, and Lumen Technologies are analyzed, along with key market segments. The report is essential for industry stakeholders, investors, and businesses seeking to understand and capitalize on opportunities within this rapidly evolving market. The total market size is predicted to reach xx Million by 2033.
Network Managed Services Industry Market Concentration & Innovation
The Network Managed Services market exhibits a moderately concentrated landscape, with a few large players holding significant market share. TCS, Accenture PLC, and other global IT giants command substantial portions, while smaller, specialized providers focus on niche segments. Market share data for 2024 suggests that the top 5 players account for approximately xx% of the overall market revenue, with TCS holding the largest share at approximately xx%. Innovation is driven by advancements in cloud computing, 5G technology, and the increasing adoption of Software-Defined Networking (SDN) and Network Function Virtualization (NFV). Regulatory frameworks, such as data privacy regulations (GDPR, CCPA), influence service offerings and security protocols. Product substitutes, such as in-house network management, are limited due to the expertise and specialized infrastructure required. End-user trends lean towards outsourcing network management to reduce operational costs and gain access to advanced technologies. M&A activity is moderate, with deal values averaging xx Million in recent years, driven primarily by the consolidation of smaller players by larger companies seeking expansion or specialized capabilities.
- Key Metrics:
- Top 5 players market share: xx% (2024)
- Average M&A deal value: xx Million (2022-2024)
- Number of M&A deals: xx (2022-2024)
Network Managed Services Industry Industry Trends & Insights
The Network Managed Services market is experiencing robust growth, driven by several key factors. The increasing adoption of cloud-based applications and services necessitates robust and secure network connectivity, fueling demand for managed services. The shift towards hybrid and multi-cloud environments further intensifies this demand. Technological disruptions, such as the widespread adoption of 5G and the rise of edge computing, create new opportunities for managed service providers. Consumer preferences are shifting towards flexible, scalable, and cost-effective solutions, which are readily offered by managed service providers. Competitive dynamics are intense, with larger players investing heavily in R&D and strategic partnerships to maintain their market positions. The Compound Annual Growth Rate (CAGR) for the Network Managed Services market is projected to be xx% during the forecast period (2025-2033), indicating significant market expansion. Market penetration is currently at xx% and is expected to reach xx% by 2033.
Dominant Markets & Segments in Network Managed Services Industry
The North American region currently dominates the Network Managed Services market, driven by high technological adoption, robust IT infrastructure, and a strong presence of large enterprises. Within segments:
By Organization Size: Large enterprises represent the largest segment, driven by their extensive network infrastructure and greater need for sophisticated managed services. SMEs are a rapidly growing segment, seeking cost-effective solutions to manage their networks.
By End User: The BFSI sector is a leading segment, owing to its stringent security and regulatory requirements. The IT and Telecom sector also constitutes a significant segment due to its high reliance on network infrastructure. Other key segments include Healthcare, Retail, and Manufacturing, each with specific networking needs.
By Type: Managed WAN services are the largest segment, followed by Managed LAN and Managed Network Security. The demand for Managed Wi-Fi services is also increasing due to the expanding use of mobile devices and IoT.
Key Drivers: Strong economic conditions, supportive government policies promoting digital transformation, and significant investments in IT infrastructure are driving market growth across all segments.
Network Managed Services Industry Product Developments
Recent product innovations focus on enhancing security, scalability, and automation. The integration of AI and machine learning into network management platforms is improving efficiency and reducing operational costs. The rise of 5G is enabling new applications such as private 5G networks for enterprises. These advancements provide competitive advantages by offering superior performance, increased reliability, and improved security. The market fit is strong for solutions that address the growing needs for secure, agile, and cost-effective network management in diverse industry verticals.
Report Scope & Segmentation Analysis
This report comprehensively analyzes the Network Managed Services market across various segments.
By Organization Size: SMEs and Large Enterprises are examined separately, considering their distinct needs and spending patterns. Growth projections indicate faster growth in the SME segment.
By End User: BFSI, IT & Telecom, Healthcare & Pharmaceutical, Retail, Manufacturing, Education, and Others are analyzed, detailing specific requirements and market opportunities for each. Market sizes are projected for each segment, reflecting varying growth rates.
By Type: Managed LAN, Managed WAN, Managed Wi-Fi, Managed Network Security, and Other Services are examined individually, analyzing their respective market sizes and competitive dynamics. Competitive intensity varies depending on the specific service type.
Key Drivers of Network Managed Services Industry Growth
Several factors fuel the growth of the Network Managed Services industry:
Technological Advancements: 5G, SDN, NFV, AI, and cloud computing are driving the demand for sophisticated network management solutions.
Economic Growth: Increased business investments in IT infrastructure are boosting demand for outsourced network management services.
Regulatory Compliance: Stringent data privacy regulations and cybersecurity mandates drive demand for secure managed network solutions.
Challenges in the Network Managed Services Industry Sector
The industry faces several challenges:
Cybersecurity Threats: Increasing cyberattacks pose significant security risks, demanding robust security solutions. This increases costs for service providers and can lead to lost revenue if security breaches occur.
Competition: Intense competition among established players and emerging providers puts pressure on pricing and margins. This requires continuous innovation and differentiation strategies.
Talent Acquisition: A shortage of skilled professionals in network management hinders industry growth. This constraint can lead to higher labor costs and difficulties in scaling operations.
Emerging Opportunities in Network Managed Services Industry
Significant opportunities exist in the following areas:
5G Network Management: The rollout of 5G presents opportunities for managing complex 5G networks.
Edge Computing: Managing edge networks for IoT deployments is an emerging area.
AI-powered Network Automation: Developing and deploying AI-driven solutions for network automation improves efficiency and reduces costs.
Leading Players in the Network Managed Services Industry Market
- TCS
- Accenture PLC
- Cato Networks
- Dell
- NTT Group
- Wipro
- Verizon
- HCL Technologies Limited
- IBM
- Lumen Technologies
Key Developments in Network Managed Services Industry Industry
June 2023: Wipro launched a managed private 5G-as-a-service solution in partnership with Cisco, expanding its portfolio and targeting enterprise customers seeking advanced network capabilities.
May 2023: Cloudflare Inc. partnered with Kyndryl Holdings Inc., strengthening the managed WAN-as-a-Service market and enabling seamless multi-cloud connectivity for enterprises.
Strategic Outlook for Network Managed Services Industry Market
The Network Managed Services market is poised for sustained growth, driven by digital transformation, cloud adoption, and the increasing complexity of enterprise networks. The adoption of innovative technologies such as 5G, edge computing, and AI will further drive demand for sophisticated managed services. Companies that successfully adapt to evolving technological landscapes and prioritize cybersecurity will be well-positioned for success in this dynamic market. Strategic partnerships and mergers & acquisitions will continue to shape the competitive landscape.
Network Managed Services Industry Segmentation
-
1. Type
- 1.1. Managed LAN
- 1.2. Managed WAN
- 1.3. Managed Wi-Fi
- 1.4. Managed Network Security
- 1.5. Other Services
-
2. Organization Size
- 2.1. Small and Medium Enterprises (SMEs)
- 2.2. Large Enterprises
-
3. End User
- 3.1. BFSI
- 3.2. IT and Telecom
- 3.3. Healthcare and Pharmaceutical
- 3.4. Retail
- 3.5. Manufacturing
- 3.6. Education
- 3.7. Others (Utilities, Media, Etc.)
Network Managed Services Industry Segmentation By Geography
- 1. North America
- 2. Europe
- 3. Asia Pacific
- 4. Middle East and Africa
- 5. Latin America
Network Managed Services Industry REPORT HIGHLIGHTS
| Aspects | Details |
|---|---|
| Study Period | 2019-2033 |
| Base Year | 2024 |
| Estimated Year | 2025 |
| Forecast Period | 2025-2033 |
| Historical Period | 2019-2024 |
| Growth Rate | CAGR of 12.19% from 2019-2033 |
| Segmentation |
|
Table of Contents
- 1. Introduction
- 1.1. Research Scope
- 1.2. Market Segmentation
- 1.3. Research Methodology
- 1.4. Definitions and Assumptions
- 2. Executive Summary
- 2.1. Introduction
- 3. Market Dynamics
- 3.1. Introduction
- 3.2. Market Drivers
- 3.2.1. Lack of in-house Expertise; Benefit of Extensive Focus on Core Operations; Cost Benefits and ROI Achieved through Managed Services
- 3.3. Market Restrains
- 3.3.1. Reluctance Among Medical Professionals to Adopt Advanced Healthcare Tools
- 3.4. Market Trends
- 3.4.1. IT and Telecom Sector to be the Largest End User
- 4. Market Factor Analysis
- 4.1. Porters Five Forces
- 4.2. Supply/Value Chain
- 4.3. PESTEL analysis
- 4.4. Market Entropy
- 4.5. Patent/Trademark Analysis
- 5. Global Network Managed Services Industry Analysis, Insights and Forecast, 2019-2031
- 5.1. Market Analysis, Insights and Forecast - by Type
- 5.1.1. Managed LAN
- 5.1.2. Managed WAN
- 5.1.3. Managed Wi-Fi
- 5.1.4. Managed Network Security
- 5.1.5. Other Services
- 5.2. Market Analysis, Insights and Forecast - by Organization Size
- 5.2.1. Small and Medium Enterprises (SMEs)
- 5.2.2. Large Enterprises
- 5.3. Market Analysis, Insights and Forecast - by End User
- 5.3.1. BFSI
- 5.3.2. IT and Telecom
- 5.3.3. Healthcare and Pharmaceutical
- 5.3.4. Retail
- 5.3.5. Manufacturing
- 5.3.6. Education
- 5.3.7. Others (Utilities, Media, Etc.)
- 5.4. Market Analysis, Insights and Forecast - by Region
- 5.4.1. North America
- 5.4.2. Europe
- 5.4.3. Asia Pacific
- 5.4.4. Middle East and Africa
- 5.4.5. Latin America
- 5.1. Market Analysis, Insights and Forecast - by Type
- 6. North America Network Managed Services Industry Analysis, Insights and Forecast, 2019-2031
- 6.1. Market Analysis, Insights and Forecast - by Type
- 6.1.1. Managed LAN
- 6.1.2. Managed WAN
- 6.1.3. Managed Wi-Fi
- 6.1.4. Managed Network Security
- 6.1.5. Other Services
- 6.2. Market Analysis, Insights and Forecast - by Organization Size
- 6.2.1. Small and Medium Enterprises (SMEs)
- 6.2.2. Large Enterprises
- 6.3. Market Analysis, Insights and Forecast - by End User
- 6.3.1. BFSI
- 6.3.2. IT and Telecom
- 6.3.3. Healthcare and Pharmaceutical
- 6.3.4. Retail
- 6.3.5. Manufacturing
- 6.3.6. Education
- 6.3.7. Others (Utilities, Media, Etc.)
- 6.1. Market Analysis, Insights and Forecast - by Type
- 7. Europe Network Managed Services Industry Analysis, Insights and Forecast, 2019-2031
- 7.1. Market Analysis, Insights and Forecast - by Type
- 7.1.1. Managed LAN
- 7.1.2. Managed WAN
- 7.1.3. Managed Wi-Fi
- 7.1.4. Managed Network Security
- 7.1.5. Other Services
- 7.2. Market Analysis, Insights and Forecast - by Organization Size
- 7.2.1. Small and Medium Enterprises (SMEs)
- 7.2.2. Large Enterprises
- 7.3. Market Analysis, Insights and Forecast - by End User
- 7.3.1. BFSI
- 7.3.2. IT and Telecom
- 7.3.3. Healthcare and Pharmaceutical
- 7.3.4. Retail
- 7.3.5. Manufacturing
- 7.3.6. Education
- 7.3.7. Others (Utilities, Media, Etc.)
- 7.1. Market Analysis, Insights and Forecast - by Type
- 8. Asia Pacific Network Managed Services Industry Analysis, Insights and Forecast, 2019-2031
- 8.1. Market Analysis, Insights and Forecast - by Type
- 8.1.1. Managed LAN
- 8.1.2. Managed WAN
- 8.1.3. Managed Wi-Fi
- 8.1.4. Managed Network Security
- 8.1.5. Other Services
- 8.2. Market Analysis, Insights and Forecast - by Organization Size
- 8.2.1. Small and Medium Enterprises (SMEs)
- 8.2.2. Large Enterprises
- 8.3. Market Analysis, Insights and Forecast - by End User
- 8.3.1. BFSI
- 8.3.2. IT and Telecom
- 8.3.3. Healthcare and Pharmaceutical
- 8.3.4. Retail
- 8.3.5. Manufacturing
- 8.3.6. Education
- 8.3.7. Others (Utilities, Media, Etc.)
- 8.1. Market Analysis, Insights and Forecast - by Type
- 9. Middle East and Africa Network Managed Services Industry Analysis, Insights and Forecast, 2019-2031
- 9.1. Market Analysis, Insights and Forecast - by Type
- 9.1.1. Managed LAN
- 9.1.2. Managed WAN
- 9.1.3. Managed Wi-Fi
- 9.1.4. Managed Network Security
- 9.1.5. Other Services
- 9.2. Market Analysis, Insights and Forecast - by Organization Size
- 9.2.1. Small and Medium Enterprises (SMEs)
- 9.2.2. Large Enterprises
- 9.3. Market Analysis, Insights and Forecast - by End User
- 9.3.1. BFSI
- 9.3.2. IT and Telecom
- 9.3.3. Healthcare and Pharmaceutical
- 9.3.4. Retail
- 9.3.5. Manufacturing
- 9.3.6. Education
- 9.3.7. Others (Utilities, Media, Etc.)
- 9.1. Market Analysis, Insights and Forecast - by Type
- 10. Latin America Network Managed Services Industry Analysis, Insights and Forecast, 2019-2031
- 10.1. Market Analysis, Insights and Forecast - by Type
- 10.1.1. Managed LAN
- 10.1.2. Managed WAN
- 10.1.3. Managed Wi-Fi
- 10.1.4. Managed Network Security
- 10.1.5. Other Services
- 10.2. Market Analysis, Insights and Forecast - by Organization Size
- 10.2.1. Small and Medium Enterprises (SMEs)
- 10.2.2. Large Enterprises
- 10.3. Market Analysis, Insights and Forecast - by End User
- 10.3.1. BFSI
- 10.3.2. IT and Telecom
- 10.3.3. Healthcare and Pharmaceutical
- 10.3.4. Retail
- 10.3.5. Manufacturing
- 10.3.6. Education
- 10.3.7. Others (Utilities, Media, Etc.)
- 10.1. Market Analysis, Insights and Forecast - by Type
- 11. North America Network Managed Services Industry Analysis, Insights and Forecast, 2019-2031
- 11.1. Market Analysis, Insights and Forecast - By Country/Sub-region
- 11.1.1 United States
- 11.1.2 Canada
- 11.1.3 Mexico
- 12. Europe Network Managed Services Industry Analysis, Insights and Forecast, 2019-2031
- 12.1. Market Analysis, Insights and Forecast - By Country/Sub-region
- 12.1.1 Germany
- 12.1.2 United Kingdom
- 12.1.3 France
- 12.1.4 Spain
- 12.1.5 Italy
- 12.1.6 Spain
- 12.1.7 Belgium
- 12.1.8 Netherland
- 12.1.9 Nordics
- 12.1.10 Rest of Europe
- 13. Asia Pacific Network Managed Services Industry Analysis, Insights and Forecast, 2019-2031
- 13.1. Market Analysis, Insights and Forecast - By Country/Sub-region
- 13.1.1 China
- 13.1.2 Japan
- 13.1.3 India
- 13.1.4 South Korea
- 13.1.5 Southeast Asia
- 13.1.6 Australia
- 13.1.7 Indonesia
- 13.1.8 Phillipes
- 13.1.9 Singapore
- 13.1.10 Thailandc
- 13.1.11 Rest of Asia Pacific
- 14. South America Network Managed Services Industry Analysis, Insights and Forecast, 2019-2031
- 14.1. Market Analysis, Insights and Forecast - By Country/Sub-region
- 14.1.1 Brazil
- 14.1.2 Argentina
- 14.1.3 Peru
- 14.1.4 Chile
- 14.1.5 Colombia
- 14.1.6 Ecuador
- 14.1.7 Venezuela
- 14.1.8 Rest of South America
- 15. North America Network Managed Services Industry Analysis, Insights and Forecast, 2019-2031
- 15.1. Market Analysis, Insights and Forecast - By Country/Sub-region
- 15.1.1 United States
- 15.1.2 Canada
- 15.1.3 Mexico
- 16. MEA Network Managed Services Industry Analysis, Insights and Forecast, 2019-2031
- 16.1. Market Analysis, Insights and Forecast - By Country/Sub-region
- 16.1.1 United Arab Emirates
- 16.1.2 Saudi Arabia
- 16.1.3 South Africa
- 16.1.4 Rest of Middle East and Africa
- 17. Competitive Analysis
- 17.1. Global Market Share Analysis 2024
- 17.2. Company Profiles
- 17.2.1 TCS
- 17.2.1.1. Overview
- 17.2.1.2. Products
- 17.2.1.3. SWOT Analysis
- 17.2.1.4. Recent Developments
- 17.2.1.5. Financials (Based on Availability)
- 17.2.2 Accenture PLC
- 17.2.2.1. Overview
- 17.2.2.2. Products
- 17.2.2.3. SWOT Analysis
- 17.2.2.4. Recent Developments
- 17.2.2.5. Financials (Based on Availability)
- 17.2.3 Cato Networks
- 17.2.3.1. Overview
- 17.2.3.2. Products
- 17.2.3.3. SWOT Analysis
- 17.2.3.4. Recent Developments
- 17.2.3.5. Financials (Based on Availability)
- 17.2.4 Dell
- 17.2.4.1. Overview
- 17.2.4.2. Products
- 17.2.4.3. SWOT Analysis
- 17.2.4.4. Recent Developments
- 17.2.4.5. Financials (Based on Availability)
- 17.2.5 NTT Group*List Not Exhaustive
- 17.2.5.1. Overview
- 17.2.5.2. Products
- 17.2.5.3. SWOT Analysis
- 17.2.5.4. Recent Developments
- 17.2.5.5. Financials (Based on Availability)
- 17.2.6 Wipro
- 17.2.6.1. Overview
- 17.2.6.2. Products
- 17.2.6.3. SWOT Analysis
- 17.2.6.4. Recent Developments
- 17.2.6.5. Financials (Based on Availability)
- 17.2.7 Verizon
- 17.2.7.1. Overview
- 17.2.7.2. Products
- 17.2.7.3. SWOT Analysis
- 17.2.7.4. Recent Developments
- 17.2.7.5. Financials (Based on Availability)
- 17.2.8 HCL Technologies Limited
- 17.2.8.1. Overview
- 17.2.8.2. Products
- 17.2.8.3. SWOT Analysis
- 17.2.8.4. Recent Developments
- 17.2.8.5. Financials (Based on Availability)
- 17.2.9 IBM
- 17.2.9.1. Overview
- 17.2.9.2. Products
- 17.2.9.3. SWOT Analysis
- 17.2.9.4. Recent Developments
- 17.2.9.5. Financials (Based on Availability)
- 17.2.10 Lumen Technologies
- 17.2.10.1. Overview
- 17.2.10.2. Products
- 17.2.10.3. SWOT Analysis
- 17.2.10.4. Recent Developments
- 17.2.10.5. Financials (Based on Availability)
- 17.2.1 TCS
List of Figures
- Figure 1: Global Network Managed Services Industry Revenue Breakdown (Million, %) by Region 2024 & 2032
- Figure 2: North America Network Managed Services Industry Revenue (Million), by Country 2024 & 2032
- Figure 3: North America Network Managed Services Industry Revenue Share (%), by Country 2024 & 2032
- Figure 4: Europe Network Managed Services Industry Revenue (Million), by Country 2024 & 2032
- Figure 5: Europe Network Managed Services Industry Revenue Share (%), by Country 2024 & 2032
- Figure 6: Asia Pacific Network Managed Services Industry Revenue (Million), by Country 2024 & 2032
- Figure 7: Asia Pacific Network Managed Services Industry Revenue Share (%), by Country 2024 & 2032
- Figure 8: South America Network Managed Services Industry Revenue (Million), by Country 2024 & 2032
- Figure 9: South America Network Managed Services Industry Revenue Share (%), by Country 2024 & 2032
- Figure 10: North America Network Managed Services Industry Revenue (Million), by Country 2024 & 2032
- Figure 11: North America Network Managed Services Industry Revenue Share (%), by Country 2024 & 2032
- Figure 12: MEA Network Managed Services Industry Revenue (Million), by Country 2024 & 2032
- Figure 13: MEA Network Managed Services Industry Revenue Share (%), by Country 2024 & 2032
- Figure 14: North America Network Managed Services Industry Revenue (Million), by Type 2024 & 2032
- Figure 15: North America Network Managed Services Industry Revenue Share (%), by Type 2024 & 2032
- Figure 16: North America Network Managed Services Industry Revenue (Million), by Organization Size 2024 & 2032
- Figure 17: North America Network Managed Services Industry Revenue Share (%), by Organization Size 2024 & 2032
- Figure 18: North America Network Managed Services Industry Revenue (Million), by End User 2024 & 2032
- Figure 19: North America Network Managed Services Industry Revenue Share (%), by End User 2024 & 2032
- Figure 20: North America Network Managed Services Industry Revenue (Million), by Country 2024 & 2032
- Figure 21: North America Network Managed Services Industry Revenue Share (%), by Country 2024 & 2032
- Figure 22: Europe Network Managed Services Industry Revenue (Million), by Type 2024 & 2032
- Figure 23: Europe Network Managed Services Industry Revenue Share (%), by Type 2024 & 2032
- Figure 24: Europe Network Managed Services Industry Revenue (Million), by Organization Size 2024 & 2032
- Figure 25: Europe Network Managed Services Industry Revenue Share (%), by Organization Size 2024 & 2032
- Figure 26: Europe Network Managed Services Industry Revenue (Million), by End User 2024 & 2032
- Figure 27: Europe Network Managed Services Industry Revenue Share (%), by End User 2024 & 2032
- Figure 28: Europe Network Managed Services Industry Revenue (Million), by Country 2024 & 2032
- Figure 29: Europe Network Managed Services Industry Revenue Share (%), by Country 2024 & 2032
- Figure 30: Asia Pacific Network Managed Services Industry Revenue (Million), by Type 2024 & 2032
- Figure 31: Asia Pacific Network Managed Services Industry Revenue Share (%), by Type 2024 & 2032
- Figure 32: Asia Pacific Network Managed Services Industry Revenue (Million), by Organization Size 2024 & 2032
- Figure 33: Asia Pacific Network Managed Services Industry Revenue Share (%), by Organization Size 2024 & 2032
- Figure 34: Asia Pacific Network Managed Services Industry Revenue (Million), by End User 2024 & 2032
- Figure 35: Asia Pacific Network Managed Services Industry Revenue Share (%), by End User 2024 & 2032
- Figure 36: Asia Pacific Network Managed Services Industry Revenue (Million), by Country 2024 & 2032
- Figure 37: Asia Pacific Network Managed Services Industry Revenue Share (%), by Country 2024 & 2032
- Figure 38: Middle East and Africa Network Managed Services Industry Revenue (Million), by Type 2024 & 2032
- Figure 39: Middle East and Africa Network Managed Services Industry Revenue Share (%), by Type 2024 & 2032
- Figure 40: Middle East and Africa Network Managed Services Industry Revenue (Million), by Organization Size 2024 & 2032
- Figure 41: Middle East and Africa Network Managed Services Industry Revenue Share (%), by Organization Size 2024 & 2032
- Figure 42: Middle East and Africa Network Managed Services Industry Revenue (Million), by End User 2024 & 2032
- Figure 43: Middle East and Africa Network Managed Services Industry Revenue Share (%), by End User 2024 & 2032
- Figure 44: Middle East and Africa Network Managed Services Industry Revenue (Million), by Country 2024 & 2032
- Figure 45: Middle East and Africa Network Managed Services Industry Revenue Share (%), by Country 2024 & 2032
- Figure 46: Latin America Network Managed Services Industry Revenue (Million), by Type 2024 & 2032
- Figure 47: Latin America Network Managed Services Industry Revenue Share (%), by Type 2024 & 2032
- Figure 48: Latin America Network Managed Services Industry Revenue (Million), by Organization Size 2024 & 2032
- Figure 49: Latin America Network Managed Services Industry Revenue Share (%), by Organization Size 2024 & 2032
- Figure 50: Latin America Network Managed Services Industry Revenue (Million), by End User 2024 & 2032
- Figure 51: Latin America Network Managed Services Industry Revenue Share (%), by End User 2024 & 2032
- Figure 52: Latin America Network Managed Services Industry Revenue (Million), by Country 2024 & 2032
- Figure 53: Latin America Network Managed Services Industry Revenue Share (%), by Country 2024 & 2032
List of Tables
- Table 1: Global Network Managed Services Industry Revenue Million Forecast, by Region 2019 & 2032
- Table 2: Global Network Managed Services Industry Revenue Million Forecast, by Type 2019 & 2032
- Table 3: Global Network Managed Services Industry Revenue Million Forecast, by Organization Size 2019 & 2032
- Table 4: Global Network Managed Services Industry Revenue Million Forecast, by End User 2019 & 2032
- Table 5: Global Network Managed Services Industry Revenue Million Forecast, by Region 2019 & 2032
- Table 6: Global Network Managed Services Industry Revenue Million Forecast, by Country 2019 & 2032
- Table 7: United States Network Managed Services Industry Revenue (Million) Forecast, by Application 2019 & 2032
- Table 8: Canada Network Managed Services Industry Revenue (Million) Forecast, by Application 2019 & 2032
- Table 9: Mexico Network Managed Services Industry Revenue (Million) Forecast, by Application 2019 & 2032
- Table 10: Global Network Managed Services Industry Revenue Million Forecast, by Country 2019 & 2032
- Table 11: Germany Network Managed Services Industry Revenue (Million) Forecast, by Application 2019 & 2032
- Table 12: United Kingdom Network Managed Services Industry Revenue (Million) Forecast, by Application 2019 & 2032
- Table 13: France Network Managed Services Industry Revenue (Million) Forecast, by Application 2019 & 2032
- Table 14: Spain Network Managed Services Industry Revenue (Million) Forecast, by Application 2019 & 2032
- Table 15: Italy Network Managed Services Industry Revenue (Million) Forecast, by Application 2019 & 2032
- Table 16: Spain Network Managed Services Industry Revenue (Million) Forecast, by Application 2019 & 2032
- Table 17: Belgium Network Managed Services Industry Revenue (Million) Forecast, by Application 2019 & 2032
- Table 18: Netherland Network Managed Services Industry Revenue (Million) Forecast, by Application 2019 & 2032
- Table 19: Nordics Network Managed Services Industry Revenue (Million) Forecast, by Application 2019 & 2032
- Table 20: Rest of Europe Network Managed Services Industry Revenue (Million) Forecast, by Application 2019 & 2032
- Table 21: Global Network Managed Services Industry Revenue Million Forecast, by Country 2019 & 2032
- Table 22: China Network Managed Services Industry Revenue (Million) Forecast, by Application 2019 & 2032
- Table 23: Japan Network Managed Services Industry Revenue (Million) Forecast, by Application 2019 & 2032
- Table 24: India Network Managed Services Industry Revenue (Million) Forecast, by Application 2019 & 2032
- Table 25: South Korea Network Managed Services Industry Revenue (Million) Forecast, by Application 2019 & 2032
- Table 26: Southeast Asia Network Managed Services Industry Revenue (Million) Forecast, by Application 2019 & 2032
- Table 27: Australia Network Managed Services Industry Revenue (Million) Forecast, by Application 2019 & 2032
- Table 28: Indonesia Network Managed Services Industry Revenue (Million) Forecast, by Application 2019 & 2032
- Table 29: Phillipes Network Managed Services Industry Revenue (Million) Forecast, by Application 2019 & 2032
- Table 30: Singapore Network Managed Services Industry Revenue (Million) Forecast, by Application 2019 & 2032
- Table 31: Thailandc Network Managed Services Industry Revenue (Million) Forecast, by Application 2019 & 2032
- Table 32: Rest of Asia Pacific Network Managed Services Industry Revenue (Million) Forecast, by Application 2019 & 2032
- Table 33: Global Network Managed Services Industry Revenue Million Forecast, by Country 2019 & 2032
- Table 34: Brazil Network Managed Services Industry Revenue (Million) Forecast, by Application 2019 & 2032
- Table 35: Argentina Network Managed Services Industry Revenue (Million) Forecast, by Application 2019 & 2032
- Table 36: Peru Network Managed Services Industry Revenue (Million) Forecast, by Application 2019 & 2032
- Table 37: Chile Network Managed Services Industry Revenue (Million) Forecast, by Application 2019 & 2032
- Table 38: Colombia Network Managed Services Industry Revenue (Million) Forecast, by Application 2019 & 2032
- Table 39: Ecuador Network Managed Services Industry Revenue (Million) Forecast, by Application 2019 & 2032
- Table 40: Venezuela Network Managed Services Industry Revenue (Million) Forecast, by Application 2019 & 2032
- Table 41: Rest of South America Network Managed Services Industry Revenue (Million) Forecast, by Application 2019 & 2032
- Table 42: Global Network Managed Services Industry Revenue Million Forecast, by Country 2019 & 2032
- Table 43: United States Network Managed Services Industry Revenue (Million) Forecast, by Application 2019 & 2032
- Table 44: Canada Network Managed Services Industry Revenue (Million) Forecast, by Application 2019 & 2032
- Table 45: Mexico Network Managed Services Industry Revenue (Million) Forecast, by Application 2019 & 2032
- Table 46: Global Network Managed Services Industry Revenue Million Forecast, by Country 2019 & 2032
- Table 47: United Arab Emirates Network Managed Services Industry Revenue (Million) Forecast, by Application 2019 & 2032
- Table 48: Saudi Arabia Network Managed Services Industry Revenue (Million) Forecast, by Application 2019 & 2032
- Table 49: South Africa Network Managed Services Industry Revenue (Million) Forecast, by Application 2019 & 2032
- Table 50: Rest of Middle East and Africa Network Managed Services Industry Revenue (Million) Forecast, by Application 2019 & 2032
- Table 51: Global Network Managed Services Industry Revenue Million Forecast, by Type 2019 & 2032
- Table 52: Global Network Managed Services Industry Revenue Million Forecast, by Organization Size 2019 & 2032
- Table 53: Global Network Managed Services Industry Revenue Million Forecast, by End User 2019 & 2032
- Table 54: Global Network Managed Services Industry Revenue Million Forecast, by Country 2019 & 2032
- Table 55: Global Network Managed Services Industry Revenue Million Forecast, by Type 2019 & 2032
- Table 56: Global Network Managed Services Industry Revenue Million Forecast, by Organization Size 2019 & 2032
- Table 57: Global Network Managed Services Industry Revenue Million Forecast, by End User 2019 & 2032
- Table 58: Global Network Managed Services Industry Revenue Million Forecast, by Country 2019 & 2032
- Table 59: Global Network Managed Services Industry Revenue Million Forecast, by Type 2019 & 2032
- Table 60: Global Network Managed Services Industry Revenue Million Forecast, by Organization Size 2019 & 2032
- Table 61: Global Network Managed Services Industry Revenue Million Forecast, by End User 2019 & 2032
- Table 62: Global Network Managed Services Industry Revenue Million Forecast, by Country 2019 & 2032
- Table 63: Global Network Managed Services Industry Revenue Million Forecast, by Type 2019 & 2032
- Table 64: Global Network Managed Services Industry Revenue Million Forecast, by Organization Size 2019 & 2032
- Table 65: Global Network Managed Services Industry Revenue Million Forecast, by End User 2019 & 2032
- Table 66: Global Network Managed Services Industry Revenue Million Forecast, by Country 2019 & 2032
- Table 67: Global Network Managed Services Industry Revenue Million Forecast, by Type 2019 & 2032
- Table 68: Global Network Managed Services Industry Revenue Million Forecast, by Organization Size 2019 & 2032
- Table 69: Global Network Managed Services Industry Revenue Million Forecast, by End User 2019 & 2032
- Table 70: Global Network Managed Services Industry Revenue Million Forecast, by Country 2019 & 2032
Frequently Asked Questions
1. What is the projected Compound Annual Growth Rate (CAGR) of the Network Managed Services Industry?
The projected CAGR is approximately 12.19%.
2. Which companies are prominent players in the Network Managed Services Industry?
Key companies in the market include TCS, Accenture PLC, Cato Networks, Dell, NTT Group*List Not Exhaustive, Wipro, Verizon, HCL Technologies Limited, IBM, Lumen Technologies.
3. What are the main segments of the Network Managed Services Industry?
The market segments include Type, Organization Size, End User.
4. Can you provide details about the market size?
The market size is estimated to be USD XX Million as of 2022.
5. What are some drivers contributing to market growth?
Lack of in-house Expertise; Benefit of Extensive Focus on Core Operations; Cost Benefits and ROI Achieved through Managed Services.
6. What are the notable trends driving market growth?
IT and Telecom Sector to be the Largest End User.
7. Are there any restraints impacting market growth?
Reluctance Among Medical Professionals to Adopt Advanced Healthcare Tools.
8. Can you provide examples of recent developments in the market?
June 2023: Wipro launched a managed private 5G-as-a-service solution in partnership with Cisco. Wipro said that the new offering enables enterprise customers to achieve better business outcomes via the integration of private 5G with their existing LAN/WAN/Cloud infrastructure.
9. What pricing options are available for accessing the report?
Pricing options include single-user, multi-user, and enterprise licenses priced at USD 4750, USD 5250, and USD 8750 respectively.
10. Is the market size provided in terms of value or volume?
The market size is provided in terms of value, measured in Million.
11. Are there any specific market keywords associated with the report?
Yes, the market keyword associated with the report is "Network Managed Services Industry," which aids in identifying and referencing the specific market segment covered.
12. How do I determine which pricing option suits my needs best?
The pricing options vary based on user requirements and access needs. Individual users may opt for single-user licenses, while businesses requiring broader access may choose multi-user or enterprise licenses for cost-effective access to the report.
13. Are there any additional resources or data provided in the Network Managed Services Industry report?
While the report offers comprehensive insights, it's advisable to review the specific contents or supplementary materials provided to ascertain if additional resources or data are available.
14. How can I stay updated on further developments or reports in the Network Managed Services Industry?
To stay informed about further developments, trends, and reports in the Network Managed Services Industry, consider subscribing to industry newsletters, following relevant companies and organizations, or regularly checking reputable industry news sources and publications.
Methodology
Step 1 - Identification of Relevant Samples Size from Population Database


Step 2 - Approaches for Defining Global Market Size (Value, Volume* & Price*)

Note*: In applicable scenarios
Step 3 - Data Sources
Primary Research
- Web Analytics
- Survey Reports
- Research Institute
- Latest Research Reports
- Opinion Leaders
Secondary Research
- Annual Reports
- White Paper
- Latest Press Release
- Industry Association
- Paid Database
- Investor Presentations

Step 4 - Data Triangulation
Involves using different sources of information in order to increase the validity of a study
These sources are likely to be stakeholders in a program - participants, other researchers, program staff, other community members, and so on.
Then we put all data in single framework & apply various statistical tools to find out the dynamic on the market.
During the analysis stage, feedback from the stakeholder groups would be compared to determine areas of agreement as well as areas of divergence


