
Key Insights
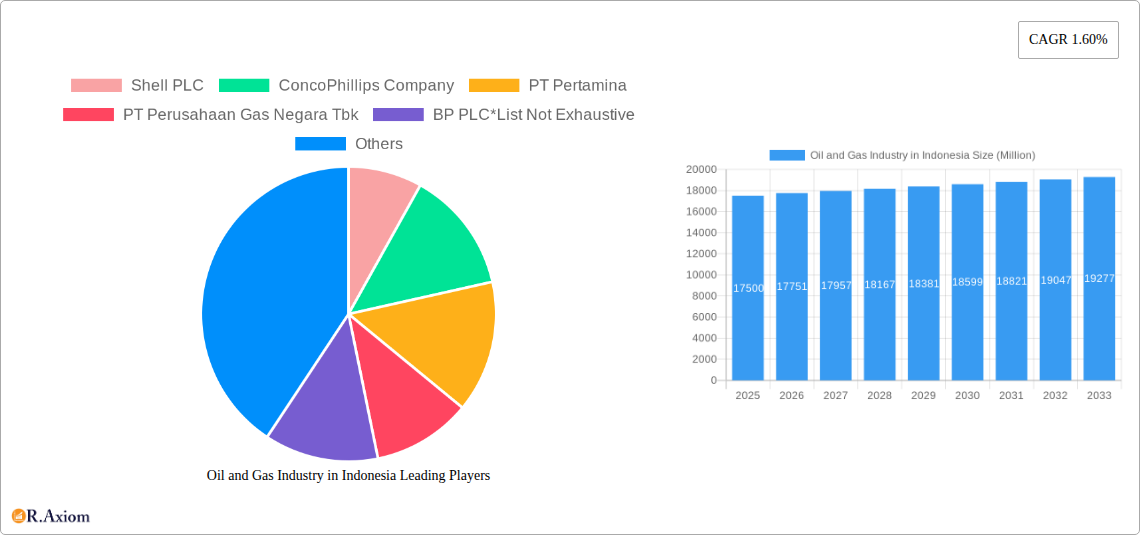
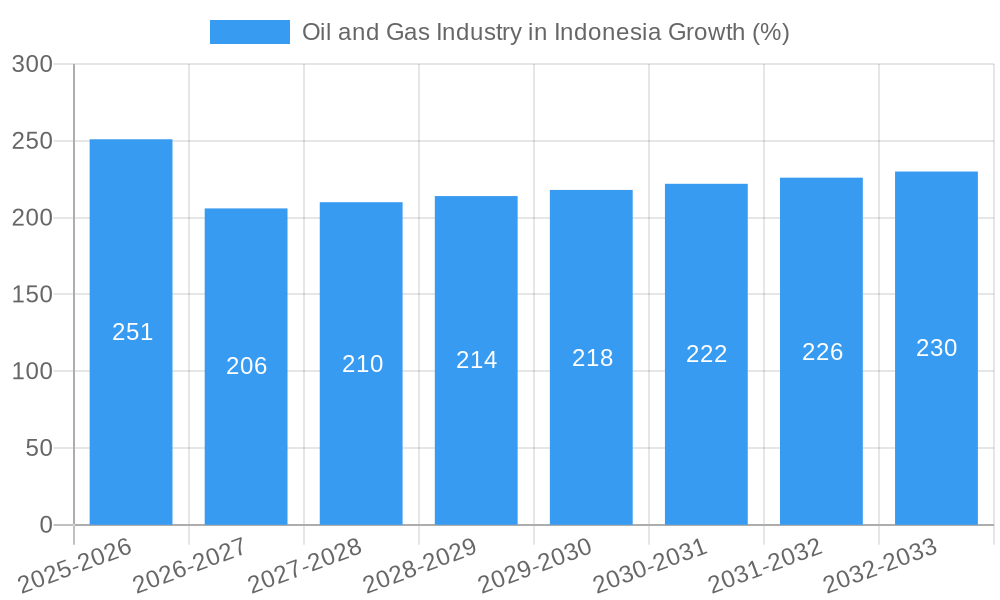
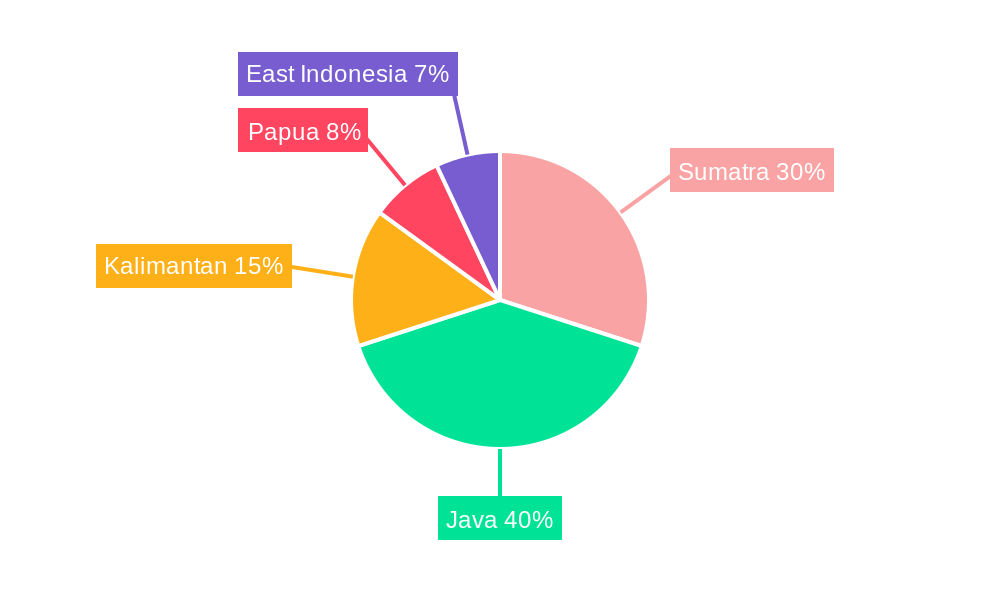
The Indonesian oil and gas market, valued at $17,500 million in 2025, is projected to experience steady growth, driven by robust energy demand from its expanding population and industrial sectors. A compound annual growth rate (CAGR) of 1.60% from 2025 to 2033 indicates a gradual but consistent expansion. Key drivers include increasing electricity generation needs, the nation's growing transportation sector, and rising industrial activity across Sumatra, Java, Kalimantan, Papua, and East Indonesia. The market is segmented by product (crude oil, natural gas, refined products), application (power generation, transportation, industrial, residential), and region, reflecting diverse consumption patterns and regional development priorities. While government regulations and fluctuating global energy prices present potential restraints, Indonesia's substantial reserves and strategic location offer opportunities for further investment and market penetration. Major players like Pertamina, Perusahaan Gas Negara, Shell, and ExxonMobil are actively shaping the market landscape, influencing production, distribution, and pricing dynamics. The steady growth is expected to continue, primarily fueled by sustained domestic demand and ongoing infrastructure development.
The forecast for the Indonesian oil and gas market between 2025 and 2033 suggests a gradual increase in market value, driven by consistent energy consumption increases across various sectors. While the 1.60% CAGR may seem modest, it reflects a stable growth trajectory within a mature market. Competition amongst established international and domestic players ensures efficiency and price competitiveness, although potential disruptions from global price volatility and geopolitical factors remain possibilities. Government initiatives promoting sustainable energy sources, alongside the continued demand for fossil fuels in transportation and industrial activities, will likely shape the long-term evolution of this market. The regional distribution of oil and gas resources and infrastructure will continue to influence regional market shares, with Java and Sumatra likely maintaining significant portions due to high population density and established industrial hubs.
Oil and Gas Industry in Indonesia: A Comprehensive Market Report (2019-2033)
This comprehensive report provides an in-depth analysis of Indonesia's oil and gas industry, covering market dynamics, key players, and future growth prospects from 2019 to 2033. With a base year of 2025 and a forecast period spanning 2025-2033, this report is essential for industry stakeholders seeking actionable insights and strategic guidance. The report leverages extensive data analysis to offer precise market sizing, growth projections, and competitive landscapes. It highlights significant developments, challenges, and opportunities in one of Asia's most crucial energy markets. High-traffic keywords include "Indonesia oil and gas," "Indonesian energy market," "Pertamina," "natural gas Indonesia," "crude oil Indonesia," and "oil and gas investment Indonesia."
Oil and Gas Industry in Indonesia Market Concentration & Innovation
Indonesia's oil and gas sector exhibits a concentrated market structure, dominated by national champion PT Pertamina, alongside international giants like Shell PLC, Chevron Corporation, and ExxonMobil Corporation. Smaller players like PT Perusahaan Gas Negara Tbk and Medco Energi Internasional Tbk contribute significantly to specific segments. Market share data for 2024 indicates PT Pertamina holds approximately xx% market share, followed by Shell PLC with xx%, and Chevron Corporation with xx%. These figures are subject to change, but illustrate dominance among the key players.
Innovation in the Indonesian oil and gas sector is driven by several factors:
- Regulatory Framework: Government policies focusing on maximizing domestic resource utilization and increasing energy security are influencing technological advancement.
- Product Substitutes: Growing renewable energy adoption is pushing companies to improve efficiency and reduce carbon footprints.
- End-User Trends: Increased demand for cleaner energy sources among industrial and residential users is driving innovation in gas processing and distribution.
- M&A Activity: Consolidation through mergers and acquisitions (M&A) is leading to resource optimization and technological synergy. For example, the xx Million USD deal in 2023 between Company A and Company B demonstrates this trend, though specific deal values are constantly changing.
Oil and Gas Industry in Indonesia Industry Trends & Insights
Indonesia's oil and gas market is witnessing robust growth driven by rising domestic energy demand, particularly in power generation and transportation. The compound annual growth rate (CAGR) for the forecast period (2025-2033) is estimated at xx%, driven largely by sustained economic growth and infrastructure development. The market penetration of natural gas in power generation is increasing at a rate of xx% annually, while the transportation sector's reliance on refined petroleum products is showing a slower growth at around xx% annually. This variation is influenced by the government's push toward cleaner energy solutions and the ongoing challenges of infrastructure development in some regions. Technological disruptions, particularly in enhanced oil recovery (EOR) and digitalization of operations, are improving efficiency and reducing costs. However, volatility in global oil and gas prices poses a substantial challenge to market stability and investor confidence. Consumer preference for cleaner energy options continues to influence the industry to diversify its portfolio and adapt to a more sustainable model. Competitive dynamics are marked by ongoing efforts to enhance operational efficiency, secure upstream resources, and optimize downstream infrastructure.
Dominant Markets & Segments in Oil and Gas Industry in Indonesia
Regional Segmentation: Java remains the most dominant region due to its high population density and industrial activity. Kalimantan and Sumatra also contribute significantly due to their extensive hydrocarbon reserves. Papua is emerging but lags behind due to infrastructural and operational challenges.
Product Segmentation: Natural gas currently holds a significant share due to its expanding use in power generation and industrial applications. Crude oil remains a dominant export commodity. The market share for refined products is expected to grow moderately, driven by domestic demand.
Application Segmentation: Power generation is the largest consumer of natural gas, followed by the industrial sector. Transportation remains heavily reliant on refined petroleum products. Residential use is growing gradually due to increased access to natural gas networks in urban areas.
Key drivers for the dominant segments include:
- Economic policies: Government incentives for energy infrastructure development and gas utilization are boosting market growth.
- Infrastructure development: Investments in pipelines, refineries, and LNG facilities are expanding market access.
Oil and Gas Industry in Indonesia Product Developments
Recent innovations focus on optimizing extraction techniques for enhanced oil recovery (EOR) and utilizing advanced analytics to improve operational efficiency. There is a growing focus on developing cleaner-burning fuels and exploring renewable energy integration to align with global environmental sustainability goals. These innovations are crucial for maintaining competitiveness in the changing global energy landscape and for reducing environmental impact. The market fit for these innovations is strong given the increasing pressure to reduce carbon emissions and the growing demand for sustainable energy solutions.
Report Scope & Segmentation Analysis
This report covers the Indonesian oil and gas market across three key segments:
Product Segmentation: Crude oil, natural gas, and refined products (gasoline, diesel, etc.). Growth projections vary widely; natural gas shows the highest expected CAGR, followed by refined products and then crude oil.
Application Segmentation: Power generation, transportation, industrial use, and residential use. The fastest-growing segment is residential due to improving infrastructure in underserved areas.
Regional Segmentation: Sumatra, Java, Kalimantan, Papua, and East Indonesia. Java and Kalimantan lead due to strong existing infrastructure and extensive reserves. Papua shows the highest growth potential but faces infrastructure development constraints. Competitive dynamics vary by region and product, with intense competition in mature regions and more fragmented markets in emerging areas.
Key Drivers of Oil and Gas Industry in Indonesia Growth
Several factors fuel growth in Indonesia's oil and gas sector: robust domestic demand driven by economic growth, government incentives promoting energy infrastructure development, and ongoing exploration activities uncovering new reserves. Technological advancements in EOR techniques and gas processing enhance efficiency and reduce production costs. Stable regulatory frameworks and supportive government policies further underpin industry expansion.
Challenges in the Oil and Gas Industry in Indonesia Sector
Challenges include infrastructure limitations, particularly in remote areas. Supply chain vulnerabilities and fluctuating global oil and gas prices add uncertainty. Environmental concerns and the transition toward cleaner energy sources pose significant long-term risks. These factors have caused projected revenue shortfalls of approximately xx Million in 2024 compared to initial projections.
Emerging Opportunities in Oil and Gas Industry in Indonesia
Opportunities include expanding gas infrastructure to reach underserved regions and increasing LNG export capacity. Investment in renewable energy integration and carbon capture technologies will become increasingly important. Developing local talent and expertise through skills development programs will help overcome manpower shortages.
Leading Players in the Oil and Gas Industry in Indonesia Market
- Shell PLC
- ConocoPhillips Company
- PT Pertamina
- PT Perusahaan Gas Negara Tbk
- BP PLC
- Chevron Corporation
- Petroliam Nasional Berhad
- PT Connusa Energindo
- ExxonMobil Corporation
- China National Offshore Oil Corporation
Key Developments in Oil and Gas Industry in Indonesia Industry
- June 2023: Sembcorp Industries signed a USD 1.41 billion gas sales agreement with Medco Energi International, signifying significant export potential for Indonesian gas resources.
- November 2022: Medco Energy Internasional Tbk secured a five-year gas supply agreement with Singapore, strengthening Indonesia's position as a regional gas supplier.
Strategic Outlook for Oil and Gas Industry in Indonesia Market
Indonesia's oil and gas sector is poised for continued growth, driven by rising domestic energy demand and strategic investments in infrastructure. Successful navigation of the transition towards a lower-carbon energy future, through strategic partnerships and technological advancements, will determine the long-term prosperity of the sector. This necessitates increased investment in renewable energy integration and carbon capture technology. Furthermore, efficient resource management and the development of a skilled workforce will be crucial for sustained growth and market competitiveness.
Oil and Gas Industry in Indonesia Segmentation
- 1. Upstream
- 2. Midstream
- 3. Downstream
Oil and Gas Industry in Indonesia Segmentation By Geography
-
1. North America
- 1.1. United States
- 1.2. Canada
- 1.3. Mexico
-
2. South America
- 2.1. Brazil
- 2.2. Argentina
- 2.3. Rest of South America
-
3. Europe
- 3.1. United Kingdom
- 3.2. Germany
- 3.3. France
- 3.4. Italy
- 3.5. Spain
- 3.6. Russia
- 3.7. Benelux
- 3.8. Nordics
- 3.9. Rest of Europe
-
4. Middle East & Africa
- 4.1. Turkey
- 4.2. Israel
- 4.3. GCC
- 4.4. North Africa
- 4.5. South Africa
- 4.6. Rest of Middle East & Africa
-
5. Asia Pacific
- 5.1. China
- 5.2. India
- 5.3. Japan
- 5.4. South Korea
- 5.5. ASEAN
- 5.6. Oceania
- 5.7. Rest of Asia Pacific
Oil and Gas Industry in Indonesia REPORT HIGHLIGHTS
| Aspects | Details |
|---|---|
| Study Period | 2019-2033 |
| Base Year | 2024 |
| Estimated Year | 2025 |
| Forecast Period | 2025-2033 |
| Historical Period | 2019-2024 |
| Growth Rate | CAGR of 1.60% from 2019-2033 |
| Segmentation |
|
Table of Contents
- 1. Introduction
- 1.1. Research Scope
- 1.2. Market Segmentation
- 1.3. Research Methodology
- 1.4. Definitions and Assumptions
- 2. Executive Summary
- 2.1. Introduction
- 3. Market Dynamics
- 3.1. Introduction
- 3.2. Market Drivers
- 3.2.1. 4.; Increasing Demand for Petroleum Products Due to the Growth of the Local Economy4.; Government Initiatives to Boost the Production of Crude Oil and Natural Gas
- 3.3. Market Restrains
- 3.3.1. 4.; Increasing Adoption of Renewable Energy
- 3.4. Market Trends
- 3.4.1. Upstream Sector Expected to Witness Significant Growth
- 4. Market Factor Analysis
- 4.1. Porters Five Forces
- 4.2. Supply/Value Chain
- 4.3. PESTEL analysis
- 4.4. Market Entropy
- 4.5. Patent/Trademark Analysis
- 5. Global Oil and Gas Industry in Indonesia Analysis, Insights and Forecast, 2019-2031
- 5.1. Market Analysis, Insights and Forecast - by Upstream
- 5.2. Market Analysis, Insights and Forecast - by Midstream
- 5.3. Market Analysis, Insights and Forecast - by Downstream
- 5.4. Market Analysis, Insights and Forecast - by Region
- 5.4.1. North America
- 5.4.2. South America
- 5.4.3. Europe
- 5.4.4. Middle East & Africa
- 5.4.5. Asia Pacific
- 5.1. Market Analysis, Insights and Forecast - by Upstream
- 6. North America Oil and Gas Industry in Indonesia Analysis, Insights and Forecast, 2019-2031
- 6.1. Market Analysis, Insights and Forecast - by Upstream
- 6.2. Market Analysis, Insights and Forecast - by Midstream
- 6.3. Market Analysis, Insights and Forecast - by Downstream
- 6.1. Market Analysis, Insights and Forecast - by Upstream
- 7. South America Oil and Gas Industry in Indonesia Analysis, Insights and Forecast, 2019-2031
- 7.1. Market Analysis, Insights and Forecast - by Upstream
- 7.2. Market Analysis, Insights and Forecast - by Midstream
- 7.3. Market Analysis, Insights and Forecast - by Downstream
- 7.1. Market Analysis, Insights and Forecast - by Upstream
- 8. Europe Oil and Gas Industry in Indonesia Analysis, Insights and Forecast, 2019-2031
- 8.1. Market Analysis, Insights and Forecast - by Upstream
- 8.2. Market Analysis, Insights and Forecast - by Midstream
- 8.3. Market Analysis, Insights and Forecast - by Downstream
- 8.1. Market Analysis, Insights and Forecast - by Upstream
- 9. Middle East & Africa Oil and Gas Industry in Indonesia Analysis, Insights and Forecast, 2019-2031
- 9.1. Market Analysis, Insights and Forecast - by Upstream
- 9.2. Market Analysis, Insights and Forecast - by Midstream
- 9.3. Market Analysis, Insights and Forecast - by Downstream
- 9.1. Market Analysis, Insights and Forecast - by Upstream
- 10. Asia Pacific Oil and Gas Industry in Indonesia Analysis, Insights and Forecast, 2019-2031
- 10.1. Market Analysis, Insights and Forecast - by Upstream
- 10.2. Market Analysis, Insights and Forecast - by Midstream
- 10.3. Market Analysis, Insights and Forecast - by Downstream
- 10.1. Market Analysis, Insights and Forecast - by Upstream
- 11. Competitive Analysis
- 11.1. Global Market Share Analysis 2024
- 11.2. Company Profiles
- 11.2.1 Shell PLC
- 11.2.1.1. Overview
- 11.2.1.2. Products
- 11.2.1.3. SWOT Analysis
- 11.2.1.4. Recent Developments
- 11.2.1.5. Financials (Based on Availability)
- 11.2.2 ConcoPhillips Company
- 11.2.2.1. Overview
- 11.2.2.2. Products
- 11.2.2.3. SWOT Analysis
- 11.2.2.4. Recent Developments
- 11.2.2.5. Financials (Based on Availability)
- 11.2.3 PT Pertamina
- 11.2.3.1. Overview
- 11.2.3.2. Products
- 11.2.3.3. SWOT Analysis
- 11.2.3.4. Recent Developments
- 11.2.3.5. Financials (Based on Availability)
- 11.2.4 PT Perusahaan Gas Negara Tbk
- 11.2.4.1. Overview
- 11.2.4.2. Products
- 11.2.4.3. SWOT Analysis
- 11.2.4.4. Recent Developments
- 11.2.4.5. Financials (Based on Availability)
- 11.2.5 BP PLC*List Not Exhaustive
- 11.2.5.1. Overview
- 11.2.5.2. Products
- 11.2.5.3. SWOT Analysis
- 11.2.5.4. Recent Developments
- 11.2.5.5. Financials (Based on Availability)
- 11.2.6 Chevron Corporation
- 11.2.6.1. Overview
- 11.2.6.2. Products
- 11.2.6.3. SWOT Analysis
- 11.2.6.4. Recent Developments
- 11.2.6.5. Financials (Based on Availability)
- 11.2.7 Petroliam Nasional Berhad
- 11.2.7.1. Overview
- 11.2.7.2. Products
- 11.2.7.3. SWOT Analysis
- 11.2.7.4. Recent Developments
- 11.2.7.5. Financials (Based on Availability)
- 11.2.8 PT Connusa Energindo
- 11.2.8.1. Overview
- 11.2.8.2. Products
- 11.2.8.3. SWOT Analysis
- 11.2.8.4. Recent Developments
- 11.2.8.5. Financials (Based on Availability)
- 11.2.9 ExxonMobil Corporatoin
- 11.2.9.1. Overview
- 11.2.9.2. Products
- 11.2.9.3. SWOT Analysis
- 11.2.9.4. Recent Developments
- 11.2.9.5. Financials (Based on Availability)
- 11.2.10 China National Offshore Oil Corporation
- 11.2.10.1. Overview
- 11.2.10.2. Products
- 11.2.10.3. SWOT Analysis
- 11.2.10.4. Recent Developments
- 11.2.10.5. Financials (Based on Availability)
- 11.2.1 Shell PLC
List of Figures
- Figure 1: Global Oil and Gas Industry in Indonesia Revenue Breakdown (Million, %) by Region 2024 & 2032
- Figure 2: Global Oil and Gas Industry in Indonesia Volume Breakdown (Thousand, %) by Region 2024 & 2032
- Figure 3: Indonesia Oil and Gas Industry in Indonesia Revenue (Million), by Country 2024 & 2032
- Figure 4: Indonesia Oil and Gas Industry in Indonesia Volume (Thousand), by Country 2024 & 2032
- Figure 5: Indonesia Oil and Gas Industry in Indonesia Revenue Share (%), by Country 2024 & 2032
- Figure 6: Indonesia Oil and Gas Industry in Indonesia Volume Share (%), by Country 2024 & 2032
- Figure 7: North America Oil and Gas Industry in Indonesia Revenue (Million), by Upstream 2024 & 2032
- Figure 8: North America Oil and Gas Industry in Indonesia Volume (Thousand), by Upstream 2024 & 2032
- Figure 9: North America Oil and Gas Industry in Indonesia Revenue Share (%), by Upstream 2024 & 2032
- Figure 10: North America Oil and Gas Industry in Indonesia Volume Share (%), by Upstream 2024 & 2032
- Figure 11: North America Oil and Gas Industry in Indonesia Revenue (Million), by Midstream 2024 & 2032
- Figure 12: North America Oil and Gas Industry in Indonesia Volume (Thousand), by Midstream 2024 & 2032
- Figure 13: North America Oil and Gas Industry in Indonesia Revenue Share (%), by Midstream 2024 & 2032
- Figure 14: North America Oil and Gas Industry in Indonesia Volume Share (%), by Midstream 2024 & 2032
- Figure 15: North America Oil and Gas Industry in Indonesia Revenue (Million), by Downstream 2024 & 2032
- Figure 16: North America Oil and Gas Industry in Indonesia Volume (Thousand), by Downstream 2024 & 2032
- Figure 17: North America Oil and Gas Industry in Indonesia Revenue Share (%), by Downstream 2024 & 2032
- Figure 18: North America Oil and Gas Industry in Indonesia Volume Share (%), by Downstream 2024 & 2032
- Figure 19: North America Oil and Gas Industry in Indonesia Revenue (Million), by Country 2024 & 2032
- Figure 20: North America Oil and Gas Industry in Indonesia Volume (Thousand), by Country 2024 & 2032
- Figure 21: North America Oil and Gas Industry in Indonesia Revenue Share (%), by Country 2024 & 2032
- Figure 22: North America Oil and Gas Industry in Indonesia Volume Share (%), by Country 2024 & 2032
- Figure 23: South America Oil and Gas Industry in Indonesia Revenue (Million), by Upstream 2024 & 2032
- Figure 24: South America Oil and Gas Industry in Indonesia Volume (Thousand), by Upstream 2024 & 2032
- Figure 25: South America Oil and Gas Industry in Indonesia Revenue Share (%), by Upstream 2024 & 2032
- Figure 26: South America Oil and Gas Industry in Indonesia Volume Share (%), by Upstream 2024 & 2032
- Figure 27: South America Oil and Gas Industry in Indonesia Revenue (Million), by Midstream 2024 & 2032
- Figure 28: South America Oil and Gas Industry in Indonesia Volume (Thousand), by Midstream 2024 & 2032
- Figure 29: South America Oil and Gas Industry in Indonesia Revenue Share (%), by Midstream 2024 & 2032
- Figure 30: South America Oil and Gas Industry in Indonesia Volume Share (%), by Midstream 2024 & 2032
- Figure 31: South America Oil and Gas Industry in Indonesia Revenue (Million), by Downstream 2024 & 2032
- Figure 32: South America Oil and Gas Industry in Indonesia Volume (Thousand), by Downstream 2024 & 2032
- Figure 33: South America Oil and Gas Industry in Indonesia Revenue Share (%), by Downstream 2024 & 2032
- Figure 34: South America Oil and Gas Industry in Indonesia Volume Share (%), by Downstream 2024 & 2032
- Figure 35: South America Oil and Gas Industry in Indonesia Revenue (Million), by Country 2024 & 2032
- Figure 36: South America Oil and Gas Industry in Indonesia Volume (Thousand), by Country 2024 & 2032
- Figure 37: South America Oil and Gas Industry in Indonesia Revenue Share (%), by Country 2024 & 2032
- Figure 38: South America Oil and Gas Industry in Indonesia Volume Share (%), by Country 2024 & 2032
- Figure 39: Europe Oil and Gas Industry in Indonesia Revenue (Million), by Upstream 2024 & 2032
- Figure 40: Europe Oil and Gas Industry in Indonesia Volume (Thousand), by Upstream 2024 & 2032
- Figure 41: Europe Oil and Gas Industry in Indonesia Revenue Share (%), by Upstream 2024 & 2032
- Figure 42: Europe Oil and Gas Industry in Indonesia Volume Share (%), by Upstream 2024 & 2032
- Figure 43: Europe Oil and Gas Industry in Indonesia Revenue (Million), by Midstream 2024 & 2032
- Figure 44: Europe Oil and Gas Industry in Indonesia Volume (Thousand), by Midstream 2024 & 2032
- Figure 45: Europe Oil and Gas Industry in Indonesia Revenue Share (%), by Midstream 2024 & 2032
- Figure 46: Europe Oil and Gas Industry in Indonesia Volume Share (%), by Midstream 2024 & 2032
- Figure 47: Europe Oil and Gas Industry in Indonesia Revenue (Million), by Downstream 2024 & 2032
- Figure 48: Europe Oil and Gas Industry in Indonesia Volume (Thousand), by Downstream 2024 & 2032
- Figure 49: Europe Oil and Gas Industry in Indonesia Revenue Share (%), by Downstream 2024 & 2032
- Figure 50: Europe Oil and Gas Industry in Indonesia Volume Share (%), by Downstream 2024 & 2032
- Figure 51: Europe Oil and Gas Industry in Indonesia Revenue (Million), by Country 2024 & 2032
- Figure 52: Europe Oil and Gas Industry in Indonesia Volume (Thousand), by Country 2024 & 2032
- Figure 53: Europe Oil and Gas Industry in Indonesia Revenue Share (%), by Country 2024 & 2032
- Figure 54: Europe Oil and Gas Industry in Indonesia Volume Share (%), by Country 2024 & 2032
- Figure 55: Middle East & Africa Oil and Gas Industry in Indonesia Revenue (Million), by Upstream 2024 & 2032
- Figure 56: Middle East & Africa Oil and Gas Industry in Indonesia Volume (Thousand), by Upstream 2024 & 2032
- Figure 57: Middle East & Africa Oil and Gas Industry in Indonesia Revenue Share (%), by Upstream 2024 & 2032
- Figure 58: Middle East & Africa Oil and Gas Industry in Indonesia Volume Share (%), by Upstream 2024 & 2032
- Figure 59: Middle East & Africa Oil and Gas Industry in Indonesia Revenue (Million), by Midstream 2024 & 2032
- Figure 60: Middle East & Africa Oil and Gas Industry in Indonesia Volume (Thousand), by Midstream 2024 & 2032
- Figure 61: Middle East & Africa Oil and Gas Industry in Indonesia Revenue Share (%), by Midstream 2024 & 2032
- Figure 62: Middle East & Africa Oil and Gas Industry in Indonesia Volume Share (%), by Midstream 2024 & 2032
- Figure 63: Middle East & Africa Oil and Gas Industry in Indonesia Revenue (Million), by Downstream 2024 & 2032
- Figure 64: Middle East & Africa Oil and Gas Industry in Indonesia Volume (Thousand), by Downstream 2024 & 2032
- Figure 65: Middle East & Africa Oil and Gas Industry in Indonesia Revenue Share (%), by Downstream 2024 & 2032
- Figure 66: Middle East & Africa Oil and Gas Industry in Indonesia Volume Share (%), by Downstream 2024 & 2032
- Figure 67: Middle East & Africa Oil and Gas Industry in Indonesia Revenue (Million), by Country 2024 & 2032
- Figure 68: Middle East & Africa Oil and Gas Industry in Indonesia Volume (Thousand), by Country 2024 & 2032
- Figure 69: Middle East & Africa Oil and Gas Industry in Indonesia Revenue Share (%), by Country 2024 & 2032
- Figure 70: Middle East & Africa Oil and Gas Industry in Indonesia Volume Share (%), by Country 2024 & 2032
- Figure 71: Asia Pacific Oil and Gas Industry in Indonesia Revenue (Million), by Upstream 2024 & 2032
- Figure 72: Asia Pacific Oil and Gas Industry in Indonesia Volume (Thousand), by Upstream 2024 & 2032
- Figure 73: Asia Pacific Oil and Gas Industry in Indonesia Revenue Share (%), by Upstream 2024 & 2032
- Figure 74: Asia Pacific Oil and Gas Industry in Indonesia Volume Share (%), by Upstream 2024 & 2032
- Figure 75: Asia Pacific Oil and Gas Industry in Indonesia Revenue (Million), by Midstream 2024 & 2032
- Figure 76: Asia Pacific Oil and Gas Industry in Indonesia Volume (Thousand), by Midstream 2024 & 2032
- Figure 77: Asia Pacific Oil and Gas Industry in Indonesia Revenue Share (%), by Midstream 2024 & 2032
- Figure 78: Asia Pacific Oil and Gas Industry in Indonesia Volume Share (%), by Midstream 2024 & 2032
- Figure 79: Asia Pacific Oil and Gas Industry in Indonesia Revenue (Million), by Downstream 2024 & 2032
- Figure 80: Asia Pacific Oil and Gas Industry in Indonesia Volume (Thousand), by Downstream 2024 & 2032
- Figure 81: Asia Pacific Oil and Gas Industry in Indonesia Revenue Share (%), by Downstream 2024 & 2032
- Figure 82: Asia Pacific Oil and Gas Industry in Indonesia Volume Share (%), by Downstream 2024 & 2032
- Figure 83: Asia Pacific Oil and Gas Industry in Indonesia Revenue (Million), by Country 2024 & 2032
- Figure 84: Asia Pacific Oil and Gas Industry in Indonesia Volume (Thousand), by Country 2024 & 2032
- Figure 85: Asia Pacific Oil and Gas Industry in Indonesia Revenue Share (%), by Country 2024 & 2032
- Figure 86: Asia Pacific Oil and Gas Industry in Indonesia Volume Share (%), by Country 2024 & 2032
List of Tables
- Table 1: Global Oil and Gas Industry in Indonesia Revenue Million Forecast, by Region 2019 & 2032
- Table 2: Global Oil and Gas Industry in Indonesia Volume Thousand Forecast, by Region 2019 & 2032
- Table 3: Global Oil and Gas Industry in Indonesia Revenue Million Forecast, by Upstream 2019 & 2032
- Table 4: Global Oil and Gas Industry in Indonesia Volume Thousand Forecast, by Upstream 2019 & 2032
- Table 5: Global Oil and Gas Industry in Indonesia Revenue Million Forecast, by Midstream 2019 & 2032
- Table 6: Global Oil and Gas Industry in Indonesia Volume Thousand Forecast, by Midstream 2019 & 2032
- Table 7: Global Oil and Gas Industry in Indonesia Revenue Million Forecast, by Downstream 2019 & 2032
- Table 8: Global Oil and Gas Industry in Indonesia Volume Thousand Forecast, by Downstream 2019 & 2032
- Table 9: Global Oil and Gas Industry in Indonesia Revenue Million Forecast, by Region 2019 & 2032
- Table 10: Global Oil and Gas Industry in Indonesia Volume Thousand Forecast, by Region 2019 & 2032
- Table 11: Global Oil and Gas Industry in Indonesia Revenue Million Forecast, by Country 2019 & 2032
- Table 12: Global Oil and Gas Industry in Indonesia Volume Thousand Forecast, by Country 2019 & 2032
- Table 13: Global Oil and Gas Industry in Indonesia Revenue Million Forecast, by Upstream 2019 & 2032
- Table 14: Global Oil and Gas Industry in Indonesia Volume Thousand Forecast, by Upstream 2019 & 2032
- Table 15: Global Oil and Gas Industry in Indonesia Revenue Million Forecast, by Midstream 2019 & 2032
- Table 16: Global Oil and Gas Industry in Indonesia Volume Thousand Forecast, by Midstream 2019 & 2032
- Table 17: Global Oil and Gas Industry in Indonesia Revenue Million Forecast, by Downstream 2019 & 2032
- Table 18: Global Oil and Gas Industry in Indonesia Volume Thousand Forecast, by Downstream 2019 & 2032
- Table 19: Global Oil and Gas Industry in Indonesia Revenue Million Forecast, by Country 2019 & 2032
- Table 20: Global Oil and Gas Industry in Indonesia Volume Thousand Forecast, by Country 2019 & 2032
- Table 21: United States Oil and Gas Industry in Indonesia Revenue (Million) Forecast, by Application 2019 & 2032
- Table 22: United States Oil and Gas Industry in Indonesia Volume (Thousand) Forecast, by Application 2019 & 2032
- Table 23: Canada Oil and Gas Industry in Indonesia Revenue (Million) Forecast, by Application 2019 & 2032
- Table 24: Canada Oil and Gas Industry in Indonesia Volume (Thousand) Forecast, by Application 2019 & 2032
- Table 25: Mexico Oil and Gas Industry in Indonesia Revenue (Million) Forecast, by Application 2019 & 2032
- Table 26: Mexico Oil and Gas Industry in Indonesia Volume (Thousand) Forecast, by Application 2019 & 2032
- Table 27: Global Oil and Gas Industry in Indonesia Revenue Million Forecast, by Upstream 2019 & 2032
- Table 28: Global Oil and Gas Industry in Indonesia Volume Thousand Forecast, by Upstream 2019 & 2032
- Table 29: Global Oil and Gas Industry in Indonesia Revenue Million Forecast, by Midstream 2019 & 2032
- Table 30: Global Oil and Gas Industry in Indonesia Volume Thousand Forecast, by Midstream 2019 & 2032
- Table 31: Global Oil and Gas Industry in Indonesia Revenue Million Forecast, by Downstream 2019 & 2032
- Table 32: Global Oil and Gas Industry in Indonesia Volume Thousand Forecast, by Downstream 2019 & 2032
- Table 33: Global Oil and Gas Industry in Indonesia Revenue Million Forecast, by Country 2019 & 2032
- Table 34: Global Oil and Gas Industry in Indonesia Volume Thousand Forecast, by Country 2019 & 2032
- Table 35: Brazil Oil and Gas Industry in Indonesia Revenue (Million) Forecast, by Application 2019 & 2032
- Table 36: Brazil Oil and Gas Industry in Indonesia Volume (Thousand) Forecast, by Application 2019 & 2032
- Table 37: Argentina Oil and Gas Industry in Indonesia Revenue (Million) Forecast, by Application 2019 & 2032
- Table 38: Argentina Oil and Gas Industry in Indonesia Volume (Thousand) Forecast, by Application 2019 & 2032
- Table 39: Rest of South America Oil and Gas Industry in Indonesia Revenue (Million) Forecast, by Application 2019 & 2032
- Table 40: Rest of South America Oil and Gas Industry in Indonesia Volume (Thousand) Forecast, by Application 2019 & 2032
- Table 41: Global Oil and Gas Industry in Indonesia Revenue Million Forecast, by Upstream 2019 & 2032
- Table 42: Global Oil and Gas Industry in Indonesia Volume Thousand Forecast, by Upstream 2019 & 2032
- Table 43: Global Oil and Gas Industry in Indonesia Revenue Million Forecast, by Midstream 2019 & 2032
- Table 44: Global Oil and Gas Industry in Indonesia Volume Thousand Forecast, by Midstream 2019 & 2032
- Table 45: Global Oil and Gas Industry in Indonesia Revenue Million Forecast, by Downstream 2019 & 2032
- Table 46: Global Oil and Gas Industry in Indonesia Volume Thousand Forecast, by Downstream 2019 & 2032
- Table 47: Global Oil and Gas Industry in Indonesia Revenue Million Forecast, by Country 2019 & 2032
- Table 48: Global Oil and Gas Industry in Indonesia Volume Thousand Forecast, by Country 2019 & 2032
- Table 49: United Kingdom Oil and Gas Industry in Indonesia Revenue (Million) Forecast, by Application 2019 & 2032
- Table 50: United Kingdom Oil and Gas Industry in Indonesia Volume (Thousand) Forecast, by Application 2019 & 2032
- Table 51: Germany Oil and Gas Industry in Indonesia Revenue (Million) Forecast, by Application 2019 & 2032
- Table 52: Germany Oil and Gas Industry in Indonesia Volume (Thousand) Forecast, by Application 2019 & 2032
- Table 53: France Oil and Gas Industry in Indonesia Revenue (Million) Forecast, by Application 2019 & 2032
- Table 54: France Oil and Gas Industry in Indonesia Volume (Thousand) Forecast, by Application 2019 & 2032
- Table 55: Italy Oil and Gas Industry in Indonesia Revenue (Million) Forecast, by Application 2019 & 2032
- Table 56: Italy Oil and Gas Industry in Indonesia Volume (Thousand) Forecast, by Application 2019 & 2032
- Table 57: Spain Oil and Gas Industry in Indonesia Revenue (Million) Forecast, by Application 2019 & 2032
- Table 58: Spain Oil and Gas Industry in Indonesia Volume (Thousand) Forecast, by Application 2019 & 2032
- Table 59: Russia Oil and Gas Industry in Indonesia Revenue (Million) Forecast, by Application 2019 & 2032
- Table 60: Russia Oil and Gas Industry in Indonesia Volume (Thousand) Forecast, by Application 2019 & 2032
- Table 61: Benelux Oil and Gas Industry in Indonesia Revenue (Million) Forecast, by Application 2019 & 2032
- Table 62: Benelux Oil and Gas Industry in Indonesia Volume (Thousand) Forecast, by Application 2019 & 2032
- Table 63: Nordics Oil and Gas Industry in Indonesia Revenue (Million) Forecast, by Application 2019 & 2032
- Table 64: Nordics Oil and Gas Industry in Indonesia Volume (Thousand) Forecast, by Application 2019 & 2032
- Table 65: Rest of Europe Oil and Gas Industry in Indonesia Revenue (Million) Forecast, by Application 2019 & 2032
- Table 66: Rest of Europe Oil and Gas Industry in Indonesia Volume (Thousand) Forecast, by Application 2019 & 2032
- Table 67: Global Oil and Gas Industry in Indonesia Revenue Million Forecast, by Upstream 2019 & 2032
- Table 68: Global Oil and Gas Industry in Indonesia Volume Thousand Forecast, by Upstream 2019 & 2032
- Table 69: Global Oil and Gas Industry in Indonesia Revenue Million Forecast, by Midstream 2019 & 2032
- Table 70: Global Oil and Gas Industry in Indonesia Volume Thousand Forecast, by Midstream 2019 & 2032
- Table 71: Global Oil and Gas Industry in Indonesia Revenue Million Forecast, by Downstream 2019 & 2032
- Table 72: Global Oil and Gas Industry in Indonesia Volume Thousand Forecast, by Downstream 2019 & 2032
- Table 73: Global Oil and Gas Industry in Indonesia Revenue Million Forecast, by Country 2019 & 2032
- Table 74: Global Oil and Gas Industry in Indonesia Volume Thousand Forecast, by Country 2019 & 2032
- Table 75: Turkey Oil and Gas Industry in Indonesia Revenue (Million) Forecast, by Application 2019 & 2032
- Table 76: Turkey Oil and Gas Industry in Indonesia Volume (Thousand) Forecast, by Application 2019 & 2032
- Table 77: Israel Oil and Gas Industry in Indonesia Revenue (Million) Forecast, by Application 2019 & 2032
- Table 78: Israel Oil and Gas Industry in Indonesia Volume (Thousand) Forecast, by Application 2019 & 2032
- Table 79: GCC Oil and Gas Industry in Indonesia Revenue (Million) Forecast, by Application 2019 & 2032
- Table 80: GCC Oil and Gas Industry in Indonesia Volume (Thousand) Forecast, by Application 2019 & 2032
- Table 81: North Africa Oil and Gas Industry in Indonesia Revenue (Million) Forecast, by Application 2019 & 2032
- Table 82: North Africa Oil and Gas Industry in Indonesia Volume (Thousand) Forecast, by Application 2019 & 2032
- Table 83: South Africa Oil and Gas Industry in Indonesia Revenue (Million) Forecast, by Application 2019 & 2032
- Table 84: South Africa Oil and Gas Industry in Indonesia Volume (Thousand) Forecast, by Application 2019 & 2032
- Table 85: Rest of Middle East & Africa Oil and Gas Industry in Indonesia Revenue (Million) Forecast, by Application 2019 & 2032
- Table 86: Rest of Middle East & Africa Oil and Gas Industry in Indonesia Volume (Thousand) Forecast, by Application 2019 & 2032
- Table 87: Global Oil and Gas Industry in Indonesia Revenue Million Forecast, by Upstream 2019 & 2032
- Table 88: Global Oil and Gas Industry in Indonesia Volume Thousand Forecast, by Upstream 2019 & 2032
- Table 89: Global Oil and Gas Industry in Indonesia Revenue Million Forecast, by Midstream 2019 & 2032
- Table 90: Global Oil and Gas Industry in Indonesia Volume Thousand Forecast, by Midstream 2019 & 2032
- Table 91: Global Oil and Gas Industry in Indonesia Revenue Million Forecast, by Downstream 2019 & 2032
- Table 92: Global Oil and Gas Industry in Indonesia Volume Thousand Forecast, by Downstream 2019 & 2032
- Table 93: Global Oil and Gas Industry in Indonesia Revenue Million Forecast, by Country 2019 & 2032
- Table 94: Global Oil and Gas Industry in Indonesia Volume Thousand Forecast, by Country 2019 & 2032
- Table 95: China Oil and Gas Industry in Indonesia Revenue (Million) Forecast, by Application 2019 & 2032
- Table 96: China Oil and Gas Industry in Indonesia Volume (Thousand) Forecast, by Application 2019 & 2032
- Table 97: India Oil and Gas Industry in Indonesia Revenue (Million) Forecast, by Application 2019 & 2032
- Table 98: India Oil and Gas Industry in Indonesia Volume (Thousand) Forecast, by Application 2019 & 2032
- Table 99: Japan Oil and Gas Industry in Indonesia Revenue (Million) Forecast, by Application 2019 & 2032
- Table 100: Japan Oil and Gas Industry in Indonesia Volume (Thousand) Forecast, by Application 2019 & 2032
- Table 101: South Korea Oil and Gas Industry in Indonesia Revenue (Million) Forecast, by Application 2019 & 2032
- Table 102: South Korea Oil and Gas Industry in Indonesia Volume (Thousand) Forecast, by Application 2019 & 2032
- Table 103: ASEAN Oil and Gas Industry in Indonesia Revenue (Million) Forecast, by Application 2019 & 2032
- Table 104: ASEAN Oil and Gas Industry in Indonesia Volume (Thousand) Forecast, by Application 2019 & 2032
- Table 105: Oceania Oil and Gas Industry in Indonesia Revenue (Million) Forecast, by Application 2019 & 2032
- Table 106: Oceania Oil and Gas Industry in Indonesia Volume (Thousand) Forecast, by Application 2019 & 2032
- Table 107: Rest of Asia Pacific Oil and Gas Industry in Indonesia Revenue (Million) Forecast, by Application 2019 & 2032
- Table 108: Rest of Asia Pacific Oil and Gas Industry in Indonesia Volume (Thousand) Forecast, by Application 2019 & 2032
Frequently Asked Questions
1. What is the projected Compound Annual Growth Rate (CAGR) of the Oil and Gas Industry in Indonesia?
The projected CAGR is approximately 1.60%.
2. Which companies are prominent players in the Oil and Gas Industry in Indonesia?
Key companies in the market include Shell PLC, ConcoPhillips Company, PT Pertamina, PT Perusahaan Gas Negara Tbk, BP PLC*List Not Exhaustive, Chevron Corporation, Petroliam Nasional Berhad, PT Connusa Energindo, ExxonMobil Corporatoin, China National Offshore Oil Corporation.
3. What are the main segments of the Oil and Gas Industry in Indonesia?
The market segments include Upstream, Midstream, Downstream.
4. Can you provide details about the market size?
The market size is estimated to be USD 17500 Million as of 2022.
5. What are some drivers contributing to market growth?
4.; Increasing Demand for Petroleum Products Due to the Growth of the Local Economy4.; Government Initiatives to Boost the Production of Crude Oil and Natural Gas.
6. What are the notable trends driving market growth?
Upstream Sector Expected to Witness Significant Growth.
7. Are there any restraints impacting market growth?
4.; Increasing Adoption of Renewable Energy.
8. Can you provide examples of recent developments in the market?
June 2023: Sembcorp Industries signed a USD 1.41 billion gas sales agreement with Medco Energi International to import gas from an offshore play in Indonesia to Singapore. Gas will be obtained from the West Natuna gas field and dispatched to Singapore through the West Natuna-Singapore gas pipeline.
9. What pricing options are available for accessing the report?
Pricing options include single-user, multi-user, and enterprise licenses priced at USD 3800, USD 4500, and USD 5800 respectively.
10. Is the market size provided in terms of value or volume?
The market size is provided in terms of value, measured in Million and volume, measured in Thousand.
11. Are there any specific market keywords associated with the report?
Yes, the market keyword associated with the report is "Oil and Gas Industry in Indonesia," which aids in identifying and referencing the specific market segment covered.
12. How do I determine which pricing option suits my needs best?
The pricing options vary based on user requirements and access needs. Individual users may opt for single-user licenses, while businesses requiring broader access may choose multi-user or enterprise licenses for cost-effective access to the report.
13. Are there any additional resources or data provided in the Oil and Gas Industry in Indonesia report?
While the report offers comprehensive insights, it's advisable to review the specific contents or supplementary materials provided to ascertain if additional resources or data are available.
14. How can I stay updated on further developments or reports in the Oil and Gas Industry in Indonesia?
To stay informed about further developments, trends, and reports in the Oil and Gas Industry in Indonesia, consider subscribing to industry newsletters, following relevant companies and organizations, or regularly checking reputable industry news sources and publications.
Methodology
Step 1 - Identification of Relevant Samples Size from Population Database


Step 2 - Approaches for Defining Global Market Size (Value, Volume* & Price*)

Note*: In applicable scenarios
Step 3 - Data Sources
Primary Research
- Web Analytics
- Survey Reports
- Research Institute
- Latest Research Reports
- Opinion Leaders
Secondary Research
- Annual Reports
- White Paper
- Latest Press Release
- Industry Association
- Paid Database
- Investor Presentations

Step 4 - Data Triangulation
Involves using different sources of information in order to increase the validity of a study
These sources are likely to be stakeholders in a program - participants, other researchers, program staff, other community members, and so on.
Then we put all data in single framework & apply various statistical tools to find out the dynamic on the market.
During the analysis stage, feedback from the stakeholder groups would be compared to determine areas of agreement as well as areas of divergence


